Article
Timing the Landmark Events in the Evolution of Clear
Cell Renal Cell Cancer: TRACERx Renal
Graphical Abstract
Highlights
d
Novel hotspot of driver mutations in 5
0-UTR repressor of
TERT
, expanding telomeres
d
Most common cause of 3p loss is a chromothripsis event,
generating concurrent 5q gain
d
t(3;5) event occurs in childhood or adolescence, decades
before tumor diagnosed
d
Initial clonal expansion after 3p loss starts from only a few
hundred cells
Authors
Thomas J. Mitchell, Samra Turajlic,
Andrew Rowan, ..., Charles Swanton,
Peter J. Campbell, the TRACERx Renal
Consortium
Correspondence
charles.swanton@crick.ac.uk (C.S.),
pc8@sanger.ac.uk (P.J.C.)
In Brief
Combination of whole-genome
sequencing analysis and a multi-region
sampling approach provides insights into
the nature and timing of key oncogenic
events in clear cell renal cell carcinoma,
depicts the evolutionary trajectories of
tumors in patients and highlights the
opportunity for early intervention.
Chr 3p loss
Chr 3p loss
VHL
inactivation
VHL
inactivation
Diagnosis
Diagnosis
Timeline for clear cellrenal cell carcinoma
Childhood to adolescence
5-20 years
10-30 years
Chromothripsis with concurrent gain of 5q in 30-40%
Initial clonal expansion: Few hundred cells Initial clonal expansion:
Few hundred cells
Other clonal and subclonal drivers Other clonal and subclonal drivers
Mitchell et al., 2018, Cell173, 611–623
Article
Timing the Landmark Events in the Evolution
of Clear Cell Renal Cell Cancer: TRACERx Renal
Thomas J. Mitchell,1,2,21Samra Turajlic,3,4,21Andrew Rowan,3,21David Nicol,4,21James H.R. Farmery,5Tim O’Brien,6
Inigo Martincorena,1Patrick Tarpey,1Nicos Angelopoulos,1Lucy R. Yates,1,4Adam P. Butler,1Keiran Raine,1
Grant D. Stewart,2Ben Challacombe,6Archana Fernando,6Jose I. Lopez,7Steve Hazell,3Ashish Chandra,6
Simon Chowdhury,6Sarah Rudman,6Aspasia Soultati,6Gordon Stamp,8Nicos Fotiadis,9Lisa Pickering,4Lewis Au,4
Lavinia Spain,4Joanna Lynch,4Mark Stares,4Jon Teague,1Francesco Maura,1David C. Wedge,10Stuart Horswell,11
Tim Chambers,3Kevin Litchfield,3Hang Xu,3Aengus Stewart,11Reza Elaidi,12Ste´phane Oudard,12
Nicholas McGranahan,3,13Istvan Csabai,14Martin Gore,4P. Andrew Futreal,15James Larkin,4Andy G. Lynch,5,16
Zoltan Szallasi,17,18Charles Swanton,3,13,19,*Peter J. Campbell,1,20,22,*and the TRACERx Renal Consortium
1Cancer Genome Project, Wellcome Trust Sanger Institute, Hinxton CB10 1SA, UK
2Academic Urology Group, Department of Surgery, Addenbrooke’s Hospitals NHS Foundation Trust, University of Cambridge, Hills Road,
Cambridge CB2 0QQ, UK
3Translational Cancer Therapeutics Laboratory, the Francis Crick Institute, 1 Midland Rd, London NW1 1AT, UK 4Renal and Skin Units, The Royal Marsden National Health Service (NHS) Foundation Trust, London SW3 6JJ, UK 5CRUK Cambridge Institute, University of Cambridge, Robinson Way, Cambridge CB2 0RE, UK
6Guy’s and St Thomas’ National Health Service (NHS) Foundation Trust, Great Maze Pond, London SE1 9RT, UK
7Department of Pathology, Cruces University Hospital, Biocruces Institute, University of the Basque Country (UPV/EHU), Barakaldo, Spain 8Experimental Histopathology Laboratory, The Francis Crick Institute, 1 Midland Road, London NW1 1AT, UK
9Interventional Radiology Department, The Royal Marsden National Health Service (NHS) Foundation Trust, London SW3 6JJ, UK 10Big Data Institute, University of Oxford, Old Road Campus, Oxford OX3 7FZ, UK
11Bioinformatics and Biostatistics STP, Francis Crick Institute, 1 Midland Road, London NW1 1AT, UK 12Hoˆpital Europe´en Georges Pompidou 20, rue Leblanc, 75908 Paris, France
13Cancer Research UK Lung Cancer Centre of Excellence, University College London Cancer Institute, Paul O’Gorman Building,
72 Huntley Street, London WC1E 6BT, UK
14Department of Physics of Complex Systems, Eotvos Lorand University, Budapest, Hungary
15The University of Texas MD Anderson Cancer Center, Department of Genomic Medicine, Houston, TX 77030, USA 16School of Medicine, University of St. Andrews, North Haugh, St. Andrews KY16 9TF, UK
17Centre for Biological Sequence Analysis, Technical University of Denmark, Lyngby, Denmark
18Children’s Hospital Informatics Program at the Harvard-MIT Division of Health Sciences and Technology (CHIP@HST),
Harvard Medical School, Boston, MA, USA
19Department of Medical Oncology, University College London Hospitals, 235 Euston Rd, Fitzrovia, London NW1 2BU, UK 20Department of Haematology, University of Cambridge, Cambridge CB2 2XY, UK
21These authors contributed equally 22Lead Contact
*Correspondence:charles.swanton@crick.ac.uk(C.S.),pc8@sanger.ac.uk(P.J.C.) https://doi.org/10.1016/j.cell.2018.02.020
SUMMARY
Clear cell renal cell carcinoma (ccRCC) is
character-ized by near-universal loss of the short arm of
chro-mosome 3, deleting several tumor suppressor genes.
We analyzed whole genomes from 95 biopsies
across 33 patients with clear cell renal cell
carci-noma. We find hotspots of point mutations in the
5
0UTR of
TERT
, targeting a MYC-MAX-MAD1
repressor associated with telomere lengthening.
The most common structural abnormality generates
simultaneous 3p loss and 5q gain (36% patients),
typically through chromothripsis. This event occurs
in childhood or adolescence, generally as the
initi-ating event that precedes emergence of the tumor’s
most recent common ancestor by years to decades.
Similar genomic changes drive inherited ccRCC.
Modeling differences in age incidence between
in-herited and sporadic cancers suggests that the
num-ber of cells with 3p loss capable of initiating sporadic
tumors is no more than a few hundred. Early
develop-ment of ccRCC follows well-defined evolutionary
tra-jectories, offering opportunity for early intervention.
INTRODUCTION
Cancers of the kidney develop in an estimated 300,000 people worldwide every year, with approximately half dying from the dis-ease (Fitzmaurice et al., 2015). The commonest histological sub-type is clear cell renal cell carcinoma (ccRCC), a tumor believed to arise from the epithelial cells of the proximal convoluted tubule of the nephron (Frew and Moch, 2015).
event, found in >90% patients (Beroukhim et al., 2010; Shen et al., 2011; Cancer Genome Atlas Research Network, 2013; Zbar et al., 1987). The deleted region always encompasses four tumor suppressor genes that are frequent targets for inacti-vating point mutations on the other chromosomal copy:VHL
(point mutations in 60%–70% patients; epigenetic silencing in a further 5%–10%),PBRM1(40%), BAP1 (10%), andSETD2
(10%) (Dalgliesh et al., 2010; Sato et al., 2013; Cancer Genome Atlas Research Network, 2013; Varela et al., 2011). The second most frequent genetic event in clear cell renal cell carcinoma is gain of chromosome 5q, seen in 65%–70% of patients ( Berou-khim et al., 2010; Shen et al., 2011; Cancer Genome Atlas Research Network, 2013), withSQSTM1one of the likely target genes (Li et al., 2013).
Recent exome sequencing studies have highlighted the considerable intra-tumoral heterogeneity of clear cell renal cell
carcinomas (Gerlinger et al., 2012, 2014). In growing to sizes of several centimeters in diameter, these tumors often comprise several geographically localized subclones. Interestingly, chro-mosome 3p loss and, when present,VHLpoint mutations are always on the trunk of the phylogenetic tree, suggesting that they are key early events in cancer development.
Studies of somatic mutations in clear cell renal cell carcinoma to date have primarily focused on protein-coding genes. As a result, the mechanism of chromosome 3p loss has not been well characterized, nor the role of non-coding driver mutations. Here, using a multi-region sampling approach, we report whole genome sequences from 95 clear cell renal cell carcinoma biopsies across 33 patients.
RESULTS
Whole-Genome Sequencing of Clear Cell Renal Cell Carcinomas
TRACERx Renal is a prospective cohort study of patients with RCC, which aims to assess the evolutionary trajectories of clear cell renal cell carcinoma (Turajlic and Swanton, 2017). In partic-ular, multi-region sampling of the primary cancer and any metas-tases is used to generate high-resolution information on the timing of driver mutations, level of intratumoral heterogeneity, and presence of parallel evolution in each patient. To date, 100 patients in TRACERx Renal have been profiled with exome and targeted gene sequencing and these data are presented in the companion papers to this one (Turajlic et al., 2018a, 2018b).
We performed whole genome sequencing to an average 67x depth on 128 kidney biopsies, together with matched germ-line DNA, from 36 patients. The tumor cell fraction was not sufficient in 33 biopsies (including 17 biopsies from normal adjacent kidney) to accurately call somatic aberrations—the dataset analyzed here therefore represents whole genomes of 95 cancer biopsies from 33 patients (Table S1). Clinically, the patients had the typical age range, stage, and size of tumors for sporadic clear cell renal cell carcinoma (Table S2). We used our validated bioinformatics pipelines to identify somatic substitutions, indels, copy number alterations, and structural variants (Campbell et al., 2008; Jones et al., 2016; Raine et al., 2015, 2016).
We identified an average of 7,680 unique somatic substitu-tions and 1,193 indels per patient, but with a 3-fold variation in numbers across patients (Figure 1A;Table S2). The landscape of coding driver mutations and recurrent copy number alter-ations was typical for clear cell renal cell carcinoma (Figure 1B). There was a high level of concordance between driver mutation calls made in whole genome and targeted panel sequencing (STAR Methods).
Non-coding Driver Mutations in the 50UTR ofTERT
Whether there are driver mutations in non-coding regions of the genome has not been extensively explored in clear cell renal cell carcinoma. We assessed these using a model of the background mutation rate across the genome that combines the observed mutation spectrum with genome-wide covariates known to affect mutation rate (Martincorena et al., 2017; Nik-Zainal et al., 2016) (Table S3).
A
[image:3.603.63.299.93.378.2]B
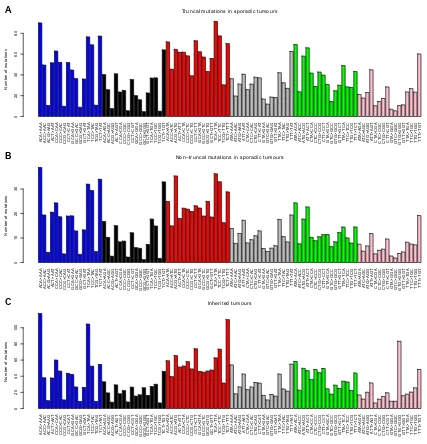
Figure 1. The Clonality of Driver Events and the Relative Timing of 3p Loss in Clear Cell Renal Cell Carcinoma
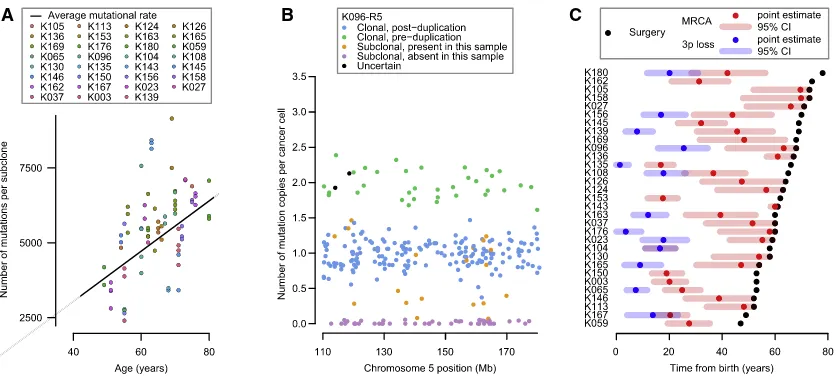
(A) Mutation burden for 34 independent tumors derived from 33 patients. For each tumor, the number of mutations present in the most recent common ancestor and each of the terminal subclones are annotated. The estimated mutational time at which chromosome 3p is lost with 95% CIs has been annotated for those tumors harboring unbalanced translocations with 3p. One patient (K097) developed two independent tumors denoted K097_1 and K097_2.
(B) Presence and clonality of driver mutations and copy number aberrations. Driver mutations include those previously reported and that are present in at least 3 independent tumors from this cohort. For cases where a clonal muta-tion in the WGS data has been detected as subclonal in the more spatially detailed panel data (Turajlic et al., 2018a, 2018b), the mutation has been amended in this figure as subclonal.
Only one non-coding region had a statistically significant excess of mutations: the 50UTR and promoter of the telomerase reverse transcriptase gene, TERT (q = 0.016). This region harbored somatic mutations in 5 patients from our cohort of 33 (15%) (Figure 2A), of which two were subclonal. Interestingly, the mutation sites observed in our clear cell renal cell carcinoma data included three positions in the 50UTR ofTERT, located 15, 24, and 29 base pairs downstream of the transcription start site (Figure 2A). These are different positions from the canonical pro-moter hotspots mutated inTERTacross a wide range of cancers, especially melanomas (Horn et al., 2013; Huang et al., 2013), although we did see mutations at these sites as well (Figure 2A). In chromophobe renal cancer, structural variants activating
TERTare common (Davis et al., 2014), but we detected neither genomic rearrangements nor copy number aberrations near
TERTin this cohort of clear cell renal cell carcinomas.
To assess whether the 50UTR mutations were recurrent, we screened the promoter and 50 UTR of TERT in an additional 377 samples from 94 patients with clear cell renal cell carcinoma by capillary sequencing (Table S4). This identified 13 patients with non-codingTERTmutations (13.5% of the cohort). The mu-tations were present clonally in 10 patients and subclonally in the other 3 and were distributed across the two canonical promoter sites and the three hotspots in the 50UTR identified in the discov-ery screen (Figure 2A). In our combined dataset, we find no as-sociation betweenTERTstatus and tumor grade or metastatic spread (p = 0.6 and p = 0.4, respectively), nor was there an asso-ciation with chromothripsis events.
The three mutated loci in theTERT50UTR fall in or very near to an E-box sequence (CACGTG), a motif known to bind the MYC-MAX-MAD1 family of proteins (Sabo` and Amati, 2014). This specific E-box element was first shown to bind MYC in B lym-phocytes, leading to transcriptional activation (Wu et al., 1999). However, the effects of this element on transcriptional activity are variable across cell types (Kyo et al., 2000), explained in part by competition for the binding site between MYC, which
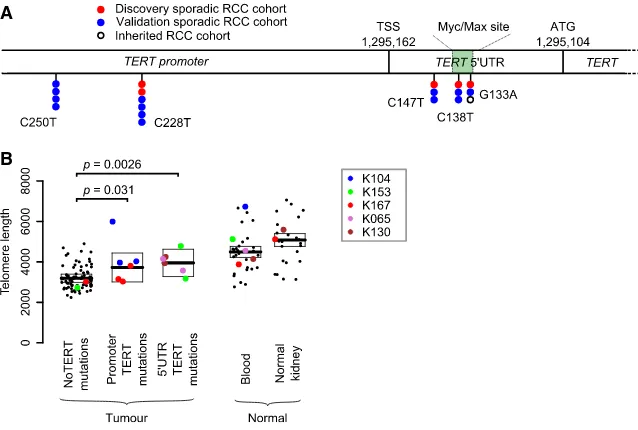
A
[image:4.603.53.372.100.315.2]B
Figure 2. Recurrent Canonical and 50 UTR TERTMutations Increase Telomere Length (A) The genomic location of the canonical pro-moter and 50 UTR mutations in this discovery cohort, a validation cohort (Table S5) and an in-herited clear cell renal cell carcinoma cohort. (B) Estimated telomere lengths for all samples sequenced. The colored points correspond to samples that containedTERTmutations in some or all of the biopsies. The boxes indicate median and interquartile range.
See alsoTables S3andS4.
upregulates expression, and MAD1, which acts as a repressor (Oh et al., 2000). In renal cancer cells, this element acts mainly as a repressor, a function that is abrogated by mutation of the bind-ing site (Horikawa et al., 2002). The impli-cation is that the mutations we observe diminish binding of a repressor, probably MAD1, to the E-box, leading to loss of the usual transcriptional suppression ofTERTin kidney cells.
Unfortunately, we do not have expression data to compare
TERTexpression in samples with and without 50UTR mutations, but we could directly estimate telomere lengths from the genome sequencing data (Farmery et al., 2017) (STAR Methods). If the mutations act to abolish the active repression of TERT
transcription, then samples carrying these mutations should have longer telomeres. We used linear mixed models adjusted for age to determine the difference between groups. As previ-ously reported (Barthel et al., 2017), tumors have shorter telomere lengths than normal tissue (p = 2.231016), presum-ably reflecting the greater replicative drive and consequent telomere attrition in cancer cells. As predicted, samples with the canonicalTERTpromoter mutations and indeed those with 50 UTR mutations did, on average, have longer telomeres than wild-type samples (p = 0.031 and p = 0.0026, respectively) (Figure 2B,Table S5). Thus, 50UTR hotspot mutations presum-ably act through lengthening telomeres to promote replicative immortality.
Simultaneous Chromosome 3p Loss and 5q Gain through Chromothripsis
The most frequent pattern of chromosome 3p loss in the cohort, affecting 13 (43%) of the 30 tumors with known 3p LOH breakpoints, was rearrangement between 3p and 5q. In all but one of these tumors, the overall consequence was to lose one copy of chromosome 3p and gain an extra copy of chro-mosome 5q in the same event. In only two of these patients was the event a straightforward unbalanced translocation. In the remainder, there were groups of 5–30 rearrangements focally clustered on chromosomes 3p and 5q (Figures 3andS1). These had the hallmarks of chromothripsis, a catastrophic mutational process in which one or a few chromosomes suffer multiple breaks simultaneously, with the resulting fragments being joined in random order (Stephens et al., 2011). In particular, the oscil-lating copy number profiles, clustered rearrangements, random orientation of breakpoint ends and phasing of rearrangements to one haplotype (Figure 4A) are all distinguishing genomic fea-tures of chromothripsis (Korbel and Campbell, 2013).
The explanation that best fits the copy number and rearrange-ment data is that chromothripsis results in a single t(3;5) deriva-tive chromosome, alongside one wild-type chromosome 3 and two copies of wild-type chromosome 5 (Figure 4B). In our sam-ples, the t(3;5) derivative chromosome consists of, in order: the intact long arm of 3q; the chromosome 3 centromere; a small portion of 3p from near the centromere; shuffled genomic frag-ments of 3p and 5q arising from chromothripsis; and the telo-meric portion of 5q. Other sequences of events are formally possible, but implausible for several reasons (‘‘Inference of chro-mothripsis’’ in theSTAR Methods).
To assess whether the t(3;5) chromothripsis events were recurrent in other cohorts, we re-examined whole genome sequencing data from the TCGA clear cell renal cell carcinoma study (The Cancer Genome Atlas Research Network, 2013). This revealed a similar overall frequency of events generating simultaneous loss of chromosome 3p and gain of 5q, seen in 11 tumors out of 40 studied (28%) (Figure S2A). In particular, clustered and interlocking rearrangements on chromosomes 3p and 5q confirm that chromothripsis is the predominant mech-anism causing this critical driving event.
Although t(3;5) events were the commonest pattern causing chromosome 3p loss in our cohort (13/30 patients), they were by no means the only mechanism. We observed a range of other, less frequent structural abnormalities driving 3p loss. Two pa-tients had chromothripsis events involving 3p and 6q, which led to losses on both chromosomes (Figure S1), and a further six patients had unbalanced translocations with various chromo-somes other than 5q. Three patients had loss of the whole of chromosome 3 and three had loss of the entire short arm. Only two patients had simple interstitial deletions on chromosome 3p. In one patient, we were unable to map the event causing 3p loss.
Chromothripsis on 3p and 5q Acts through Copy Number Change
We were surprised that a complex event such as chromothripsis was the major process causing the copy number changes on chromosomes 3p and 5q, rather than say simple unbalanced
64 66 68 70 72 74
Chromosome 3 position (Mb)
100 105 110
0 1 2 3 4
Chromosome 5 position (Mb)
Total copy number
K096-R5
A
B
50 60 70 80 90 100
Chromosome 3 position (Mb) CACNA2D3 FHIT FOXP1 ROBO2
ROBO1 PBRM1
CACNA1DDNAH12 FLNB
MITF EPHA3 EPHA6
BAP1
POU1F1
60 80 100 120 140 160 180
Chromosome 5 position (Mb) ARHGAP26
MEF2C EBF1
BHMT2 MSH3 RASGRF2
RASA1 APC ACSL6 AFF4 CTNNA1DIAPH1 ITK
RANBP17 NSD1 MAPK9 IL6ST
MAP3K1 TRIM23
PIK3R1 CHD1
IL3IRF1
RAD50 PDGFRB
CSF1R CD74
TLX3 NPM1
FGFR4
Location of breakpoints Loss of heterogeneity Chromosomal gain K176
K023 K156 K180 K165 K163 K065 K113 K167 K139 K108 K104 K096
[image:5.603.93.517.107.349.2]SQSTM1
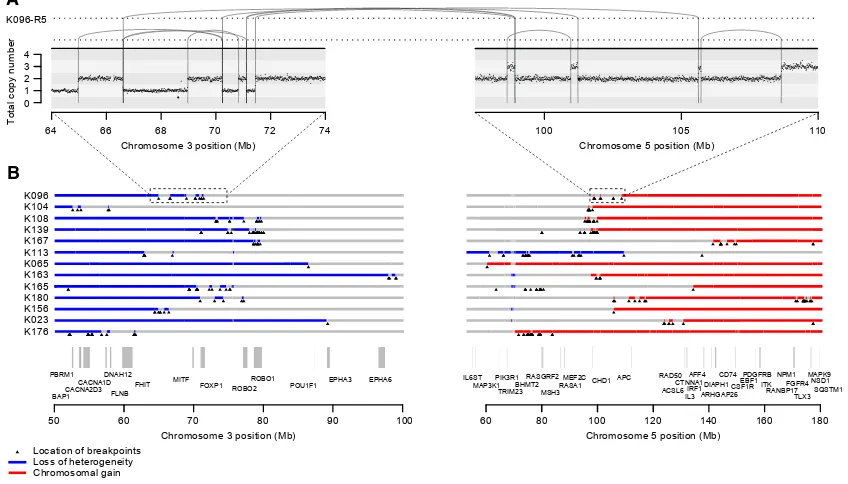
Figure 3. Recurrent Complex Unbalanced Translocations between Chromosomes 3 and 5
(A) Intra and inter-chromosomal re-arrangements and their effect on the copy number profile from an indicative tumor sample. All tumor samples containing these events are shown inFigure S1.
(B) The genomic location of all breakpoints from all tumors that harbored translocations between chromosomes 3 and 5. Regions that had undergone loss of heterozygosity are shown in blue; those that have undergone gains are shown in red.
translocation. We examined the location of breakpoints to ascer-tain whether the clusters of rearrangements had generated a particular genomic configuration that might be recurrent across patients (Figures 3B andS2A). In fact, across patients, there was no obvious common region of chromothripsis on either 3p or 5q beyond the requirement to lose all four tumor suppressor genes on 3p and duplicate the terminal portion of 5q.
This suggests that the reason chromothripsis is so frequent is mechanistic. Our hypothesis is that any event that gains a chro-mosome arm must occur after S-phase and the most efficient way to couple this with simultaneous loss of another chromo-some arm is through mitotic catastrophe. Indeed,in vitrostudies show that mitotic errors induced by either microtubule dysfunc-tion, causing lagging chromosomes (Zhang et al., 2015), or telo-mere crisis, causing anaphase bridges (Maciejowski et al., 2015), can result in similar copy number alterations and clusters of re-arrangements between two chromosomes.
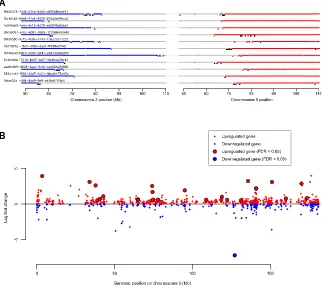
The key genes for the copy number gain on chromosome 5q remain mysterious, with several, includingSQSTM1, proposed as targets (Li et al., 2013; Cancer Genome Atlas Research Network, 2013). From the TCGA cohort, we identified genes with differential expression in patients with 5q gains versus those with baseline copy number (Figure S2B;Data S1). Many genes in the duplicated regions of 5q are indeed upregulated (Table S6), consistent with the proposal that large-scale aneuploidy acts through a net tilt in the balance between dosage of growth-pro-moting and growth-suppressing genes (Davoli et al., 2013).
Burden of Somatic Substitutions Correlates Linearly with Age
To assess whether point mutations in clear cell renal cell carci-noma occur at constant rate, we correlated the age of diagnosis with the burden of base substitutions in each subclone across the cohort using mixed effects models (Figure 5A; Data S1;
STAR Methods). Three key observations emerge. First, there is a statistically significant and linear correlation of mutation burden with age in this cohort, estimated at 87 mutations/year (95% confidence interval [CI]: 80–94; p < 0.001). Second, there is variation among patients in the rate at which mutations accu-mulate, with the between-patient standard deviation in mutation rate estimated at 17 mutations/year. Third, within a given pa-tient’s tumor, different subclones have broadly similar mutation burdens (Figure 5A), suggesting that each subclone has been accumulating mutations at the same steady rate since clonal divergence.
Taken together, these data suggest that somatic mutations in kidney cells accumulate at a constant rate throughout life. Further evidence for this comes from the mutational spectrum observed in clear cell kidney cancers both in this cohort ( Fig-ure S3) and in others (Alexandrov et al., 2013). The vast majority of mutations appear to arise from two mutational processes (so-called signatures 1 and 5) that are universal across cancer types and show linear correlation with age in both cancer (Alexandrov et al., 2015) and normal tissue (Blokzijl et al., 2016).
Timing the Landmark Events of Clear Cell Renal Cell Carcinoma Development
We can estimate when large duplications occurred from the pro-portion of point mutations in that region that were duplicated. Essentially, any mutation that was on 5q before the t(3;5) event occurred will be duplicated along with the whole chromosome arm (and hence present on two of the three copies of 5q); any mutation that occurs subsequently will be present on only one of the three copies of 5q. From the fraction of mutations present on two versus one copy of 5q, and measures of the mu-tation rate, we can estimate the chronological age at which the duplication occurred. This approach has been used in several previous studies (Durinck et al., 2011; Nik-Zainal et al., 2012),
A K104
CN 1 2
CN 2 3
A3 B3
C5 D5 E5 F5
1 2
3 4 5
3q 3pcentromere
5qtelomere
Chromothripsis fragments
A3
B3 D5 C5 E5 F5
4 1 2 3 5
B Metaphase
Chromosomes aligned at the equatorial plane
Anaphase
Daughter chromosomes move towards poles, except for one chromosome 3 and one chromosome 5
Cytokinesis
One daughter cell formed with a micronucleus containing one copy of chromosome 3 and 5. This undergoes chromothripsis prior to reintegration into nucleus
Nucleus
Micronucleus Chromosome 3
Chromosome 5
F
F55
E E
E555
A A
A33
B
B33 DDD555 CCC55
A
A
A
A33 BB33
F F55 E
E
E
E
E
E555 D D
D
D555
C C
[image:6.603.95.506.98.297.2]C55
Figure 4. Schematic Illustrating How Chromothripsis Generates a Derivative t(3;5) Chromosome
(A) In one of the simpler clusters of rearrangements observed, breakpoints, and copy number (CN) aberrations on chromosomes 3 and 5 allow unequivocal reconstruction of the orientation and localization of regions retained after chromothripsis. The derivative chromosome contains chromosome 3q, a centromeric region of 3p, the chromothripsis fragments, and the telomeric portion of chromosome 5q.
and the methodology has been formally developed (Greenman et al., 2012).
We estimated the age at which the t(3;5) translocation events occurred from mutations on the duplicated region of chromo-some 5q (Figures 5B andS4;Data S1). Mutations can be divided into four categories: those present on two copies of 5q (green points,Figure 5B), clonal mutations present on one copy of 5q (blue points), mutations that are subclonal in the cancer as a whole and are found in the given sample (orange points), and subclonal mutations absent from the given sample (purple points). To estimate the ages of patients when t(3;5) events occurred, we used the patient-specific estimates of mutation rate generated by the linear mixed effects models (Figure 5A), with correction for the clonal structure and type of copy number gain (Greenman et al., 2012; Nik-Zainal et al., 2012) (STAR Methods). We used bootstrapping to generate 95% CIs for this estimate, incorporating the uncertainty in both the numbers of pre-duplication mutations and estimates of the patient-specific mutation rate.
In most patients, only a small fraction of mutations on the duplicated region of 5q were present on two chromosomal copies (Figures 5B andS4). This implies that the 5q duplication occurs surprisingly early in life. Formal statistical analysis esti-mated that t(3;5) events occurred during childhood or adoles-cence for the majority of patients in our cohort, 30–50 years before the kidney cancer was diagnosed (Figure 5C).
One patient (K135) had a t(3;9) unbalanced translocation with loss of 3p and gain of 9q, which we also estimated to have occurred early in childhood (Figure 5C). In contrast, several pa-tients had gains of 5q that were not linked with 3p and these ap-peared to have occurred at a much wider range of ages than the t(3;5) events (Figure S5). These data suggest that the key driver for the early timing of t(3;5) events is chromosome 3p loss.
These estimates depend on the assumption of a constant mu-tation rate throughout life. We explored other relationships be-tween mutational burden and age, such as including a quadratic term for age, effectively allowing for the mutation rate to increase with age. Not only did this model fail to significantly improve the correlation between age and mutational burden, the estimated age of 3p loss increased by less than a year. Similarly, if we allowed for different periods of time for the clonal expansion be-tween the occurrence of the last detectable mutation and tumor diagnosis, the estimated age of t(3;5) events did not increase.
In addition to timing the t(3;5) events, we can also estimate the age at which the most recent common ancestor of the tumor emerged. This cell is defined as the ancestral cell from which all current tumor cells derived, and its arrival demarcates the clonal mutations, found in all tumor cells, from the subclonal mu-tations, found in a fraction of tumor cells. In this cohort, we esti-mate a wide range of ages at which the most recent common ancestor emerged, from early adulthood through to late middle age (Figure 5C). This is reminiscent of previous exome data in which the relative length of the trunk of the phylogenetic tree across kidney cancer patients was strikingly variable (Gerlinger et al., 2014).
In one patient (K104), the estimated age of the t(3;5) chromo-thripsis was virtually the same as the estimated age at which the most recent common ancestor emerged (Figure 5C). This sug-gests that in this patient, the t(3;5) event was what triggered the last complete selective sweep in the tumor—the most recent common ancestor was likely the cell that underwent the chromo-thripsis catastrophe. If so, the clonal VHL and TERT driver mutations also seen in this tumor must have preceded the chro-mothripsis. For all the other patients in whom we could time the 3p loss and 5q gain, however, there was a delay of years to de-cades between the 3p loss and the emergence of the most
[image:7.603.97.515.99.293.2]A B C
Figure 5. Mutational Burden and the Chronological Loss of Chromosome 3p
(A) Mutational burden of subclones compared to age at surgery (points), annotated with the patient-specific and cohort average mutational rate (black line). (B) The estimated number of copies per cancer cell of each mutation in the duplicated region of 5q for an indicative sample. Mutations may be assigned as clonal and pre-duplication (green) or post-duplication (blue), subclonal and present (orange) or absent (purple) in this sample, or uncertain (black).
recent common ancestor. This implies that the typical sequence of events is for 3p loss to be the initiating driver event, often occurring through t(3;5) chromothripsis. This is followed by one or more other driver mutations—these trigger the clonal expan-sion of the most recent common ancestor.
Similar Landscape of Clear Cell Renal Cell Carcinoma in von Hippel-Lindau Disease
Germline mutations inVHLresult in a syndrome known as von Hippel-Lindau disease, characterized by a high penetrance of clear cell renal cell carcinomas, together with hemangioblasto-mas of the retina, brain, and spine, and a handful of other tumor types (Nielsen et al., 2016). Renal cancers in von Hippel-Lindau disease begin to emerge in young adulthood, with a cumulative incidence of 70%–80% by the age of 60 years (Ong et al., 2007). It is known that the wild-type allele ofVHLis universally deleted in these cancers, as expected for a classic two-hit tumor suppres-sor gene (Maher et al., 1990).
Recently, whole genomes have been sequenced for 40 clear cell renal cell carcinomas from 6 patients with von Hippel-Lindau disease (Fei et al., 2016). To compare inherited with sporadic cases, we reanalyzed these data using our pipelines to establish how the wild-typeVHLallele was lost in these cancers. As seen in the sporadic cases, we find clustered rearrangements be-tween chromosomes 3p and 5q, reminiscent of chromothripsis and causing 3p loss and 5q gain (Figures 6A and S6). Such events were seen in 15 of 38 (39%) samples, a very similar rate to the 43% we observed in the sporadic cases.
Furthermore, the landscape of copy number aberrations ( Fig-ure S7), the trinucleotide context of base-pair substitutions ( Fig-ure S3) and distribution of somatic driver mutations in the inherited clear cell renal cell carcinomas was very similar to that seen in sporadic cases. Inactivating mutations were seen in the other key tumor suppressor genes on chromosome 3p,
PBRM1, BAP1, andSETD2 (Figure 6B). We identified one of
the hotspot 50UTR mutations inTERTin a VHL patient’s tumor (Figure 2A). Furthermore, as reported in the original paper (Fei et al., 2016), the overall burden of mutations increased linearly with age at a similar rate to our estimate in sporadic renal can-cers, with similar inter-individual variation (Figure 6C).
We used the same approach described above to estimate the age of chromosome 3p loss in inherited clear cell renal cell car-cinomas where the 3p loss was acquired in the same event as a copy number gain (typically 5q) (Figure 6D). As for the sporadic cases, we estimate that the majority of these complex chromo-somal rearrangements occur during childhood and adoles-cence, years to decades before disease diagnosis, with a couple of cases occurring during early adulthood.
Overall, sporadic clear cell renal cell carcinomas and those arising in the context of von Hippel-Lindau disease have remark-ably similar evolutionary trajectories and patterns of somatic driver mutations. The major difference is the need to acquire a second somaticVHLinactivation event in the sporadic setting.
Modeling the Early Clonal Dynamics of Sporadic Kidney Cancer
If the major genomic difference between inherited and sporadic clear cell renal cell carcinoma is whether theVHLinactivation is
germline or somatic, then the difference in age-incidence curves between the two scenarios derives from the time taken to ac-quire the secondVHLmutation in the sporadic case. Knowing which mutations inVHLare driver mutations and the average rate of these mutations per cell per year, we can estimate how many cells with 3p loss must be present to generate the observed difference in age-incidence curves.
This is a twist on Knudson’s pioneering work leading to the two-hit hypothesis for the then-unknown tumor suppressor gene in retinoblastoma (Knudson, 1971). In his original paper,
Knudson (1971) used the known number of retinal ganglion cells to estimate the driver mutation rate in the then-unknown gene from the age-incidence curve of inherited retinoblastoma. He then showed that the age-incidence curve for sporadic retino-blastoma can be reproduced assuming two such mutations are needed at the estimated mutation rate. In our case, we know the target gene,VHL, and can directly estimate its rate of driver mutations: what we would like to know is the number of cells at risk after loss of chromosome 3p, namely the size of that initial clonal expansion after deletion of one copy ofVHL,
PBRM1,SETD2, andBAP1.
We used a Bayesian framework to model the published age-incidence curves for inherited (Ong et al., 2007) and sporadic (Cancer Research UK, 2017) clear cell renal cell carcinoma. Briefly, the incidence of inherited clear cell renal cell carcinoma is modeled as the sum of two waiting times: time to 3p loss, esti-mated from the ages of t(3;5) translocations, plus time from 3p loss to tumor diagnosis (Figure 7A;Data S1;STAR Methods). The incidence of sporadic clear cell renal cell carcinoma is treated as the sum of the same two waiting times plus an addi-tional waiting time for acquisition of a somaticVHLdriver muta-tion. This latter waiting time is dependent on the number of susceptible cells, the variable of interest here, and the rate of acquisition ofVHLdriver mutations per year per cell. We directly estimate this from the catalog of mutations in the COSMIC data-base (Forbes et al., 2015), where we have a reasonably com-plete description of which point mutations inVHLcan be drivers of clear cell renal cell carcinoma. These include nonsense, frameshift, splice site and hotspot missense mutations. Given this set of potential drivers, the sequence composition of the gene and the overall mutation rates and signatures observed in our study, we can calculate the rate at which VHL driver mutations occur per cell (STAR Methods). This generates an es-timate of 2.13106driver mutations in
VHLper year per sus-ceptible cell.
The model generates stable estimates of the key variables (Figures 7B–7D). As intended, the posterior distribution for the waiting time to chromosome 3p loss matches the estimates from the t(3;5) timings (Figure 7B). The waiting time from biallelic
VHLinactivation to cancer diagnosis ranged from 15 to 30 years (Figure 7D), the wide range presumably reflecting differences in rate of tumor growth, acquisition of subclonal drivers, screening practices, and development of symptoms.
We predict that after chromosome 3p loss in non-carriers, there would only be a few hundred cells with the potential to initiate a future clear cell renal cell carcinoma if a somaticVHL
and age of incidence between somatic and inherited cancers, given a VHL driver mutation rate of 2 per million cells per year. This rather modest initial clonal expansion after the first driver event is reminiscent of the limited clonal expansions seen with driver mutations in, for example, normal skin tissue (Martincorena et al., 2015).
Opportunities for Prevention of Sporadic Clear Cell Renal Cell Carcinoma
The relatively small numbers of cells with chromosome 3p loss that have the future potential to initiate a clear cell renal cell car-cinoma, together with the long latency between 3p loss and further progression, suggest a useful therapeutic window in
A
B C
[image:9.603.95.514.89.585.2]D
Figure 6. Similar Genomic Landscape of Inherited Clear Cell Renal Cell Carcinoma
(A) Breakpoints and copy number aberrations for samples with von Hippel-Lindau disease that had translocations between 3p and 5q. (B) Driver events and molecular timing of 3p loss with 95% CIs.
(C) Mutational burden versus age.
which early intervention could prevent renal cell carcinomas. We used our Bayesian model to simulate the age-incidence curves of sporadic clear cell renal cell carcinoma if the number of cells carrying 3p loss were reduced (Figures 7E–7G). This suggests that we could halve the incidence of sporadic clear cell renal cell carcinoma within the normal human lifespan by reducing
the 3p-LOH clone size by 50% (Figure 7F) and have even more profound benefits with more cell kill (Figure 7G).
One of the reasons that this could be such an interesting pre-ventative opportunity is that the region of 3p loss invariably en-compasses all four tumor suppressor genes of VHL,PBRM1,
BAP1, andSETD2, and hence spans at least 40 Mb. There are
A
B
E
H
F
C D
[image:10.603.87.507.96.567.2]G
Figure 7. Mathematical Modeling of Clear Cell Renal Cell Carcinoma Evolution
(A) Schematic depicting how the age of incidence of renal cell carcinoma may be modeled as the sum of waiting times;Z1representing the time to 3p loss,Z2 representing the time toVHLinactivation, andZ3representing the time from bi-allelic loss ofVHLto clinically detected tumor.Z1andZ3are modeled by gamma distributions andZ2by an exponential distribution of the product ofn, the number of cells with 3p loss andm, the calculatedVHLmutational rate.
a large number of genes within this region that have been iden-tified as ‘‘essential’’ to cellular survival inin vitrostudies (Blomen et al., 2015; Wang et al., 2015) or intolerant of protein-truncating germline mutationsin vivo(Lek et al., 2016) (Figure 7H). Many of these genes could represent viable therapeutic targets.
DISCUSSION
Our data reveal that the early development of clear cell renal cell carcinoma follows strongly preferred evolutionary trajectories. Chromosome 3p loss is often the initiating driver, seemingly arising in childhood or adolescence, even though the cancer may not be diagnosed for another 30–50 years. The clonal expansion after 3p loss may not be that large—no more than a few hundred cells with the eventual capability of initiating an invasive cancer. Indeed, these few hundred cells may be distrib-uted across several independent clones and probably exist in all adults—in von Hippel-Lindau disease, where the other VHL
allele carries a germline mutation, clear cell renal cell carcinoma is nearly completely penetrant and multiple cancers can develop simultaneously (Nielsen et al., 2016). These are clonally unrelated (Fei et al., 2016) and have independent t(3;5) chromo-thripsis events (Figures 6A andS6). That the first somatic driver mutation would trigger only small clonal expansions has also been suggested by immunohistochemical studies in normal kidney tubules from von Hippel-Lindau disease (Mandriota et al., 2002).
The other critical event, always on the trunk of the phyloge-netic tree, is inactivation of the second allele ofVHL. In all but one patient with informative data here, there was a time lag be-tween the t(3;5) event and the emergence of the most recent common ancestor of the tumor. This suggests that point muta-tion ofVHLtypically occurs after 3p loss. Sometimes, there is another driver mutation on the trunk of the phylogenetic tree (Gerlinger et al., 2012, 2014), drawn from a range of cancer genes, including PBRM1, SETD2, BAP1, TERT, the PI3K signaling pathway and other cytogenetic abnormalities. With a wider repertoire of co-operating genes available, this other trun-cal driver mutation is considerably less rate-limiting than 3p loss andVHLinactivation. Once acquired, these truncal driver muta-tions trigger a substantial clonal expansion—at this stage, the nascent tumor has a sufficient population size that mutation rate is no longer rate-limiting, which may explain why parallel evolution is so frequently observed in the later stages of renal cancer development (Gerlinger et al., 2012, 2014). Nonetheless, we find there can be a delay of many decades between the emer-gence of the most recent common ancestor and tumor diag-nosis, so although the clonal expansion is substantial, it is not rapid.
There are four key factors recommending 3p loss as a thera-peutic target in clear cell renal cell carcinoma: (1) 3p loss is virtu-ally universal in clear cell renal cell carcinoma and is typicvirtu-ally the initiating event; (2) the region lost is always large (>40 Mb), because it has to encompass all ofVHL,PBRM1,SETD2, and
BAP1; (3) our data suggest a latency of many decades between 3p deletion and cancer emergence, offering a long therapeutic window in which to deploy an effective therapy; and (4) clonal expansion after 3p loss is not large, and moderate cell kill at
this stage would have clinically meaningful impact on cancer incidence.
What could constitute a therapy aimed at 3p loss? Such an agent would not necessarily need to target the four tumor suppressor genes on 3p, nor any of the genes on 5q that are often concurrently gained. Rather, we believe that it is the co-deleted, bystander genes on 3p that might confer the greatest therapeutic vulnerability. Any of the essential genes in Figure 7H might be sufficiently sensitive to gene dosage that a therapeutic agent could have disproportionate effects on cells with 3p deletion. In support of this, several studies published recently have shown that bystander genes can be relevant therapeutic targets in cancers with deletions of specific tumor suppressor genes (Dey et al., 2017; Kryukov et al., 2016; Nijhawan et al., 2012). Such an agent would poten-tially have efficacy in patients with established clear cell renal cell carcinoma and could have interesting early intervention ap-plications in inherited vHL disease. We provide a thought experiment showing the impact a therapy targeting cells with 3p loss agent could theoretically have as a prevention therapy. At best, though, with a lifetime risk of clear cell renal cell carci-noma of 1%–2% in the sporadic setting, the number-needed-to-treat to prevent one clear cell renal cell carcinoma would be 50–100.
By the time we enter adulthood, all of us will already carry a few hundred seeds with the potential to beget future lethal clear cell renal cell carcinomas. For those of us who have inherited a faulty
VHL allele, the eventual germination of one or more of these seeds is virtually inevitable within the human lifespan. For the unlucky among the rest of us, that second hit inVHLwill occur sufficiently quickly that a cancer will develop in middle age or beyond. With an aging and fattening population, the unlucky will nearly double in numbers in 20 years’ time (Smittenaar et al., 2016)—unless, that is, we can harness the long latency, the pre-determined early evolutionary trajectory and the small number of seeds to develop new preventative strategies for renal cancer.
STAR+METHODS
Detailed methods are provided in the online version of this paper and include the following:
d KEY RESOURCES TABLE
d CONTACT FOR REAGENT AND RESOURCE SHARING d EXPERIMENTAL MODEL AND SUBJECT DETAILS
d METHOD DETAILS
B DNA sequencing and alignment
B Variant detection
B Variant validation
B Capillary sequencing validation of TERT mutations
B Inference of chromothripsis
B Assumption of constant mutation rate
d QUANTIFICATION AND STATISTICAL ANALYSIS
B Non-coding driver analysis
B Telomere length estimation
B Clustering of mutations
B Estimation of mutation rate per year and ages at which landmark events occur
B Rate of VHL driver mutations
B Models of age-incidence curves for sporadic & in-herited ccRCC
d DATA AND SOFTWARE AVAILABILITY
SUPPLEMENTAL INFORMATION
Supplemental Information includes seven figures, six tables, and one data file and can be found with this article online athttps://doi.org/10.1016/j.cell.2018. 02.020.
CONSORTIA
The members of the TRACERx Renal consortium are Tim O’Brien, David Nicol, Ben Challacombe, Archana Fernando, Steve Hazell, Ashish Chandra, James Larkin, Martin Gore, Lisa Pickering, Sarah Rudman, Simon Chowdhury, Karen Harrison-Phipps, Mary Varia, Catherine Horsfield, Alexander Polson, Gordon Stamp, Marie O’Donnell, William Drake, Peter Hill, David Hrouda, Eric Mayer, Jonathon Olsburgh, Gordon Kooiman, Kevin O’Connor, Grant Stewart, Michael Aithcison, Maxine Tran, Nicos Fotiadis, Hema Verma, and Jose I. Lopez.Acknowledgments
ACKNOWLEDGMENTS
We thank Eleanor Carlyle, Aida Murra, Justine Korteweg, Kim Edmonds, Karla Lingard, Karen O’Meara, Helen Breeze, Lesley Cooper, Linda Shephard, Shar-anpreet Lall, Sarah Sarker, and Leonora Conneely for study support. We thank members of the HeritX organization for discussions on prevention of inherited cancers. We thank the patients and their families. The work presented in this manuscript was funded by EU FP7 (project PREDICT ID number 259303) and the Wellcome Trust and Cancer Research UK. S.T. is funded by Cancer Research UK (C50947/A18176). S.T., J.L., and M.G. receive funding from the National Institute for Health Research (NIHR) Biomedical Research Centre at the Royal Marsden Hospital and Institute of Cancer Research (A109). J.H.R.F. and A.G.L. were supported by the University of Cambridge, Cancer Research UK (C14303/A17197), and Hutchison Whampoa. K.L. is sup-ported by a UK Medical Research Council Skills Development Fellowship Award. C.S. is funded by Cancer Research UK (TRACERx), the Rosetrees Trust, NovoNordisk Foundation (16584), EU FP7 (projects PREDICT and RESPONSIFY, ID number 259303), the Prostate Cancer Foundation, the Breast Cancer Research Foundation, the European Research Council (THESEUS), and National Institute for Health Research University College Lon-don Hospitals Biomedical Research Centre. P.J.C. has a Wellcome Trust Senior Clinical Research Fellowship (WT088340MA).
AUTHOR CONTRIBUTIONS
Conceptualization, S.T., C.S., P.J.C., T.J.M., and L.R.Y.; Methodology, P.J.C. and T.M.; Software, P.J.C., T.J.M., N.A., I.M., J.H.R.F., D.C.W., and A.G.L.; Formal Analysis, T.J.M., P.J.C., N.A., J.H.R.F., I.M., P.T., A.P.B., K.R., J.T., and F.M.; Investigation and Validation, T.J.M., P.J.C., P.T., A.R., S.T., and J.I.L.; Data Curation, T.J.M., P.J.C., N.A., A.P.B., K.R., J.T., S. Horswell, H.X., K.L., A. Stewart, and I.C.; Writing—Original Draft, P.J.C. and T.J.M.; Writing—Review and Editing, P.J.C., T.J.M., S.T., C.S., N.M.G., and K.L.; Visu-alization, T.J.M., P.J.C., and N.A.; Resources and Investigation, D.N., T.O.B., B.C., A.F., S.C., S.R., J. Lynch, S. Hozell, A.C., N.F., L.P., M.S., A. Soultati, A.G.L., L.S., G.S., M.G., G.D.S., P.J.C., A.P.B., K.R., J.T., R.E., S.O., P.A.F., L.A., T.C., and L.R.Y.; Supervision, S.T., C.S., and J.I.L.—through TRACERx Renal Study oversight; Project Administration, S.T., C.S., J. Larkin, and Z.S.; Funding Acquisition, Z.S., C.S., J. Larkin, and S.T.
DECLARATION OF INTERESTS
C.S. is a founder of Achilles Therapeutics.
Received: July 30, 2017 Revised: November 10, 2017 Accepted: February 7, 2018 Published: April 12, 2018
REFERENCES
Alexandrov, L.B., Nik-Zainal, S., Wedge, D.C., Aparicio, S.A., Behjati, S., Bian-kin, A.V., Bignell, G.R., Bolli, N., Borg, A., Børresen-Dale, A.L., et al.; Australian Pancreatic Cancer Genome Initiative; ICGC Breast Cancer Consortium; ICGC MMML-Seq Consortium; ICGC PedBrain (2013). Signatures of mutational pro-cesses in human cancer. Nature500, 415–421.
Alexandrov, L.B., Jones, P.H., Wedge, D.C., Sale, J.E., Campbell, P.J., Nik-Zainal, S., and Stratton, M.R. (2015). Clock-like mutational processes in hu-man somatic cells. Nat. Genet.47, 1402–1407.
Ali, H., Daser, A., Dear, P., Wood, H., Rabbitts, P., and Rabbitts, T. (2013). Nonreciprocal chromosomal translocations in renal cancer involve multiple DSBs and NHEJ associated with breakpoint inversion but not necessarily with transcription. Genes Chromosomes Cancer52, 402–409.
Barthel, F.P., Wei, W., Tang, M., Martinez-Ledesma, E., Hu, X., Amin, S.B., Ak-demir, K.C., Seth, S., Song, X., Wang, Q., et al. (2017). Systematic analysis of telomere length and somatic alterations in 31 cancer types. Nat. Genet.49, 349–357.
Beroukhim, R., Mermel, C.H., Porter, D., Wei, G., Raychaudhuri, S., Donovan, J., Barretina, J., Boehm, J.S., Dobson, J., Urashima, M., et al. (2010). The land-scape of somatic copy-number alteration across human cancers. Nature463, 899–905.
Blokzijl, F., de Ligt, J., Jager, M., Sasselli, V., Roerink, S., Sasaki, N., Huch, M., Boymans, S., Kuijk, E., Prins, P., et al. (2016). Tissue-specific mutation accu-mulation in human adult stem cells during life. Nature538, 260–264.
Blomen, V.A., Ma´jek, P., Jae, L.T., Bigenzahn, J.W., Nieuwenhuis, J., Staring, J., Sacco, R., van Diemen, F.R., Olk, N., Stukalov, A., et al. (2015). Gene essen-tiality and synthetic lethality in haploid human cells. Science350, 1092–1096.
Bolli, N., Avet-Loiseau, H., Wedge, D.C., Van Loo, P., Alexandrov, L.B., Martin-corena, I., Dawson, K.J., Iorio, F., Nik-Zainal, S., Bignell, G.R., et al. (2014). Heterogeneity of genomic evolution and mutational profiles in multiple myeloma. Nat. Commun.5, 2997.
Campbell, P.J., Stephens, P.J., Pleasance, E.D., O’Meara, S., Li, H., Santarius, T., Stebbings, L.A., Leroy, C., Edkins, S., Hardy, C., et al. (2008). Identification of somatically acquired rearrangements in cancer using genome-wide massively parallel paired-end sequencing. Nat. Genet.40, 722–729.
Cancer Genome Atlas Research Network (2013). Comprehensive molecular characterization of clear cell renal cell carcinoma. Nature499, 43–49.
Cancer Research UK (2017). Kidney cancer incidence statistics.http://www. cancerresearchuk.org/health-Professional/cancer-Statistics/statistics-by-Cancer-Type/kidney-Cancer/incidence.
Dalgliesh, G.L., Furge, K., Greenman, C., Chen, L., Bignell, G., Butler, A., Davies, H., Edkins, S., Hardy, C., Latimer, C., et al. (2010). Systematic sequencing of renal carcinoma reveals inactivation of histone modifying genes. Nature463, 360–363.
Davis, C.F., Ricketts, C.J., Wang, M., Yang, L., Cherniack, A.D., Shen, H., Buhay, C., Kang, H., Kim, S.C., Fahey, C.C., et al.; The Cancer Genome Atlas Research Network (2014). The somatic genomic landscape of chromophobe renal cell carcinoma. Cancer Cell26, 319–330.
Davoli, T., Xu, A.W., Mengwasser, K.E., Sack, L.M., Yoon, J.C., Park, P.J., and Elledge, S.J. (2013). Cumulative haploinsufficiency and triplosensitivity drive aneuploidy patterns and shape the cancer genome. Cell155, 948–962.
de Bruin, E.C., McGranahan, N., Mitter, R., Salm, M., Wedge, D.C., Yates, L., Jamal-Hanjani, M., Shafi, S., Murugaesu, N., Rowan, A.J., et al. (2014). Spatial and temporal diversity in genomic instability processes defines lung cancer evolution. Science346, 251–256.
Durinck, S., Ho, C., Wang, N.J., Liao, W., Jakkula, L.R., Collisson, E.A., Pons, J., Chan, S.-W., Lam, E.T., Chu, C., et al. (2011). Temporal dissection of tumorigenesis in primary cancers. Cancer Discov.1, 137–143.
Farmery, H.J.R., Smith, M.L., and Lynch, A.G. (2017). Telomerecat: a ploidy-agnostic method for estimating telomere length from whole genome sequencing data. bioRXiv.https://doi.org/10.1101/139972.
Fei, S.S., Mitchell, A.D., Heskett, M.B., Vocke, C.D., Ricketts, C.J., Peto, M., Wang, N.J., So¨nmez, K., Linehan, W.M., and Spellman, P.T. (2016). Patient-specific factors influence somatic variation patterns in von Hippel-Lindau dis-ease renal tumours. Nat. Commun.7, 11588.
Fitzmaurice, C., Dicker, D., Pain, A., Hamavid, H., Moradi-Lakeh, M., MacIntyre, M.F., Allen, C., Hansen, G., Woodbrook, R., Wolfe, C., et al.; Global Burden of Disease Cancer Collaboration (2015). The Global Burden of Cancer 2013. JAMA Oncol.1, 505–527.
Forbes, S.A., Beare, D., Gunasekaran, P., Leung, K., Bindal, N., Boutselakis, H., Ding, M., Bamford, S., Cole, C., Ward, S., et al. (2015). COSMIC: exploring the world’s knowledge of somatic mutations in human cancer. Nucleic Acids Res.43, D805–D811.
Frew, I.J., and Moch, H. (2015). A clearer view of the molecular complexity of clear cell renal cell carcinoma. Annu. Rev. Pathol.10, 263–289.
Gerlinger, M., Rowan, A.J., Horswell, S., Math, M., Larkin, J., Endesfelder, D., Gronroos, E., Martinez, P., Matthews, N., Stewart, A., et al. (2012). Intratumor heterogeneity and branched evolution revealed by multiregion sequencing. N. Engl. J. Med.366, 883–892.
Gerlinger, M., Horswell, S., Larkin, J., Rowan, A.J., Salm, M.P., Varela, I., Fisher, R., McGranahan, N., Matthews, N., Santos, C.R., et al. (2014). Genomic architecture and evolution of clear cell renal cell carcinomas defined by multi-region sequencing. Nat. Genet.46, 225–233.
Greenman, C.D., Pleasance, E.D., Newman, S., Yang, F., Fu, B., Nik-Zainal, S., Jones, D., Lau, K.W., Carter, N., Edwards, P.A., et al. (2012). Estimation of re-arrangement phylogeny for cancer genomes. Genome Res.22, 346–361.
Horikawa, I., Cable, P.L., Mazur, S.J., Appella, E., Afshari, C.A., and Barrett, J.C. (2002). Downstream E-box-mediated regulation of the human telomerase reverse transcriptase (hTERT) gene transcription: evidence for an endogenous mechanism of transcriptional repression. Mol. Biol. Cell13, 2585–2597.
Horn, S., Figl, A., Rachakonda, P.S., Fischer, C., Sucker, A., Gast, A., Kadel, S., Moll, I., Nagore, E., Hemminki, K., et al. (2013). TERT promoter mutations in familial and sporadic melanoma. Science339, 959–961.
Huang, F.W., Hodis, E., Xu, M.J., Kryukov, G.V., Chin, L., and Garraway, L.A. (2013). Highly recurrent TERT promoter mutations in human melanoma. Sci-ence339, 957–959.
Jones, D., Raine, K.M., Davies, H., Tarpey, P.S., Butler, A.P., Teague, J.W., Nik-Zainal, S., and Campbell, P.J. (2016). cgpCaVEManWrapper: simple execution of CaVEMan in order to detect somatic single nucleotide variants in NGS data. Curr. Protoc. Bioinformatics56, 15.10.1–15.10.18.
Kinsella, M., Patel, A., and Bafna, V. (2014). The elusive evidence for chromo-thripsis. Nucleic Acids Res.42, 8231–8242.
Klatte, T., Rao, P.N., de Martino, M., LaRochelle, J., Shuch, B., Zomorodian, N., Said, J., Kabbinavar, F.F., Belldegrun, A.S., and Pantuck, A.J. (2009). Cytogenetic profile predicts prognosis of patients with clear cell renal cell car-cinoma. J. Clin. Oncol.27, 746–753.
Knudson, A.G., Jr. (1971). Mutation and cancer: statistical study of retinoblas-toma. Proc. Natl. Acad. Sci. USA68, 820–823.
Korbel, J.O., and Campbell, P.J. (2013). Criteria for inference of chromothripsis in cancer genomes. Cell152, 1226–1236.
Kovacs, G., Szu¨cs, S., De Riese, W., and Baumga¨rtel, H. (1987). Specific chro-mosome aberration in human renal cell carcinoma. Int. J. Cancer40, 171–178.
Kryukov, G.V., Wilson, F.H., Ruth, J.R., Paulk, J., Tsherniak, A., Marlow, S.E., Vazquez, F., Weir, B.A., Fitzgerald, M.E., Tanaka, M., et al. (2016). MTAP dele-tion confers enhanced dependency on the PRMT5 arginine methyltransferase in cancer cells. Science351, 1214–1218.
Kyo, S., Takakura, M., Taira, T., Kanaya, T., Itoh, H., Yutsudo, M., Ariga, H., and Inoue, M. (2000). Sp1 cooperates with c-Myc to activate transcription of
the human telomerase reverse transcriptase gene (hTERT). Nucleic Acids Res.28, 669–677.
Lawrence, M.S., Stojanov, P., Polak, P., Kryukov, G.V., Cibulskis, K., Siva-chenko, A., Carter, S.L., Stewart, C., Mermel, C.H., Roberts, S.A., et al. (2013). Mutational heterogeneity in cancer and the search for new cancer-associated genes. Nature499, 214–218.
Lek, M., Karczewski, K.J., Minikel, E.V., Samocha, K.E., Banks, E., Fennell, T., O’Donnell-Luria, A.H., Ware, J.S., Hill, A.J., Cummings, B.B., et al.; Exome Aggregation Consortium (2016). Analysis of protein-coding genetic variation in 60,706 humans. Nature536, 285–291.
Li, L., Shen, C., Nakamura, E., Ando, K., Signoretti, S., Beroukhim, R., Cowley, G.S., Lizotte, P., Liberzon, E., Bair, S., et al. (2013). SQSTM1 is a pathogenic target of 5q copy number gains in kidney cancer. Cancer Cell24, 738–750.
Maciejowski, J., Li, Y., Bosco, N., Campbell, P.J., and de Lange, T. (2015). Chromothripsis and kataegis induced by telomere crisis. Cell163, 1641–1654.
Maher, E.R., Yates, J.R., and Ferguson-Smith, M.A. (1990). Statistical analysis of the two stage mutation model in von Hippel-Lindau disease, and in sporadic cerebellar haemangioblastoma and renal cell carcinoma. J. Med. Genet.27, 311–314.
Mandriota, S.J., Turner, K.J., Davies, D.R., Murray, P.G., Morgan, N.V., Sowter, H.M., Wykoff, C.C., Maher, E.R., Harris, A.L., Ratcliffe, P.J., and Maxwell, P.H. (2002). HIF activation identifies early lesions in VHL kidneys: evidence for site-specific tumor suppressor function in the nephron. Cancer Cell1, 459–468.
Martincorena, I., Roshan, A., Gerstung, M., Ellis, P., Loo, P., Van, McLaren, S., Wedge, D.C., Fullam, A., Alexandrov, L.B., Tubio, J.M., et al. (2015). High burden and pervasive positive selection of somatic mutations in normal human skin. Science348, 880–886.
Martincorena, I., Raine, K.M., Gerstung, M., Dawson, K.J., Haase, K., Van Loo, P., Davies, H., Stratton, M.R., and Campbell, P.J. (2017). Universal patterns of selection in cancer and somatic tissues. Cell171, 1029–1041.
Nielsen, S.M., Rhodes, L., Blanco, I., Chung, W.K., Eng, C., Maher, E.R., Richard, S., and Giles, R.H. (2016). von Hippel-Lindau disease: genetics and role of genetic counseling in a multiple neoplasia syndrome. J. Clin. Oncol.
34, 2172–2181.
Nijhawan, D., Zack, T.I., Ren, Y., Strickland, M.R., Lamothe, R., Schumacher, S.E., Tsherniak, A., Besche, H.C., Rosenbluh, J., Shehata, S., et al. (2012). Cancer vulnerabilities unveiled by genomic loss. Cell150, 842–854.
Nik-Zainal, S., Van Loo, P., Wedge, D.C., Alexandrov, L.B., Greenman, C.D., Lau, K.W., Raine, K., Jones, D., Marshall, J., Ramakrishna, M., et al.; Breast Cancer Working Group of the International Cancer Genome Consortium (2012). The life history of 21 breast cancers. Cell149, 994–1007.
Nik-Zainal, S., Davies, H., Staaf, J., Ramakrishna, M., Glodzik, D., Zou, X., Martincorena, I., Alexandrov, L.B., Martin, S., Wedge, D.C., et al. (2016). Land-scape of somatic mutations in 560 breast cancer whole-genome sequences. Nature534, 47–54.
Oh, S., Song, Y.H., Yim, J., and Kim, T.K. (2000). Identification of Mad as a repressor of the human telomerase (hTERT) gene. Oncogene19, 1485–1490.
Ong, K.R., Woodward, E.R., Killick, P., Lim, C., Macdonald, F., and Maher, E.R. (2007). Genotype-phenotype correlations in von Hippel-Lindau disease. Hum. Mutat.28, 143–149.
Pavlovich, C.P., Padilla-Nash, H., Wangsa, D., Nickerson, M.L., Matrosova, V., Linehan, W.M., Ried, T., and Phillips, J.L. (2003). Patterns of aneuploidy in stage IV clear cell renal cell carcinoma revealed by comparative genomic hy-bridization and spectral karyotyping. Genes Chromosomes Cancer 37, 252–260.
Raine, K.M., Hinton, J., Butler, A.P., Teague, J.W., Davies, H., Tarpey, P., Nik-Zainal, S., and Campbell, P.J. (2015). cgpPindel: identifying somatically ac-quired insertion and deletion events from paired end sequencing. Curr. Protoc. Bioinformatics52, 15.7.1–15.7.12.
Sabo`, A., and Amati, B. (2014). Genome recognition by MYC. Cold Spring Harb. Perspect. Med.4, 1–14.
Sato, Y., Yoshizato, T., Shiraishi, Y., Maekawa, S., Okuno, Y., Kamura, T., Shi-mamura, T., Sato-Otsubo, A., Nagae, G., Suzuki, H., et al. (2013). Integrated molecular analysis of clear-cell renal cell carcinoma. Nat. Genet.45, 860–867.
Scelo, G., Riazalhosseini, Y., Greger, L., Letourneau, L., Gonza`lez-Porta, M., Wozniak, M.B., Bourgey, M., Harnden, P., Egevad, L., Jackson, S.M., et al. (2014). Variation in genomic landscape of clear cell renal cell carcinoma across Europe. Nat. Commun.5, 5135.
Shen, C., Beroukhim, R., Schumacher, S.E., Zhou, J., Chang, M., Signoretti, S., and Kaelin, W.G., Jr. (2011). Genetic and functional studies implicate HIF1aas a 14q kidney cancer suppressor gene. Cancer Discov.1, 222–235.
Smittenaar, C.R., Petersen, K.A., Stewart, K., and Moitt, N. (2016). Cancer inci-dence and mortality projections in the UK until 2035. Br. J. Cancer115, 1147–1155.
Stephens, P.J., Greenman, C.D., Fu, B., Yang, F., Bignell, G.R., Mudie, L.J., Pleasance, E.D., Lau, K.W., Beare, D., Stebbings, L.A., et al. (2011). Massive genomic rearrangement acquired in a single catastrophic event during cancer development. Cell144, 27–40.
Turajlic, S., and Swanton, C.; TRACERx Renal consortium (2017). TRACERx Renal: tracking renal cancer evolution through therapy. Nat. Rev. Urol.14, 575–576.
Turajlic, S., Xu, H., Litchfield, K., Rowan, A., Horswell, S., Chambers, T., O’Brien, T., Lopez, J.I., Watkins, T.B.K., Nicol, D., et al. (2018a). Deterministic Evolutionary Trajectories Influence Primary Tumor Growth: TRACERx Renal. Cell173, this issue, 595–610.
Turajlic, S., Xu, H., Rowan, A., Chambers, T., Horswell, S., Litchfield, K., O’Brien, T., Lopez, J.I., Watkins, T., Stares, M., et al. (2018b). Tracking Cancer Evolution Reveals Constrained Routes To Metastases: TRACERx Renal. Cell
173, this issue, 581–594.
Varela, I., Tarpey, P., Raine, K., Huang, D., Ong, C.K., Stephens, P., Davies, H., Jones, D., Lin, M.L., Teague, J., et al. (2011). Exome sequencing identifies frequent mutation of the SWI/SNF complex gene PBRM1 in renal carcinoma. Nature469, 539–542.
Wang, T., Birsoy, K., Hughes, N.W., Krupczak, K.M., Post, Y., Wei, J.J., Lander, E.S., and Sabatini, D.M. (2015). Identification and characterization of essential genes in the human genome. Science350, 1096–1101.
Welch, J.S., Ley, T.J., Link, D.C., Miller, C.A., Larson, D.E., Koboldt, D.C., Wartman, L.D., Lamprecht, T.L., Liu, F., Xia, J., et al. (2012). The origin and evolution of mutations in acute myeloid leukemia. Cell150, 264–278.
Wu, K.J., Grandori, C., Amacker, M., Simon-Vermot, N., Polack, A., Lingner, J., and Dalla-Favera, R. (1999). Direct activation of TERT transcription by c-MYC. Nat. Genet.21, 220–224.
Yang, Z.Q., Yoshida, M.A., Fukuda, Y., Kurihara, N., Nakamura, Y., and Ina-zawa, J. (2000). Molecular cytogenetic analysis of 17 renal cancer cell lines: increased copy number at 5q31-33 in cell lines from nonpapillary carcinomas. Jpn. J. Cancer Res.91, 156–163.
Zbar, B., Brauch, H., Talmadge, C., and Linehan, M. (1987). Loss of alleles of loci on the short arm of chromosome 3 in renal cell carcinoma. Nature327, 721–724.
STAR
+
METHODS
KEY RESOURCES TABLE
CONTACT FOR REAGENT AND RESOURCE SHARING
Further information and requests for resources and reagents should be directed to and will be fulfilled by the Lead Contact, Peter J. Campbell (pc8@sanger.ac.uk).
EXPERIMENTAL MODEL AND SUBJECT DETAILS
Multi-region tumor samples were collected from patients enrolled in TRACERx Renal study (Turajlic and Swanton, 2017) (National Health Service Research Ethics Committee approval 11/LO/1996). The study sponsor is the Royal Marsden NHS Foundation Trust, the chief investigator Dr Samra Turajlic is responsible for study oversight, and the study is coordinated by the Renal Unit at the Royal Marsden Hospital. The TRACERx Renal consortium contributed collectively to this study. Samples were collected at the various study sites and processed by the laboratory at the Francis Crick Institute. Eligible patients were > 18 years with a suspected diagnosis of renal cell cancer of any stage, undergoing resection of the primary tumor. Only cases with clear cell histology at initial
REAGENT or RESOURCE SOURCE IDENTIFIER
Biological Samples
Multi-regional biopsies and blood normal samples from patients with renal cell cancer specimens
Turajlic et al., 2018a http://tracerx.co.uk/studies/renal/
Chemicals, Peptides, and Recombinant Proteins
PCR buffer Thermo-Fisher Cat#CM-251
dNTPs Thermo-Fisher Cat#SP-1050
Bitaine 5M Cat#77507
TAQ polymerase Thermo-Fisher Cat#AB-0908
Gel ladder LONZA Cat#50473
PCR product cleanup Thermo-Fisher Cat#78201.1.ML
Deposited Data
Raw and analyzed data This paper EGAD00001003445
Observed mutations in theVHLgene Catalogue Of Somatic Mutations In Cancer
http://cancer.sanger.ac.uk/cosmic/
WGS data from ‘‘Patient-specific factors influence somatic variation patterns in von Hippel–Lindau disease renal tumors’’
dbGAP phs001107.v1.p1
Oligonucleotides
Primer CACCCGTCCTGCCCCTTCACCTT This paper N/A
Primer CGCAGCCACTACCGCGAGGTGCT This paper N/A
Software and Algorithms
CaVEMan Jones et al., 2016 https://github.com/cancerit/CaVEMan
Pindel Raine et al., 2015 https://github.com/genome/pindel
BRASS Campbell et al., 2008 https://github.com/cancerit/BRASS
Battenberg Nik-Zainal et al., 2012 https://github.com/cancerit/cgpBattenberg
Telomerecat Farmery et al., 2017 https://pypi.python.org/pypi/telomerecat
N-dimensional clustering of mutations Nik-Zainal et al., 2012 Available on request
Non-coding driver discovery Nik-Zainal et al., 2016 https://github.com/im3sanger/dndscv
Estimation of mutation rate per year and ages at which landmark events occur
This paper Data S1
Rate of VHL driver mutations This paper Data S1
histopathological examination were included in the analyses, although one tumor (K169) could not be subsequently classified (Table S2). Detailed study criteria, procedures and sample classification are available in the companion paper (Turajlic et al., 2018a).
METHOD DETAILS
DNA sequencing and alignment
150 base paired-end sequencing was performed with the HiSeq X Ten system according to Illumina protocols. Average coverage was 67x for tumor samples and 36x for normal samples (Table S1). Alignment of paired-end reads to the reference human genome (GRCh37) used the Burrows-Wheeler Aligner, BWA-MEM.
Variant detection
Single-nucleotide substitutions were called using the CaVEMan (cancer variants through expectation maximization) algorithm (https://github.com/cancerit/CaVEMan;Jones et al., 2016). Small insertions and deletions were called using split-read mapping im-plemented by the Pindel algorithm (https://github.com/genome/pindel;Raine et al., 2015). To call rearrangements we applied the BRASS (breakpoint via assembly) algorithm, which identifies rearrangements by grouping discordant read pairs that point to the same breakpoint event (https://github.com/cancerit/BRASS; Campbell et al., 2008). All mutations were annotated to Ensembl version 58. Copy-number data were derived from whole-genome reads using the Battenberg algorithm (https://github.com/ cancerit/cgpBattenberg;Nik-Zainal et al., 2012).
Variant validation
We assessed the precision and recall of the whole genome sequencing analysis using the deep, targeted panel sequencing data from multi-region samples reported in the companion paper. Of the 127 somatic driver point mutations reported inFigure 1B, there were 17 discrepancies between the WGS and the panel dataset. These discrepancies break down as follows:
d 9 mutations were not detected in the whole genome sequencing data, but were in the panel data. In all cases, they were present subclonally in the panel data, typically in only a single biopsy. There were no reads reporting these variants in the whole genome sequencing data.
d 5 mutations were called as ‘clonal’ in the whole genome sequencing data but ‘subclonal’ in the panel data. This occurred because mutations had a high variant allele fraction in the WGS data, but were absent from one or more biopsies studied in the panel sequencing data.
d 3 mutations were called in the WGS but not in the panel sequencing. Again, there were no reads reporting these variants in the
panel sequencing data, suggesting they are subclonal variants in the tumor as a whole. Manual review of these variants sug-gested they were genuine somatic mutations, not sequencing artifacts.
None of the regions with coverage < 60x had missed any mutations called in the driver panel. We also found correlation between coverage depth and number of mutations called (r2= 0.20), suggesting that although the obtained sequencing depth was somewhat
variable, this had little impact on our variant calling.
Thus, all the discrepancies between the WGS and panel sequencing were due to the spatial heterogeneity of kidney cancers, and the variant calling algorithms appeared to be performing well. A discussion regarding the optimum number of biopsies required for full driver detection takes place in the companion paper; even 10 biopsies will miss the occasional drivers.
Capillary sequencing validation of TERT mutations
An additional 286 samples from 94 patients with ccRCC underwent a focal screen of theTERTpromoter to validate mutations de-tected in this dataset (Figure 2A). Briefly, the DNA dilutions were prepared at a concentration of approx. 8ng/ml. Primers (CACCCG TCCTGCCCCTTCACCTT and CGCAGCCACTACCGCGAGGTGCT, Sigma-Aldrich) were diluted to a 400mmol concentration.
The PCR premix was made using for each well using 0.94mL of 10x PCR buffer (Thermo-Fisher dNTP mix cat no CM-251), 0.94mL of dNTPs (Thermo-Fisher PCR Buffer 1 cat no SP-1050), 1.13mL of Bitaine (5M Ultrapure Bitaine, Affymetrix p/n 77507), and 0.09mL of TAQ polymerase (Thermo-Start TAQ, Thermo-Fisher cat no AB-0908). PCRs were setup using 7.5mL primer mix, 4.5mL diluted DNA and 3mL PCR premix. Plates were sealed, briefly centrifuged and run on the thermocycler (MJ Research Tetrad 2) using the following conditions: 95C for 8 minutes followed by 40 cycles of 62C for 2 minutes, 72C for 2 minutes 30 s, 95C for 15 s and 72C for 7 minutes.