DIMENSIONING OF A WATER PUMPING SYSTEM BY THE GENETIC ALGORITHMIC METHOD
*
Guy Clarence Sèmassou, Jean
Laboratory of Applied Energetic and Mechanics (LEMA), Polytechnic School of Abomey
University of Abomey
ARTICLEINFO ABSTRACT
This paper presents the design of a wind pumping system coupled to a
work has been done with the HOGA program (Hybrid Optimization by Genet Different objective functions used in the design process are the
concept for the reliability, the
of life cycle on the production of the various system components. With the presented model, the optimization of the design of wind pumping system can be realized technically, economically and environmentally, while ensuring the needs of the consumer without interruption. Design variables used are the wind turbines number (N
tank (T
conducted to analyse one wind turbine pumping projet, which is designed to supply drinking water in a rural community located at Sèmè
Copyright © 2018, Guy Clarence Sèmassou et al. This is an open access article distributed under the Creative Commons Attribution License, which permits unrestricted use, distribution, and reproduction in any medium, provided the original work is properly cited.
INTRODUCTION
Water is a vital element and covers about 70% of the surface of the planet. It is used to supply drinking water for people, livestock, irrigation, etc. The alarming de
water quality and the growing inequality of water resources coupled with reduced rainfall in many arid countries pose serious problems in terms of health, urban planning, economics, brief development. Today, many African countries are experiencing a great crisis of drought. Faced with this situation, a question arises: how to power these water populations, whose absence is a factor of the under development? Ground waters seem to be the only alternative to this dilemma; but all is not enough to have groundwater; it is indispensable to develop technology for pumping the water extraction. Pumping water has become in our days a major issue for the improvement of living conditions and socio economic development of rural communities. Several technologies make it possible today to bring a valid, durable and clean solution. Pumping systems are distinguished according to their energy source: Manual - pedal
animal traction - wind - a diesel generator respectively gasoline - photo voltaics.
*Corresponding author: Guy Clarence Sèmassou,
Laboratory of Applied Energetic and Mechanics (LEMA), Polytechnic School of Abomey-calavi (EPAC), University of Abomey-Calavi (UAC)
DOI:https://doi.org/10.24941/ijcr.31675.07.2018
ISSN: 0975-833X
Article History:
Received 24th April, 2018
Received in revised form 19th May, 2018
Accepted 27th June, 2018
Published online 31st July, 2018
Citation: Guy Clarence Sèmassou, Jean-Louis Fannou, Valery Doko, Emile Sanya, Vianou, A.
genetic algorithmic method”, International Journal of Current Research
Availableonlineathttp://www.journal
Key Words:
Wind Turbine, Optimization, Motor-Pump model,
Desirability, Objective Function, Genetic Algorithm.
RESEARCH ARTICLE
DIMENSIONING OF A WATER PUMPING SYSTEM BY THE GENETIC ALGORITHMIC METHOD
Guy Clarence Sèmassou, Jean-Louis Fannou, Valery Doko, Emile Sanya, Vianou, A.
Laboratory of Applied Energetic and Mechanics (LEMA), Polytechnic School of Abomey
University of Abomey-Calavi (UAC), Benin
ABSTRACT
This paper presents the design of a wind pumping system coupled to a
work has been done with the HOGA program (Hybrid Optimization by Genet Different objective functions used in the design process are the
concept for the reliability, the Life Cycle Cost (LCC) for the economic evaluation and CO
of life cycle on the production of the various system components. With the presented model, the optimization of the design of wind pumping system can be realized technically, economically and vironmentally, while ensuring the needs of the consumer without interruption. Design variables used are the wind turbines number (NW), the type of wind (TW), the tank number (N
tank (Ttank), type mast (Ttower) and total head (Thead), that is to say the type of well. A case study is conducted to analyse one wind turbine pumping projet, which is designed to supply drinking water in a rural community located at Sèmè-Kpodji, Benin (6°22’N, 2°37’E, 7m).
This is an open access article distributed under the Creative Commons Attribution License, which permits unrestricted use, distribution, and reproduction in any medium, provided the original work is properly cited.
Water is a vital element and covers about 70% of the surface of the planet. It is used to supply drinking water for people, livestock, irrigation, etc. The alarming deterioration of the water quality and the growing inequality of water resources coupled with reduced rainfall in many arid countries pose serious problems in terms of health, urban planning, economics, brief development. Today, many African countries periencing a great crisis of drought. Faced with this situation, a question arises: how to power these water populations, whose absence is a factor of the under waters seem to be the only alternative to gh to have groundwater; it is indispensable to develop technology for pumping the water extraction. Pumping water has become in our days a major issue for the improvement of living conditions and socio-economic development of rural communities. Several
hnologies make it possible today to bring a valid, durable and clean solution. Pumping systems are distinguished pedal - powered by a diesel generator respectively
Laboratory of Applied Energetic and Mechanics (LEMA), Polytechnic School Calavi (UAC), Benin.
However, pumping systems for wind, photovoltaics becoming more attractive and compete from cost perspective and performance with systems using conventional energy sources. Systems powered by renewable energy sources (solar and wind) are particularly useful in remote areas where fuel supply is problematic. Benin has in its southern part some wind corridors that are conducive to the development of wind mills of pumping. In the literature, several studies have been made in the field of water pumping for water supply of the population. Thus, some authors
models of various components of a hybrid energy system or not and others have developed a methodology for estimating the economic and energy cost over the life cycle of sub components of these systems (Badescu, 2003
2007; Hamidat, Hagj Arab and Boukadoum, 2005 Chow et al., 2006; Odeh, Yohanis and Norton, 2010 and Salameh, 1996; Ai et al.,
Markvart, 1996, Yang et al.,
Bernal-Augustίn et al., 2006 Augustίn, 2008; Yang et al.,
2010; Diaf et al., 2008a; Deshmukh and Deshmukh, 2008 Hamidat and Benyoucef, 2008;
Khan and Iqbal, 2005; Koutroulis
Salameh, 1997; Ofry and Brauntein, 1983). With present design methods, the size of the tank is often coarsely estimated. Thus, in the case of too small a tank, there has been overflow of water. As against, over
be present in construction costs too high. In this paper the
International Journal of Current Research Vol. 10, Issue, 07, pp.72042-72051, July, 2018
Louis Fannou, Valery Doko, Emile Sanya, Vianou, A. 2018. “Dimensioning of a water pumping system by the International Journal of Current Research, 10, (07), 72042-72051.
Availableonlineathttp://www.journalcra.com
DIMENSIONING OF A WATER PUMPING SYSTEM BY THE GENETIC ALGORITHMIC METHOD
Louis Fannou, Valery Doko, Emile Sanya, Vianou, A.
Laboratory of Applied Energetic and Mechanics (LEMA), Polytechnic School of Abomey-calavi (EPAC),
This paper presents the design of a wind pumping system coupled to a reservoir of water storage. This work has been done with the HOGA program (Hybrid Optimization by Genetic Algorithms). Different objective functions used in the design process are the Loss of Power Probability (LPSP) (LCC) for the economic evaluation and CO2 emissions of life cycle on the production of the various system components. With the presented model, the optimization of the design of wind pumping system can be realized technically, economically and vironmentally, while ensuring the needs of the consumer without interruption. Design variables ), the tank number (Ntank), the type of is to say the type of well. A case study is conducted to analyse one wind turbine pumping projet, which is designed to supply drinking water in
Kpodji, Benin (6°22’N, 2°37’E, 7m).
This is an open access article distributed under the Creative Commons Attribution License, which permits
However, pumping systems for wind, photovoltaics are becoming more attractive and compete from cost perspective and performance with systems using conventional energy powered by renewable energy sources (solar and wind) are particularly useful in remote areas where fuel matic. Benin has in its southern part some wind corridors that are conducive to the development of wind mills of pumping. In the literature, several studies have been made in the field of water pumping for water supply of the population. Thus, some authors have developed physical models of various components of a hybrid energy system or not and others have developed a methodology for estimating the economic and energy cost over the life cycle of sub-components of these systems (Badescu, 2003; Zafirakis et al.,
Hamidat, Hagj Arab and Boukadoum, 2005; Fanx, 1979; Odeh, Yohanis and Norton, 2010; Borowy
et al., 2003, Kaabeche et al., 2006;
et al., 2008; Ekren and Ekren, 2010; 2006; Dufo-López and
Bernal-et al., 2003, 2007; Kaabeche et al.,
Deshmukh and Deshmukh, 2008; ; Rajendra and Natarajan, 2006; Koutroulis et al., 2006; Borrowy and Ofry and Brauntein, 1983). With present design methods, the size of the tank is often coarsely estimated. Thus, in the case of too small a tank, there has been overflow of water. As against, over-sized with a reservoir, may esent in construction costs too high. In this paper the INTERNATIONAL JOURNAL OFCURRENTRESEARCH
optimization of a Wind system, with water storage tank (see Fig. 1) to supply the electrical demand for water pumping in a small town located near Cotonou (Benin) is described. The optimization is based on the concepts of minimization of LPSP (the power supply loss probability), the life cycle cost (LCC) for the economic and CO2 emissions. The NSGA-II algorithm,
evolutionary genetic type was used in order to determine the set of optimal compromise solutions, which are ranked in descending order according to their desirability. The method used is declined in four steps. Firstly we proceed to the analysis of the water needs of the locality, then draw up models of the various components of the system, then defines the performance criteria and the different rates of satisfaction and finally proceeds to the classification and selection of solutions.
MATERIALS AND METHODS
Consumption profile adopted and Wind Data: Water requirements of the selected location are not negligible. The final water uses distribution obtained in this study is the following: faucets (39.20%), toilets (22.2%), showers (19.9%), clothes washers (9.7%) and finally leaks (8.9%) (See Fig.1a).
Figure1. Water use: (a) Water uses distribution. (b) Hourly water consumption profile through the day
Consumption is not constant every day of the year; it fluctuates according to the months of the year, according to the weeks of the month, the days of the week and different times of the day.This variation reflects in the time the rhythm of human activities. The daily water consumption of the tow is 30m3/day (we have considered that it is the same for all the day in the year), and the hourly water consumption profile through the day is show in Figure1b. The proposed method is applied to a wind system designed to meet the daily water consumption needs of rural household. Data on wind speed from the meteorological station in Cotonou, located a kilometer trantaine of the site selected in this work. In addition, these
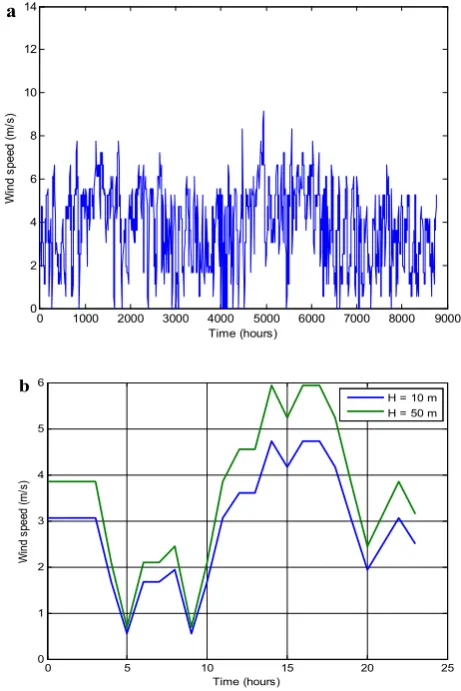
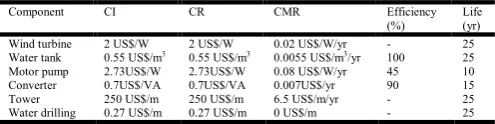
[image:2.595.312.543.153.499.2]data are measured at 10 m from the ground and made an extrapolation using empirical models in the literature (Equation 1) to obtain the wind speed at 50 m above the ground. In Figure 2a are represented Hourly data of the wind speed at 10 m from the ground on one year and Figure 2b are represented Hourly data of the wind speed at 10 m and 50 m from the ground over one day.
Figure 2. Variation of wind speed: (a) Speed on a Year. (b) Speed on a day to 10mand 50m above the ground.
[image:2.595.305.565.584.665.2]The design variables needed to determine solutions are summarized in Table 1.
Table 1. Design variables
Design variables Nomenclature Range Component type considered
Wind turbine number NW 1-20 -
Tank number Ntank 1-10 -
Type of wind turbine TW 1-2 600 W - 1300 W
Type of tank Ttank 1-2 20 m3 – 50 m3
Type of tower Ttower 1-3 50 m – 60 m – 70 m
Type of well Thead 1-3 30 m – 50 m – 70 m
Description of the pumping system: To meet these needs, wind turbines can be used as an energy source for pumping water. The system used herein comprises a turbine, a water source, a water tank and a subsystem pumping (pump and motor) (see Fig. 3). For the systems of wind pumping operating over wind, the storage of water in the tanks is the solution most adopted compared to electrochemical storage in the batteries. Instead of storing the surplus of energy produced in expensive accumulators, this is the surpluses of pumped water which are stocked in a tank. This type of system has obtained excellent performances in real operating conditions.
0 1000 2000 3000 4000 5000 6000 7000 8000 9000
0 2 4 6 8 10 12 14
Time (hours)
W
ind
s
p
e
e
d
(
m/
s
)
a
0 5 10 15 20 25
0 1 2 3 4 5 6
Time (hours)
W
ind
s
pee
d
(m/
s)
H = 10 m H = 50 m
Wind pumping system allows the conversion of mechanical energy into electrical energy through a rotor coupled to a generator, which controls the pump AC rated power 1000 W
Fig.3. Configuration of a wind turbine powered pumping system
Wind turbine system model: Power output of wind turbine generator at a specific site depends on wind speed at hub height and speed characteristics of the turbine. Wind speed at hub height can be calculated by using power-law equation (Patel, 1999):
1 2 1 2
Z Z V V
(1)
(1)
Where
V1 and V2 are the wind speed at hub and reference height Z2 and Z1 and is roughness coefficient whose value generally varies
between 0.1 and 0.25 depending on the site. The oneseventh power law (0.14) is a good reference number for relatively flat surfaces such as theopen terrain of grasslands away from tall trees or buildings. Choosing a suitable model is veryimportant for wind turbine power output simulations. The most simplified model to simulatethe power output of a wind turbine (Lu et al., 2002) can be described by:
f c
f r
r
r c
c r
c r
W
V V and V V
V V V P
V V V V
V V V P
P
; 0
; ; *
(2) (2)
where
Pr is the rated electrical power; Vc is the cut-in wind speed; Vr is
the rated wind speed; and Vf is the cut-off wind speed. The two
turbines used in this study are of IMEX-Blade usingMaglev technology. Their characteristics are summarized in Table 9. Pumping subsystems model: To determine the power of a submerged wells or drilling pump or surface pump, it is necessaryto know the total head well as flow that we would like to tap. Thus, whereas in a wind pumpingsystem, the required electrical power output to the motor-pump combination can be expressedas (Clarck et al., 1992; Bouzidi
et al., 2006; Hadj Arab et al., 2005):
3600
t L
H
Q
g
t
P
(3)
Where Qis the ouput water rate
m3/h
,
is the density of water (kg/m3),g
is the acceleration due to gravity (m/s2), 3600 is the number of second per hour,Htis total head (m) and
is the power efficiency of the motor-pump combinaison.The hourly consumption corresponding energy (Wh) of the pump is given by:
t P
t TEL L (4) Water storage tank model
The state of charge of a tank depends on wind production and water needs of users.Thus, the energy stored in the tankat a time t can be expressed by the following equation:
Water storage charging,
kconv L W k
k
t E t E t
E t
Etan tan 1 tan
(5) Water storage discharging,
E t E t E t
t
E W
conv L k
k
1 tan tan
(6) WhereEtank
t andEtank
t1
the energy stored in the tank (Wh) at the timet
andt
1
, are respectively; EW
t is the total energy generated by wind turbines after energy loss of controller (Wh);EL
t is the energy hydraulic demand at the timet
(Wh);
conv and
tankare the conversion efficiency and charge efficiency of water storage tank, respectively,
tankis taken equal to 1.At any timet
, the charged quantity of the water storage tank is subject to the following two contraints:
tan ,max tan0
E
kt
E
k (7)WhereEtank,maxis the maximum storage capacity of the tank.
The functioning of tank is similar to that of a battery in an ordinary wind system. Thus, when the production of wind is sufficient water needs are satisfied and the rest of the energy is used to fill the tank. The water capacity of the tank is determined from the equation (5). In the case where the production of wind is not enough, the tank is loaded and its capacity is determined from equation (6).
Criteria for evaluating system performance
Definition of criteria:The choice of criteria is a crucial step in the formulation of an optimization problem. Thus, thecriteria necessary for the evaluation of system performance is related to aspects economic,environmental and reliability.
The economic model based on the LCC concept:Life cycle cost (LCC) includes the cost of initial investment, the cost of replacing thecomponent, the cost of maintenance and repair and the cost of downtime. For a component ofthe system i, the economic cost of the life cycle (during 25 years) can be expressed by thefollowing equation (Navaeefard et al., 2010; Dehghan et al., 2009; Khan et al., 2005):
i i i i v
i
i N CI CR K CMR PWAir R
LCC . . , (8) With:
i i y n L n i ir K 1 11 (9)
1 i v i L R
y If
R
v is dividable toL
i (10)i v i
L R
y If Rvis not dividable to
L
i (11)
vv R R v ir ir ir R ir PWA 1 1 1
, (12)
Where
N
iis number of componenti
,CI
iis the initial investment cost, is thereplacement cost, is the cost of maintenance and repair of component . and are annual and single payment present worth factors, respectively. and are number of replacements of component and its life time. is real interest rate, is project’s lifetime.We then deduce the total economic cost of the life cycle of the system:
i i totalLCC
C
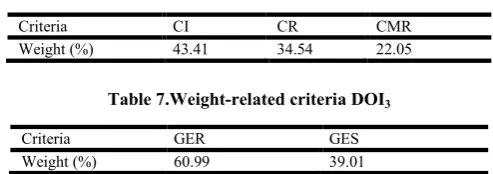
(13) [image:4.595.312.553.488.540.2]In this study, we chose = 6% and = 25 . The economic costs of the different components of the system are summarized in Table2.
Table 2 : Components specifications(Thiaux, 2010; Khan et al.,
2005; Navaeefard et al., 2010;
Yang et al., 2007; Yang et al., 2008; Bakelli et al., 2011)
Component CI CR CMR Efficiency
(%)
Life (yr)
Wind turbine 2 US$/W 2 US$/W 0.02 US$/W/yr - 25
Water tank 0.55 US$/m3
0.55 US$/m3
0.0055 US$/m3
/yr 100 25
Motor pump 2.73US$/W 2.73US$/W 0.08 US$/W/yr 45 10
Converter 0.7US$/VA 0.7US$/VA 0.007US$/yr 90 15
Tower 250 US$/m 250 US$/m 6.5 US$/m/yr - 25
Water drilling 0.27 US$/m 0.27 US$/m 0 US$/m - 25
Gross energy requirement: The life cycle analysis is a tool for decision support in eco-design for evaluating the environmental impact of the system, from raw material extraction to end of life system. The indicator chosen in this study is the Gross energy requirement (GER). This cost represents the total primary energy required for the manufacture, maintenance, recycling and transport to the place of use of the system. For an autonomous wind system, the overall energy cost is as follows:
H GER DV y GER P DV y GER E N DV GER P N GER tower conv conv conv conv n k k k k k W W n W Total . . . . . . . . . . . , tan tan tan max , tan tan
(14)
Where GERTotalis primary energy cost of the system,GERWis primary energy cost, Pnis rated power, is the life, of the wind. GERtankis primary energy cost, is the life, is number of replacements, of the water tank.GERconvis primary energy cost, is the life, is number of replacements, of the converter.GERtowerand Hare primary energy cost and height of the mast, of the wind, respectively.
In relation (14), we did not take into account the primary energy of the motorcycle pump due to lack of data.
Life cycle CO2 emissions: Energy consumption during the implementation of the system generates CO2 emissions can
also be evaluated as follows:
H GES DV y GES P y GES E N DV GES P N GES tower conv conv conv conv n k k k k W W n W Total . . . . . . . . . . , tan tan max , tan tan (15)
Where GESTotal is total CO2emissions of system, GESWis CO2
emission from wind, GEStankis CO2 emission from water tank,
conv
GES is CO2 emission from converter,GEStoweris CO2
emission from tower.
In relation (15), due to a lack of data, the CO2 emission
relating to the manufacture of the motorcycle pump is not taken into account Table 3 shows the calculation results for the energy consumption and CO2 emissions during system
equipment manufacture. These are the numerical values per unit capacity per year.
Table 3. Energy consumption and CO2 emissions in the system equipment manufacturing (Kemmoku et al., 2002,
Alsema et al., 2006; Thiaux, 2010; Madam, 2003)
Components Facility energy CO2 emissions
Wind turbine 0.215kWh/W.yr 69 g CO2/W.yr
Water tank 445 kWh/m3.yr 34000 g CO
2/m3.yr
Converter 0,4 kWh/VA.yr 12,5 g CO2/VA.yr
Tower 7.2 kWh/m 5.9 gCO2/m
Loss power supply probability: Because of the intermittent wind speed characteristics, which highly influence the energy production from the system, power reliability analysis is usually considered as an important step in any such system design process. There are a number of methods used to calculate the reliability of the systems. The most popular method is the loss of power supply probability (LPSP) method. The LPSP is the probability that an insufficient power supply results when the system (wind power and energy storage) is not able to satisfy the load demand. The design ofa reliable stand-alone wind system can be pursued by using the LPSP as the key design parameter. For an analysis period T (1 year in this study), the LPSP is the ratio of the sum of all values of energy loss LPS for the same period of the energy required. The loss of energy is expressed by (Bogdan and Salameh, 1997):
t EL
t
EW
t E k
t
convLPS tan 1
(16) [image:4.595.39.287.580.642.2]
T
t L T
t
t E t LPS LPSP
1 1
/ (17)
Models of the rates of satisfaction: The different criteria used in this study are not the same size. To solve this problem of scaling, desirability functions for transforming the variables dimensionless criteria are tapped. But the choice of a desirability function depends on the requirements of the study to be conducted in our case, all criteria are to minimize as shown in Table 6. For this purpose, the function of desirability of Harrington is used (Sebastian et al., 2010):
Ym
Ym
d expexp
. avec
USL
AUC
ln ln 0,01/ln 0,99
,
ln 0,99
.USLln
(18)
Where isthedesirabilityassociatedwiththecriterion
Y
m, AUC is the absolute uppercut off, USL is the upper soft limit for the criterion. Levels of criteria are summarized in Table4.Table 4. Levels of criteria
Criteria Aim USL AUC
CI Minimize 100 50000
CR Minimize 100 50000
CMR Minimize 418 800
LPSP Minimize 0 60 %
GER GES
Minimize Minimize
957766085 723597795
1.0246*109
5.8365*109
Then, the criteria are aggregated according the aggregation method based on weighted geometric mean of the functions of desirabilities (Derringer et al., 1980):
q
r v r k
r d DOI
1
(19)
Where DOIk denote the indices of desirability and B the
weights relating to the criteria.DOI1is the index relating to the
economic shutter, DOI2 is related to the reliability of the
system, DOI3 is related to the environmental aspects.
Desirability indices obtained are aggregated according the same principle to lead to the global objective function:
3
1
k
w k
k
DOI
OF
(20)Where Wk denote the weighting coefficients concerning index
of desirability.
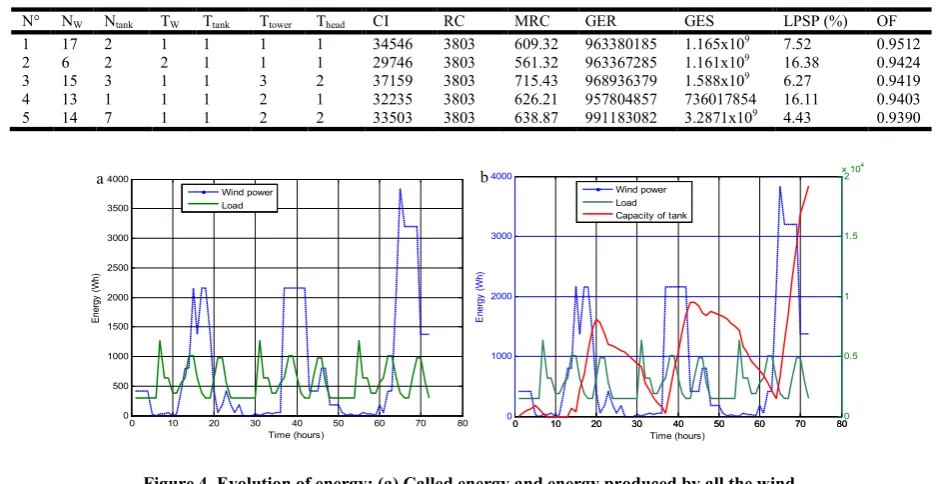
The weights used are essential because they represent the wishes of the user in the implementation of the wind system. The values of these weights are summarized in Tables 5, 6 and 7.
Table5. Weight of the indices of desirabilities
DOI1 DOI2 DOI3
Weight (%) 22.55 67.38 10.07
Table 6. Weight-related criteria DOI1
Criteria CI CR CMR
[image:5.595.308.555.66.153.2]Weight (%) 43.41 34.54 22.05
Table 7.Weight-related criteria DOI3
Criteria GER GES
Weight (%) 60.99 39.01
Optimization method used: The optimization of the dimensioning of wind turbine system is a multi-objective optimization. Indeed, the cost of the system (whether economic or energy) should be minimal while providing consumers with quality electricity supply the best possible. The number of variables is important, our choice fell on a genetic algorithm called NSGA-II (« Nondominated Sorting Genetic Algorithm II ») (Deb, 2009). This algorithm is called evolutionary since it refers to the theory of biological evolution. It is a multi-objective algorithm under constraints, based on a comprehensive approach to optimization in the sense that the exploratory nature of the algorithm will allow us to get the optimum sweeping wide spectrum of possibilities offered by the range of variation of the design variables. The main parameters of this algorithm are:
Number of generationsNG50
Number of individuals per generationNind100
Design variables (Table 1)
Probability of crossover Pc0.80
Mutation probability Pm0.05
The algorithm used to evaluate the performance of each individual by calculating the objectives, constraints specific to this individual and the global objective function after taking into account all the steps of the algorithm (crossover and mutation). In this study, six criteria are considered. These are:
Minimization of all criteria under DOI1 (CI, CR, CMR); Minimization of the criterion under DOI2 (LPSP); Minimization of all criteria under DOI3 (GER, GES).
Thus, for different sets of combination of design variables, we determine all the corresponding objective functions overall.100 solutions candidates in total are obtained that we classify by decreasing order according to their corresponding rate of satisfaction. After modeling the problem in our approach to optimize multi-objective can be summarized as follows: Find
x
N
W,
N
tank,
T
W,
T
tank,
T
tower,T
head
TWhich minimizesOF
x
CI
x,CR
x,...,GES
x
Subject to100CI
x 50000
50000100CR x
910 * 5.8365
723597795GES x (21)
20 1NW
10 1Ntank
2 , 1TW Ttank
3 1Ttower
Thus, for different sets of combination of design variables, the corresponding global objective functions are determined. The candidate solutions obtained are ranked in descending order according to their corresponding satisfaction.
RESULTS AND DISCUSSION
To check the status of operation of wind pumping system designed from models of the various constituent components, a simulation was achieved over three days.
For this purpose a wind pumping system consisting of 20 turbines each rated power 1300 W, coupled to 10 tanks of rated capacity 50m3 each is considered. The mast height is 70 m and the total head is 70 m. On Figure 4 (a), are superimposed the curves representing the load and the power produced by the entire wind turbine, respectively. From the observation of this figure, we see that the power produced by wind turbines is not regular and adjustable at will according to the needs of the user. For example, the maximum instantaneous power demand is 1272 W at 7 hours while the production of wind turbines is Table 8. Characteristics of the ten best solutions
N° NW Ntank TW Ttank Ttower Thead CI RC MRC GER GES LPSP (%) OF
1 17 2 1 1 1 1 34546 3803 609.32 963380185 1.165x10⁹ 7.52 0.9512
2 6 2 2 1 1 1 29746 3803 561.32 963367285 1.161x10⁹ 16.38 0.9424
3 15 3 1 1 3 2 37159 3803 715.43 968936379 1.588x10⁹ 6.27 0.9419
4 13 1 1 1 2 1 32235 3803 626.21 957804857 736017854 16.11 0.9403
[image:6.595.61.532.73.315.2]5 14 7 1 1 2 2 33503 3803 638.87 991183082 3.2871x10⁹ 4.43 0.9390
[image:6.595.113.482.344.473.2]Figure 4. Evolution of energy: (a) Called energy and energy produced by all the wind. (b) Variation of the charge state of the tank
Figure 5. 3D representation: (a) Different combinations of wind and tanks for different values of IC. (b) Different combinations of wind and tanks for different values of LPSP
Figure 6. Evolution of the objective functions based on combinations of design variables: (a) Desirability index related to the economic shutter. (b) Desirability index related to the reliability of the system
0 10 20 30 40 50 60 70 80
0 1000 2000 3000 4000
Time (hours)
E
n
er
gy
(
W
h
)
0 10 20 30 40 50 60 70 800 0.5 1 1.5 2 x 10⁴ Wind power
Load Capacity of tank
0 10 20 30 40 50 60 70 80 0
500 1000 1500 2000 2500 3000 3500 4000
Time (hours)
Ene
rg
y
(W
h
)
Wind power Load
a b
0
5
10
0 5 10 15 20 0.96 0.98 1 1.02 1.04 1.06 1.08 1.1
x 109
Tank number Wind turbine number
G
ro
ss
e
ne
rg
y
re
qu
ire
ment
(k
Wh
)
0.98 1 1.02 1.04 1.06 1.08 x 10⁹
1300 W - 50 m3 - 70 m - 70 m
0
5
10
0 5 10 15 20
2 3 4 5 6 7 8
x 104
Tank number Wind turbine number
Init
ia
l
in
v
e
s
tme
n
t
(U
S
$
)
2.5 3 3.5 4 4.5 5 5.5 6 6.5 7 x 10⁴ 1300 W - 50 m3 - 70 m - 70 m
a b
0 10 20 30 40 50 60 70 80 90 100 0
0.1 0.2 0.3 0.4 0.5 0.6 0.7 0.8 0.9 1
Possible configurations
In
dic
e
of
de
s
irab
ilit
y
:
D
OI
1
a
0 10 20 30 40 50 60 70 80 90 100 0
0.1 0.2 0.3 0.4 0.5 0.6 0.7 0.8 0.9 1
Possible configurations
In
d
ic
e
of
d
e
s
ir
a
b
ilit
y
:
D
OI
2
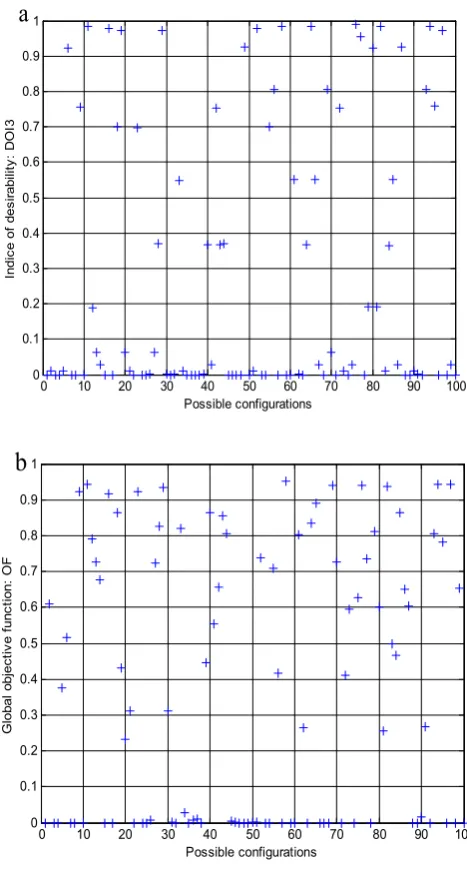
[image:6.595.103.487.516.647.2]only 26 W at this precise moment. So the phase shift between wind power and water consumption does not favor the optimization of wind nor water autonomy. As shown in Figure 4 (a), a significant proportion of wind power is not in line with the consumption. It is therefore necessary to add a wind system storage tanks in this case so that they can return the stored energy when the wind will not be able to cover the needs of the user. On Figure 4 (b), the variation of the charge state of the tanks a function of time well as the load and the power produced by wind turbines were simulated. The simulation was started with initially empty tanks. In times of strong wind (12:00 h to 19:00), wind turbines it possible to supply the consumer and fill the tanks. During periods of low wind (20:00 h to 30:00), wind power is insufficient and these are the tanks ensure the cover of the needs. Figure 5 shows the 3-D representation for various combinations of wind turbines and tanks for different values of IC and GER. For this purpose a wind turbine rated power 1300 W and a tank nominal capacity 50m3 are chosen. The height of the mast and the total head are fixed at 70 m.It is found that the greater the number of wind turbines and tank increases, IC increases (Figure5 (a)). It is the same for GER (Figure 5 (b)).Desirability indices related respectively to economic criteria and system reliability are shown in Fig. 6. We note that the maximum DOI1 is 0.9690
(see Fig. 6 a) and the associated optimal configuration corresponds to 1 wind turbines of 1300 W, 9 tanks of 20 m3 with a mast height. Desirability indices related respectively to economic criteria and system reliability are shown in Fig. 6. We note that the maximum DOI1 is 0.9690(see Fig. 6 a) and
the associated optimal configuration corresponds to 1 wind turbines of 1300 W, 9tanks of 20m3 with a mast height of 50 m and a total head of 70 m; which corresponds to a ratio of 7 W/m3. Whereas the maximum DOI2 is 0.9909(see Fig. 6 b) and
the associated optimal configurationcorrespondsto19 wind turbines of 1300 W, 14tanksof 20m3, with a mast 60 m and a total head of 70 m, which corresponds to a ratio of 88 W/m3. A similar representation is made in Fig. 7.
The maximum value DOI3 is 0.9899(see Fig. 7 a) and the
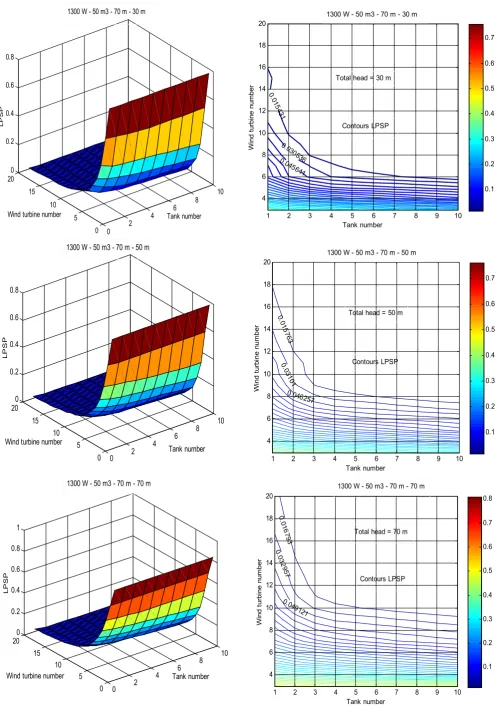
associated optimal configuration is 12 wind turbines of 600 W, 1tank of 20 m3 with a mast 70 m and a total head of 30 m; which corresponds to a ratio of 60 W/m3. Obviously, the three indices of desirability not lead to the same optimal configuration. Thus, the global objective function after aggregation index of desirability and shown in Fig. 7 b has the maximum value 0.9512.Figure 8, we selected the contours for which you want to display the value. At this optimal configuration corresponds 17 wind turbines rated power 600 W, 2 tanks of 20 m3 capacity, a mast height of 50 m and a total head 30 mins a ratio of 255 W/m3. Figure 9 shows the relationship between the values of LPSP and different system configurations for different total head. At each value of LPSP a game of combination of design variables corresponds. In this part, the types of wind turbines, tank, and mast are set. Analysis of this figure reveals that more total head is greater, more it requires a large number of wind turbines and tanks. In addition, more the value of LPSP is low, more the number of wind turbines and of tanks is high. Table 8 presents the five best solutions of the study well as their characteristics. These solutions satisfy the constraints of the problem and give results that minimize all the objectives defined in terms of three criteria while remaining within the scope of each decision variable. The first solution introduces a LPSP 7.52%. If we decide to cover all water needs (LPSP = 0%), it will use more wind turbines and tanks.
[image:7.595.312.546.53.490.2]Figure 7. Evolution of the objective functions based on combinations of design variables: (a) Desirability index linked to environmental aspects. (b) Global objective function of the system
Figure 8. Contours of the global objective function
0 10 20 30 40 50 60 70 80 90 100
0 0.1 0.2 0.3 0.4 0.5 0.6 0.7 0.8 0.9 1
Possible configurations
In
dic
e
of
d
es
ir
a
b
il
it
y
:
D
O
I3
a
0 10 20 30 40 50 60 70 80 90 100
0 0.1 0.2 0.3 0.4 0.5 0.6 0.7 0.8 0.9 1
Possible configurations
Glo
b
a
l
o
b
jec
tiv
e
f
u
n
c
tio
n
:
OF
b
Tank number
W
in
d
t
u
rb
in
e
n
u
m
b
e
r 0.90759
0.88944 0.87128
0.8530.8313498
1 2 3 4 5 6 7 8 9 10
2 4 6 8 10 12 14 16 18 20
0.1 0.2 0.3 0.4 0.5 0.6 0.7 0.8 0.9
[image:7.595.310.551.560.757.2]Figure 9. Visualization of LPSP: (a) 3 D representation of LPSP. (b) Contours LPSP
0 2
4
6 8 10
0 5 10 15 20
0 0.2 0.4 0.6 0.8
Tank number Wind turbine number
L
P
S
P
1300 W - 50 m3 - 70 m - 30 m
Tank number
W
in
d
t
u
rb
in
e
n
u
mb
e
r
0 .01
5 43
1
0.030 536 0.04
5641
1 2 3 4 5 6 7 8 9 10
4 6 8 10 12 14 16 18 20
0.1 0.2 0.3 0.4 0.5 0.6 0.7 1300 W - 50 m3 - 70 m - 30 m
Contours LPSP Total head = 30 m
0 2
4 6
8 10
0 5 10 15 20
0 0.2 0.4 0.6 0.8
Tank number Wind turbine number
L
P
S
P
1300 W - 50 m3 - 70 m - 50 m
Tank number
W
in
d
t
u
rb
in
e
n
u
m
b
e
r
0 .0
15 7 63
0 .03
1 01
0.046257
1 2 3 4 5 6 7 8 9 10
4 6 8 10 12 14 16 18 20
0.1 0.2 0.3 0.4 0.5 0.6 0.7
Contours LPSP Total head = 50 m 1300 W - 50 m3 - 70 m - 50 m
0 2
4 6
8 10
0 5 10 15 20
0 0.2 0.4 0.6 0.8 1
Tank number Wind turbine number
L
P
S
P
1300 W - 50 m3 - 70 m - 70 m
Tank number
W
in
d
t
u
rb
in
e
n
u
m
b
e
r
0 .01
6 79
3 0
.03 2 9
57
0.04 9121
1 2 3 4 5 6 7 8 9 10
4 6 8 10 12 14 16 18 20
0.1 0.2 0.3 0.4 0.5 0.6 0.7 0.8
The maximum value DOI3 is 0.9899(see Fig. 7 a) and the
associated optimal configuration is 12 wind turbines of 600 W, 1tank of 20 m3 with a mast 70 m and a total head of 30 m; which corresponds to a ratio of 60 W/m3. Obviously, the three indices of desirability not lead to the same optimal configuration. Thus, the global objective function after aggregation index of desirability and shown in Fig. 7 b has the maximum value 0.9512.Figure 8, we selected the contours for which you want to display the value. At this optimal configuration corresponds 17 wind turbines rated power 600 W, 2 tanks of 20 m3 capacity, a mast height of 50 m and a total head 30 mins a ratio of 255 W/m3. Figure 9 shows the relationship between the values of LPSP and different system configurations for different total head. At each value of LPSP a game of combination of design variables corresponds. In this part, the types of wind turbines, tank, and mast are set. Analysis of this figure reveals that more total head is greater, more it requires a large number of wind turbines and tanks. In addition, more the value of LPSP is low, more the number of wind turbines and of tanks is high. Table 8 presents the five best solutions of the study well as their characteristics. These solutions satisfy the constraints of the problem and give results that minimize all the objectives defined in terms of three criteria while remaining within the scope of each decision variable. The first solution introduces a LPSP 7.52%. If we decide to cover all water needs (LPSP = 0%), it will use more wind turbines and tanks.
Conclusion
In this paper, we presented an optimization method to find the configuration optimal of a wind pumping system coupled to tanks. This system is designed to cover the water needs of a city of Benin. The components of the pumping sub-system are modeled and validated by simulation that it is not the most appropriate method. The genetic algorithm is used to make system optimization. The design of the pumping system is made according to the concept of the loss power supply probability (LPSP), the concept of the life cycle cost (LCC) and the concept of the life cycle energy of the system (primary energy and CO2 emissions). Different selected criteria are not
the same size, the desirability functions are put to use to solve the problem of scaling. At the end of this study, different candidate solutions are generated and made available to the design. The best solution obtained i.e. that which with the total objective function highest, consists of 17 wind turbines, 2 tanks, all type 1 (see table 1) a 50 m mast and a well pump head 30 m. This solution requires an LCC 38958 dollars, a primary energy of 963380185 kWh and a CO2 emission
1.165.109 with LPSP 7.52%; which corresponds to a ratio of 255 W/m3
REFERENCES
Ai, B., Yang, H., Shen, H., Liao, X. 2003. Computer-aided design of PV/wind hybrid system. Renewable Energy, 28, 1491–1512.
Badescu, V. 2003. Time dependent model of a complex PV water pumping system. Renewable Energy, 28 (4), 543– 560.
Bakelli, Y., Hadj Arab A., Azoui B. 2011. Optimal sizing of photovoltaic pumping system with water tank storage using LPSP concept. Solar energy, Vol. 85, 288-294.
Bernal-Agustίn, J.L., Dufo-López, R., Rivas-Ascaso, D.M., 2006. Design of isolated hybrid systems minimizing costs and pollutant emissions. Renewable Energy, 31, 2227– 2244.
Borowy, B.S., Salameh, Z.M. 1996. Methodology for optimally sizing thecombination of a battery bank and PV array in a wind/PV hybridsystem. IEEE Transactions on Energy Conversion 11, 367–373.
Borrowy, B.S. and Salameh, Z.M. 1997. Methodology for Optimally Sizing the Combination Battery Bank andPV Array in a Wind/PV Hybrid System. IEEE Transaction on Energy Conversion, Vol. 12, N°1, pp. 73 - 78.
Borrowy, B.S., Salameh, Z.M. 1997.Methodology for optimally sizing the combination battery bank and PV array in a wind/PV hybrid system. IEEE Transaction on Energy Conversion, vol. 12, n° 1, pp. 73 - 78.
Bouzidi, B., Malek, A., Haddadi, M. 2006. Rentabilité économique des systèmes de pomp age photovoltaïque.
Revue des Energies Renouvelables, Vol. 9 N°3, 187-197. Clarck R. N., Mulh K. E. 1992. Water pumping for livestock,
wind power proceedings, USA.
Deb K, Pratap A, Agarwal S, Meyarivan T. 2002. A fast and elitist multi-objective Genetic algorithm: NSGA-II. IEEE Transaction on Evolutionary Computation; 6(n.2):182–197. Dehghan, S., Kiani, B., Kazemi, A., Parizad, A. 2009.Optimal Sizing of a hybrid Wind/PV Plant Considering Reliability Indices. World Academy of Sciences, Engineering and Technology, 56.
Derringer, G.1980. Simultaneous optimization of several response variables. JQT, tome 12.
Deshmukh, M.K., Deshmukh, S.S. 2008. Modeling of hybrid
Renewable Energy, systems. Renewable and Sustainable Energy Reviews, 12, 235–249.
Diaf, S., Belhamelb, M., Haddadi, M., Louche, A. 2008a. Technical and economic assessment of hybrid photovoltaic/wind system with battery storage in Corsica Island. Energy Policy, 36, 743–754.
Dufo-López, R., Bernal-Agustίn, J.L., 2008. Multi-objective design of PV–wind–diesel– hydrogen–battery systems.
Renewable Energy, 33,2559–2572.
Ekren, O., Ekren, B.Y. 2010. Size optimization of a PV/wind hybridenergy conversion system with battery storage using simulated annealing. Applied Energy, 87, 592–598.
Hadj Arab, A., Benghanem, M., Gharbi, A., 2005. Dimensionnement de systèmes de pompage photo voltaïque. Ren. Energ., Vol. 8, 19-26.
Hamidat, A., Benyoucef, B., 2008. Mathematic models of photovoltaic motor-pump systems. Renewable Energy, 33 (5), 933–942.
Kaabeche, A., Belhamel, M., Ibtiouen, R., 2010. Sizing optimization ofgrid-independent hybrid photovoltaic/wind power generation system. Energy, 36, 1214–1222.
Kaabeche, A., Belhamel, M., Ibtiouen, R., Moussa, S., Benhadadi, M.R., 2006. Optimisation d’un système hybride (Eolien–Photovoltaïque) totalement autonome. Revue des Energies Renouvelables, 9, 199–209.
Khan , M.J., Iqbal, M.T. 2005. Pre-feasibility study of stand-alone hybrid energy systems for applications in Newfoundland. Renewable Energy, 30: 835-854.
Koutroulis, E., Kolokotsa, D.A. 2006. Potirakis, K. Kalaitzakis, Methodology for optimalsizing of stand-alone photovoltaic/wind-generator. Wind-generator systems using genetic algorithms, Solar Energy.
wind power and wind turbine characteristics. Renewable Energy, 27, 1–12.
Madam, C. 2003. La valorisation des matières plastiques en fin de vie: Etat des lieux et propositions d’amélioration. Mémoire de Diplôme d’Etudes Spécialisées en Gestion de l’Environnement. Université Libre de Bruxelles.
Markvart, T. 1996. Sizing of hybrid PV-wind energy systems.
Solar Energy, 59, 277–281.
Navaeefard, A., Moghaddas Tafreshi,S. M., Mehdi Derafshian Maram, 2010. Distributed Energy Ressources Capacity Determination of a Hybrid Power System in Electricity Market. 25thInternational Power System Conference 10-E-EPM-2163, PSC.
Ofry, E.and Brauntein, A. 1983. The Loss of Power Supply Probability as a Technique for Designing Standalone Solar Electrical (Photovoltaic) Systems. IEEE Transaction on Power Apparatus and Systems, Vol.PAS-102, N°5, pp. 1171 - 1175.
Rajendra, A.P., Natarajan, E. 2006. Optimization of integrated photovoltaic–wind power generation systems with battery storage. Energy, 31 (12), 1943–1954.
Sebastian,P., Quirante, T., Ho Kon Tiat, V., Ledoux, Y. 2010. Multi-objective optimization of the design of two-stage flash evaporators:Part 2. Multi-objective optimization. Sèmassou C., Edah G., Vianou A.2013. Design and
Optimization of a Wind SystemUsing a Genetic Algorithm.
Physical Review & Research International, 3(4): 367-384. Sèmassou C., Guidi C., Prodjinonto V., Galimova V., Vianou
A.2013. Methods of weights definition in multicriteria analysis. Caspian journal: management and high technologies, N°4 (24): 59-73.
Sèmassou, C., Nadeau, J.P., Sebastian P., Pailhès J., Vianou, A.2013. Optimisation multicritère en conception de système photovoltaïque pour des maisons individuelles en contexte africain. Revue des Energies Renouvelables, Vol. 16 N°2 225 – 246.
Thiaux,Y. 2010. Optimisation des profils de consommation pour minimiser les coûtséconomique et énergétique sur cycle de vie des systèmes photovoltaïques autonomes ethybrides. Evaluation du potentiel de la technologie Li-ion. Thèse de doctorat, Ecole Nationale Supérieure de Cachan.
Yang, H., Lu, L., Zhou, W. 2007. A novel optimization sizing model for hybrid solar-wind power generation system.
Solar Energy, 81, 76–84.
Yang, H.X., Burnett, L., Lu, J. 2003. Weather data and probability analysis of hybrid photovoltaic–wind power generation systems in Hong Kong. Renewable Energy, 28, 1813–1824.
Yang, H.X., Zhou, W., Lu, L., Fang, Z.H. 2008. Optimal sizing method for stand-alone hybrid solar–wind system with LPSP technology byusing genetic algorithm. Solar Energy, 82, 354–367.
www.fao.org/ag/againfo/programmes/fr/lead/toolbox/.../1under gw.htm (In formations surle prix d’un forage).
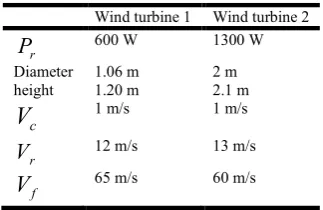
[image:10.595.352.514.326.431.2]Annex: Characteristics of the twoturbines
Table 9.Characteristicsofthetwowind turbine
Wind turbine 1 Wind turbine 2
r
P
600 W 1300 WDiameter 1.06 m 2 m
height 1.20 m 2.1 m
c
V
1 m/s 1 m/sr
V
12 m/s 13 m/sf