EBSD Analysis of Microstructure Evolution of Pure Iron Subjected
to Sliding Wear and Related Change in Vickers Microhardness
Yoshihisa Kaneko
+and Taiyo Sugimoto
Department of Mechanical Engineering, Osaka City University, Osaka 558-8585, Japan
Sliding wear tests were carried on pure iron to investigate evolution of microstructure below worn surface. After the wear tests, grain boundary formation and lattice rotation were analyzed with electron backscatter diffraction (EBSD) method. In the vicinity of the worn surface, submicron grains separated by high-angle grain boundaries were generated. Below the submicron grain region, dominant microstructures were two kinds of low-angle grain boundaries which were horizontal and inclined to the worn surface, respectively. At deeper area from the worn surface, continuous lattice rotation was detected. To correlate the microstructure and strength, Vickers microhardness was measured over a cross section of the wear-affected zone. In the submicron grain and the low-angle grain boundary regions, the microhardness was proportional to the reciprocal square root of boundary spacing. In the lattice rotation region, we calculated geometrically-necessary (GN) dislocation density from gradient of lattice rotation. The microhardness value in the lattice rotation region showed good correlation with the square root of the GN dislocation density. [doi:10.2320/matertrans.MA201301]
(Received August 1, 2013; Accepted October 29, 2013; Published December 6, 2013)
Keywords: wear, iron, ultrafine grained material, electron backscatter diffraction, HallPetch relation, hardness
1. Introduction
A conventional severe plastic deformation (SPD)
tech-nique such as the equal channel angular pressing (ECAP)1,2)
can achieve relatively uniform plastic straining in a bulk material. On the other hand, plastic strain induced by frictional force is non-uniform and localized near the worn surface. When a ductile metallic material is subjected to
frictional force repeatedly, fine grains are generated near
surface.35)The grain refinement during the frictional process
can be attributed to the SPD which occurs locally near surface.
Observations with transmission electron microscopy
(TEM) have shown that shape and size of the generated
grains depended on distance from surface.35)At area distant
from the surface, only dislocation cell structures have been
observed.3) In addition to the grain boundary formations,
large lattice rotation has been detected in the worn copper.3)
Hence, it seems reasonable to investigate both the grain boundary formation and the lattice rotation simultaneously to understand the microstructural evolution process below worn surface. The electron backscatter diffraction (EBSD) is the most suitable method for this purpose.
In our previous EBSD analyses on the worn copper single
crystals,68)the evolutions of low- and high-angle boundaries
and their orientation dependence were argued in terms of the lattice rotation. However, the EBSD analysis cannot evaluate
plastic strain components directly, and thus it was difficult
to consider the grain boundary formation with reference to a local shear mode. In the present study, by measuring an inclination angle of a preexisting boundary, we investigated the relationship between the local shear mode and the low-angle boundary formation which corresponds to the initial
stage of the grain refinement.
In accordance with the HallPetch relation strength of
metallic materials increases with decreasing grain size, and
hence the SPD is a promising process to obtain high-strength
materials.911) Also for the surface friction, improvement
of surface strength is expected. In recent studies on the friction stir processing (FSP), it has been reported that the
hardness1214) and strength15,16) certainly changed as a
function of the distance from a rotation center. However, since the FSP involves quite large surface deformation and heat production, complicated microstructures such as
ther-momechanically-affected zone (TMAZ)17) are generated.
Such complicated microstructural evolution would eliminate
signatures produced during an initial stage of grain refi
ne-ment, and thus detailed mechanisms for the grain refinement
and related strengthening are still unclear. In the present study, we imposed relatively moderate friction on iron plates to simplify microstructures. Then, microhardness was measured at the various microstructures formed below the worn surface. Particularly, we paid attention to the effect of grain size and dislocation density on the microhardness.
2. Experimental Procedure
2.1 Sliding wear test
Pure iron plates of 99.99 mass% purity were cut into
30©30©2 mm3 shape, and then annealed in vacuum at
1223 K for 1 h. A resultant average grain size was approximately 100 µm. Specimen surfaces were polished mechanically and electrolytically. The electrolytic polishing was conducted at 288 K at 21 V, in the solution consisting of
60% perchloric acid and acetic acid, mixed at the ratio of
1 : 9.
Sliding wear tests were carried out in a pin-on-disk type apparatus (Fig. 1) at room temperature. A SUJ2 steel pin of 5 mm diameter was set at the specimen surface. Static load of 10 N was applied to the pin along axial direction. The specimen was fastened at the rotating table. By rotating the specimen, we could form a circular wear track on the surface.
Wear velocity was set at 10 mm/s. The sliding wear tests
were interrupted at 50 rotation cycles.
+Corresponding author, E-mail: kaneko@imat.eng.osaka-cu.ac.jp
2.2 Microstructural observation
After the sliding wear tests, the specimens were cut along a tangential line of the circular wear track (i.e., along a dotted line in Fig. 1(a)) to obtain a cross section. Before the cross sectioning, the worn surface was electrodeposited with iron to protect microstructures generated near the worn surface. The cross sections were elecrolytically polished. Wear-affected zone below the worn surface was observed with the JEOL JSM-6500F scanning electron microscope (SEM).
The grain refinement and lattice rotation in the wear-affected
zone were analyzed by the EBSD technique with the EDAX-OIM system.
2.3 Vickers microhardness measurement
To correlate strength with the microstructures produced below the worn surface, Vickers microhardness was measured over the cross section. The Vickers microhardness
test was carried out with Shimadzu DUH-201 at the indentation force of 4.9 mN. A shape of the resultant indentation was measured with the SEM, and the microhard-ness value was calculated from diagonal line lengths of each indentation.
3. Results and Discussion
3.1 Microstructure
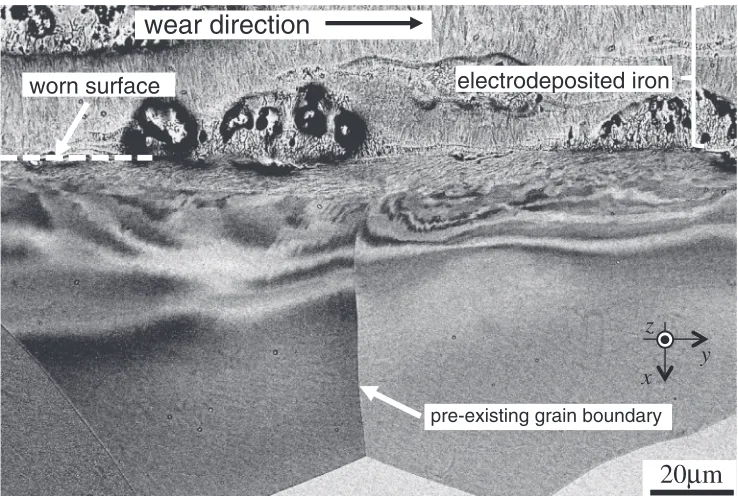
Figure 2 is a backscattered electron (BSE) image showing wear-affected zone of the worn iron. In this photograph, the sliding wear direction is from left to right-hand side. In addition to subsurface microstructure produced by the sliding wear, some large grains are visible. These are the grains which preexisted at the as-annealed samples. The preexisting grain boundaries were basically straight before wear test, and hence the grain boundary inclination seen in Fig. 2 is attributed to the sliding wear.
It is confirmed that the microstructure produced by the
[image:2.595.52.292.289.476.2]sliding wear depends on distance from the worn surface. Figure 3 shows enlarged images of typical microstructures at different depths. In the vicinity of the worn surface, elongated grains with submicron widths are recognized. The elongation directions are nearly parallel to the worn surface. Below the submicron grain region, the BSE images of microstructures can be grouped roughly into three types, i.e., inclined layered structure, horizontal layered structure, and lattice rotation structure. In Fig. 3(b), the layered microstructure parallel to the preexisting grain boundary is seen. The inclined layered microstructure is not always observed at cross sections of the worn irons. Figure 3(c) shows the other kind of layered structure which is horizontal to the worn surface. This layered structure is always observed below the submicron grain region. Below these layered structures, the BSE intensity changes gradually as shown in Fig. 3(d). In this region, no appreciable boundary is found. The change in the BSE Pin
wear track iron plate
rotation
12mm
φ
(a) sliding wear test (b) cross sectioning
vertical load
wear-affected zone
x y z
x y z
EBSD analysis
30mm
30mm
2mm
Fig. 1 Schematic illustrations of (a) an iron specimen with circular wear track and (b) the position of cross sectioning.
20
μ
m
electrodeposited iron
wear direction
worn surface
pre-existing grain boundary
x
y
z
[image:2.595.114.483.522.770.2]intensity would be due to continuous lattice rotation. Below the lattice rotation region, microstructure evolution is no longer observed.
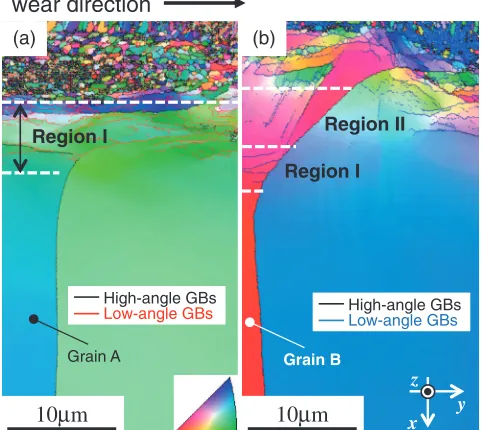
Figure 4 shows typical inverse pole figure (IPF) maps of
cross sections of the worn irons. Both high-angle and angle boundaries are indicated in the maps. The drawn low-angle boundaries are limited to misorientation low-angles from 2 to 15°. Because we paid attention to the boundary inclination in the present study, the analyzed areas were selected so as to contain a single preexisting boundary which was perpendic-ular to surface. Because of the local SPD, the quality of the EBSD analysis was relatively poor at the submicron grain region. But, it is still recognized that the submicron grain regions contain a lot of high-angle grain boundaries. Fraction
of the high-angle boundaries amounts to approximately 70%
of all the grain boundaries.
Below the submicron grain regions, there are low-angle grain boundaries which are arranged parallel to each other.
Collectives of the parallel low-angle boundaries can be
classified into two types. One is the boundaries formed
horizontal to the worn surface (Region I in Figs. 4(a) and 4(b)). The other type is the boundaries almost parallel to the preexisting boundary inclined (Region II in Fig. 4(b)). The BSE images of Figs. 3(b) and 3(c) correspond to these two regions, respectively. Below the low-angle boundary region, the IPF maps reveal continuous lattice rotations. From the stacked microstructures seen in Figs. 2 and 4, it is deduced that the evolution of the submicron grains should have been preceded by the stage of the low-angle boundary formation and the lattice rotation.
To correlate the low-angle boundary formation with local shear deformation, we investigated the lattice rotation in conjunction with the grain boundary inclination. Figure 5
shows the lattice rotation anglesºand the inclination angles
¡ of the preexisting grain boundaries, which are measured
from Fig. 4. The rotation angle º is a misorientation angle
from a deeper position of corresponding matrix grain. The
rotation angles º are calculated in the Grains A and B in
Fig. 4 along curved lines which are 0.5 µm distant from the respective preexisting boundaries. At deeper areas, the
rotation angles º are zero. With decreasing distance from
worn surface, the rotation angles º of both grains increase
rapidly. The increases in rotation angle continue up tox=9
and 8 µm in Grains A and B, respectively. These positions coincide roughly with the uppermost part of Region I. Beyond these positions, the rotation angles no longer increased in such a rapid rate.
An inclination angle ¡shown in Fig. 5 is measured as an
angular difference between an inclined boundary and an original line of a preexisting boundary which is assumed
straight before a wear test. The inclination angles¡are zero
at the deeper areas and increase with decreasing depth from surface in both grains. It should be noted that the grain
wear direction
10
μ
m
Region I (a)Grain A
High-angle GBs
Low-angle GBs
(b)
Region I
10
μ
m
Region II
Grain B
High-angle GBs
Low-angle GBs
x y z
Fig. 4 IPF maps of wear-affected zones, where a vertical grain boundary existed before each wear test. Regions I and II contain low-angle boundaries which are parallel and inclined to the worn surface, respectively.
5
μ
m
(a)
(b)
(c)
(d)
5
μ
m
5
μ
m
2
μ
m
pre-existing GB
x
y
z
[image:3.595.77.262.70.497.2] [image:3.595.307.549.75.290.2]boundary inclination angles ¡are almost equal to the lattice
rotation angleº, up to the uppermost part of Region I in both
grains. However, in Region II of Grain B, the inclination
angle¡was significantly deviated from the rotation angleº.
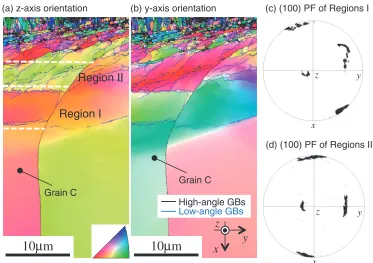
IPF maps of another cross section and (100) polefigure of
Regions I and II of Grain C are shown in Fig. 6. In addition to the orientations viewed from the cross-section normal
(i.e.,z-axis), the orientations viewed fromy-axis are mapped.
Like Grain B of Fig. 4(b), Grain C includes the low-angle boundary regions consisting of Regions I and II. From the
(100) pole figures, the lattice rotation occurred around the
z-axis in both regions. In they-axis IPF map (Fig. 6(b)), two
large orientation changes are detectable at the horizontal boundaries in Region I. From this orientation changes, it is found that the subgrains in Region I were rotated around one rotational direction. In contrast, the orientation rotations in Region II were identical between right- and left-hand sides
at both the z-axis and y-axis IPF maps, although several
inclined boundaries were certainly present. It is reasonable to consider that Region II contained two kinds of the inclined low-angle boundaries which can induce positive and negative
rotation around the z-axis.
5 10 15 20 25 30 0 5 10 15 20 25 30
0° 20° 40° 60° 80°
Rotation angle, GB inclination,
Depth from Surface, x /μm
Angle,
φ
α
,
(a) Grain A (b) Grain B
Region I Region II
Region I
φ α
Fig. 5 Rotation angleºfrom a matrix grain and grain boundary inclination angle¡in the Grains A and B of Fig. 4.
(a) z-axis orientation (b) y-axis orientation
High-angle GBs
Low-angle GBs
10
μ
m
10
μ
m
x
y
z
Region I
Region II
Grain C
Grain C
(c) (100) PF of Regions I
(d) (100) PF of Regions II
x
z y
x
z y
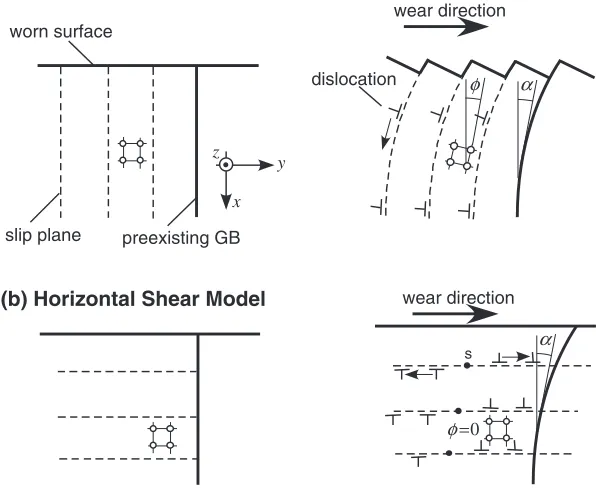
[image:4.595.117.481.71.298.2] [image:4.595.111.484.341.604.2]To consider the low-angle boundary formations in terms of the lattice rotation and the grain boundary inclination, we proposed two simple deformation models differing in shear direction, as illustrated in Fig. 7. In the vertical shear model, it is assumed that the wear process induces shear deformation along slip planes vertical to the worn surface. Edge dislocations are emitted from the worn surface, and eventually they give rise to lattice rotation below the surface.
The stored dislocations can behave as the GN dislocations.18)
Hence, the observed lattice rotations at the deeper part could be understood by the vertical shear model. In this model, the preexisting boundary would be inclined as a neighboring lattice is sheared towards the vertical direction:
in ideal case the inclination angle ¡is equal to the rotation
angle º. Indeed, as seen in Fig. 5, the angles ¡ and º are
roughly identical at Region I and the lattice rotation region. The introduced edge dislocations can rearrange in the form of the polygonization. Since the Burgers vector is parallel to the worn surface normal, the low-angle boundaries horizontal to the worn surface should appear. This formation of the low-angle boundaries horizontal to the surface has been discussed also in the copper single crystal subjected to
sliding wear.7)
In the horizontal shear model, glides of dislocations occur along slip planes which are horizontal to the worn surface. The inclination of the preexisting boundary is caused by simple shear towards the wear direction. If dislocation pile up at the preexisting boundary is ignored, no lattice rotation is anticipated. Hence, the discrepancy between rotation angle
º and the inclination angle ¡ must exist. Let us consider
the deformation characteristics in Region II of Grain B
(Fig. 4(b)). In this region, the rotation angle º was roughly
constant and apparently smaller than the inclination angle¡,
as shown in Fig. 5(b). This result is consistent with the horizontal shear model.
It is assumed that the edge dislocations of opposite signs are multiplied from dislocation sources in the horizontal shear model. One can expect that polygonization of these dislocations possibly occur when dislocation density
in-creased sufficiently. Because the dislocations of opposite
Burgers vector signs are emitted, the polygonization can produce two kinds of low-angle boundaries where the dislocations with the positive and negative signs are dominantly included. The low-angle boundaries give rise to lattice rotation at a neighboring subgrain. The lattice rotation depends on the sign of the included dislocations: the rotation direction of the positive dislocation boundary is opposite to that of the negative dislocation boundary. Hence, net lattice rotation would be reduced at the collective of the positive and negative dislocation boundaries. This idea is compatible with the fact that the orientation of Region II in Grain C was unchanged as shown in Fig. 6(b). As a consequence, the inclined low-angle boundaries observed at Region II could be understood by the horizontal shear deformation.
3.2 Vickers microhardness
In the present study, the Vickers microhardness was measured at very low indentation force of 4.9 mN, at which a resultant indentation size is of a few micrometer. This is because the thickness of the wear-affected zone was typically less than 50 µm, within which the microstructure dependence of hardness is unable to be estimated under a conventional indentation force. It should be noted that hardness value usually depends on the indentation force. This is known
as the indentation size effect (ISE).19,20) This dependence
usually follows a power-law relation, which is sometime
referred to as Meyer’s law. In order to determine the proper
treatment of a hardness value at 4.9 mN, wefirst investigated
indentation-force dependence of the microhardness, as shown in Fig. 8. The sample used was an as-annealed iron plate. It is
wear direction worn surface
slip plane preexisting GB
wear direction
α
φ=0 (b) Horizontal Shear Model
α
dislocation φ
(a) Vertical Shear Model
s x
y z
[image:5.595.149.447.85.329.2]confirmed that the microhardness value decreases as a negative power function of the indentation force. The
microhardness at the indentation force P=4.9 mN was
Hv144. In a pure iron with 100 µm average grain size, the lower-yield stress was approximately 100 MPa at strain
rate of 10¹3s¹1.21) Hence, the microhardness of Hv144 is
apparently overestimated, assuming that the yield stress is three times higher than the Hv value. As long as the relation between microhardness (Hv144) and the yield stress
(100 MPa) holds at P=4.9 mN, it is deduced that a
microhardness value (Hv) measured atP=4.9 mN is higher
than yield stress value (MPa) of corresponding position by a factor of 1.5.
The microhardness values of the worn iron were measured over a polished cross section, inside a single preexisting grain. Figure 9 shows typical shapes of indentations which were put at the different microstructures under the same
applied force (P=4.9 mN). The indentation size at the
submicron grain region was certainly small, in comparison with the others. Figure 10 is the relationship between the Vickers microhardness and the depth from surface. The microhardness increases with decreasing depth from the worn surface.
For the aluminum processed by accumulated roll bonding
(ARB), Kamikawa et al. has suggested that low-angle
dislocation boundaries with misorientation angles above 2
3° act as conventional grain boundaries in terms of strength
contribution.22)Hence, the role of the low-angle boundaries
on microhardness should be argued also in the present worn iron. To show grain-size dependence of the microhardness, boundary spacing in both the submicron grain and the low-angle boundary regions were measured from the correspond-ing IPF map, which was obtained prior to the microhardness tests. In the submicron grain region, a grain width vertical to each elongated direction is taken as the boundary spacing. For the low-angle boundary region, a distance between adjoining parallel boundaries is simply taken as the boundary spacing. For each indentation point, we averaged the boundary spacings existing within 2 µm distance. It should be noted that both the high- and low-angle boundaries are counted for the averaging. Figure 11 is the Vickers hardness plotted against the boundary spacing. The
micro-hardness increases linearly with increasing d¹1/2 value (i.e.,
the reciprocal square root of the boundary spacing) for both
the submicron grain and the low-angle boundary regions: the
microhardness was in accordance with the HallPetch type
relation (·=·0+kd¹1/2). It should be emphasized that
data points of both the submicron grain and the low-angle boundary regions are on the single line. Hence, it can be
said that the low-angle boundarieswhose misorientation
angles exceed 2°have the same impact on strengthening
as the high-angle boundaries. This agrees well with the above-mentioned low-angle dislocation boundary
strengthen-ing in the ARB aluminum.22)
The occurrence of the lattice rotation shown in Figs. 46
can be explained by uniform distribution of the GN dislocations. By utilizing the EBSD technique, we can
Indentation Force, P /mN
10 100
V
ick
ers Micr
ohardness, Hv
0 20 40 60 80 100 120 140 160
Fig. 8 Dependence of Vickers microhardness on indentation force measured at an as-annealed iron plate.
Depth from Surface, x /μμm
0 10 20 30 40 50
V
ick
ers Micr
ohardness, Hv
[image:6.595.358.494.68.395.2]0 100 200 300 400 500
Fig. 10 Vickers microhardness measured over a cross section of the worn iron. The indentation force wasP=4.9 mN.
(a)
(b)
(c)
1μm
1μm
1μm
[image:6.595.77.265.70.208.2] [image:6.595.333.518.447.587.2]evaluate the GN dislocation density µGN by the following
equation.18)
µGN¼1bdd£xxy 1bddºx ð1Þ
where b is the Burgers vector and dº/dxis the gradient of
rotation angle. Figure 12 presents the rotation angleºand its
gradient dº/dxcalculated along a line which is perpendicular
to the worn surface. After the EBSD analysis, the micro-hardness measurements were carried out along the line. We
calculated the gradient dº/dx by liner curve-fitting of the
rotation angle data which are divided at every 5 µm depth.
The curve fitting was conducted for the depths where the
rotation angle increased monotonically. Since the positive
direction of the x-axis is set toward the depth direction, the
rotation gradient dº/dx is calculated to be negative. The
absolute value of the gradient dº/dxgradually increased with
decreasing depth as shown in Fig. 12.
Figure 13 is the Vickers microhardness in the lattice rotation region, plotted against the GN dislocation density
which is estimated from the rotation gradient dº/dx. The
microhardness seems to increase as a function of the square
root of the GN dislocation densitypffiffiffiffiffiffiffiffiµGN: the microhardness
in the lattice rotation region appears to follow the usual
dislocation hardening rule23)given by
¸f ¼c®bpffiffiffiffiµt ð2Þ
where ¸f is the flow stress, c is a geometrical constant
(c³0.10.4), ® is the shear modulus and µt is the total
dislocation density.
At the lowermost part of the low-angle grain boundary region, the microhardness was almost identical to that at the uppermost part of the lattice rotation region (see Figs. 9 and 11). Let us consider the strength at the lowermost part of the low-angle boundary region, from the viewpoint of the dislocation hardening. A low-angle tilt boundary is expressed
as an edge dislocation array whose spacing is h=b/ªLA,
whereªLAis the misorientation angle of the boundary. Hence,
the layered low-angle boundary structure can be regarded as a
kind of forest dislocations. The average densityµLAof these
dislocations can be given simply byµLA=ªLA/bdLA, where
dLAis the average spacing between the low-angle boundaries.
From the EBSD analysis, the average misorientation and the
average boundary spacing were determined asªLA=7.5° and
dLA=2 µm. As a result, the calculated dislocation density is
µLA=2.73©1014m¹2. This value is almost equal to the GN
dislocation density plotted at the uppermost part of the lattice
rotation region (µGN=2.59©1014m¹2). Hence, it is
reason-able to consider that the low-angle boundaries can contribute to strengthening in the same manner as forest dislocations.
Dislocations stored during a plastic work can be classified
into the GN dislocations and the statistically-stored (SS)
dislocations.17) Because inducing no significant strain
gradient, the SS dislocations are normally difficult to be
detected with a conventional EBSD technique. If we assume that the deformation in the lattice rotation region occurs only in the manner of the proposed vertical shear model (Fig. 7(a)), all the dislocations stored in the lattice rotation region should have the character of the GN dislocation which is supplied from the worn surface. To understand the con-tribution of the GN dislocations to the strength, we estimated
the flow stress from the calculated GN dislocation density.
By substituting ®=84.7 GPa, b=0.2482 nm, µt=µGN=
2.59©1014m¹2 into eq. (2), we obtain the flow stress of
(Boudary Spacing)-1/2, d-1/2 / μm-1/2
0.7 0.8 0.9 1.0 1.1 1.2
V
ick
ers Micr
ohardness, Hv
100 200 300 400 500
Submicron grain region Low-angle GB region
0.7 1.0
1.5
[image:7.595.67.274.74.238.2]Boudary Spacing, d / μm 2.0
Fig. 11 Vickers microhardness measured at the submicron grain and the low-angle boundary regions, plotted against the reciprocal square root of boundary spacing.
0 10 20 30 40 50 60
0°
10°
20°
30°
40°
50°
60°
-70 -60 -50 -40 -30 -20 -10 0
Depth from Surface, x /μm
Rotation
Angle fr
om Matrix,
φ
Gradient, d
φ
/d
x
/ rad mm
-1
gradient dφ /dx
[image:7.595.321.527.74.240.2]rotation angle φ
Fig. 12 Rotation angleºfrom a matrix grain and its gradient dº/dx, which were measured along a line where the microhardness test had been conducted after the EBSD analysis.
0.0 0.2 0.4 0.6 0.8 1.0 1.2 1.4 1.6 1.8
V
ick
ers Micr
o
hardness, Hv
100 120 140 160 180 200 220 240
Square Root of the GN Dislocation Density, /GN x107 m-1 10 50 100 150 200 250 300 GN Dislocation Density, ρGN /x1012 m-2
[image:7.595.63.277.305.451.2]ρ
·f=93372 MPa, assuming that Taylor factor is M=2.75
for bcc polycrystal.24)
From the indentation force dependence of the microhard-ness (Fig. 7), it is deduced that the microhardmicrohard-ness measured
atP=4.9 mN is approximately 1.5 times higher than a yield
stress (MPa). Thus, at the uppermost part of the lattice rotation region, the yield stress estimated from the
micro-hardness (Hv199) is·y=133 MPa. This stress is in the range
of theflow stress (·f=93372 MPa) estimated from the GN
dislocation density. Kehet al.25)has reported the relationship
between flow stress and dislocation density in iron.
According to their relation, the dislocation density required
for·f=133 MPa is estimated to beµ=2.3©1014m¹2. This
value is comparable with the GN dislocation density at the uppermost part of the lattice rotation region. Accordingly, it is plausible that the increase in microhardness at the lattice rotation region was attributed mainly to the GN dislocations supplied from surface.
4. Summary
(1) The wear-affected zone below surface of the iron subjected to sliding wear was composed of the different regions stacked. In the close vicinity of the worn surface, the submicron grain structure with the elongated grains was generated. Below the submicron grain region, two kinds of the layered low-angle boundaries, which were horizontal and inclined to the worn surface, were recognized. At deeper area from surface, the continuous lattice rotation was detected. (2) The formations of the low-angle boundaries were
argued from the relationship between the lattice rotation angle and the inclination angle of the preexisting grain boundary. In the region where the low-angle boundaries arranged horizontal to surface, the lattice rotation angle was almost identical to the inclination angle of a preexisting grain boundary. It was hence proposed that the horizontal low-angle boundaries resulted from the rearrangement of dislocations coming from the worn surface. In contrast, near the inclined low-angle boundaries, the lattice rotation angle was deviated
significantly from the inclination angle. The formation
of the inclined low-angle boundaries was explained from the shear deformation horizontal to surface. (3) At the submicron grain and the low-angle boundary
regions, the boundary spacing d were measured by
taking account of both the high and low-angle boundaries. The Vickers microhardness at both regions
increased with increasing d¹1/2 value. It was expected
that the low-angle boundaries could act as the high-angle boundaries for strengthening.
(4) From the gradient of the lattice rotation angle, the change in the GN dislocation density was investigated for the lattice rotation region. The microhardness revealed the good correlation with the square root of the GN dislocation density.
Acknowledgments
This study was financially supported by the Grant-in-Aid
for Scientific Research on Innovative Areas “Bulk
nano-structured metals” through MEXT Japan under contract
No. 22102006, and by that on Challenging Exploratory Research through JSPS under contract No. 24656091.
REFERENCES
1) V. M. Segal:Mater. Sci. Eng. A197(1995) 157164.
2) R. Z. Valiev, R. K. Islamgaliev and I. V. Alexandrov:Prog. Mater. Sci.
45(2000) 103189.
3) P. Heilmann, J. Don, T. C. Sun, W. A. Glaeser and D. A. Rigney:Wear
91(1983) 171190.
4) D. A. Rigney, M. G. S. Naylor, R. Divakar and L. K. Ives:Mater. Sci. Eng.81(1986) 409425.
5) D. A. Hughes, D. B. Dawson, J. S. Korellis and L. I. Weingarten:
J. Mater. Eng. Perfom.3(1994) 459475.
6) Y. Iwahashi, Z. Horita, M. Nemoto and T. G. Langdon:Acta Mater.45
(1997) 47334741.
7) Y. Ohno, J. Inotani, Y. Kaneko and S. Hashimoto:J. Japan Inst. Metals
72(2008) 625630.
8) Y. Ohno, J. Inotani, Y. Kaneko and S. Hashimoto:J. Japan Inst. Metals
73(2009) 924929.
9) Y. Ohno, J. Inotani, Y. Kaneko and S. Hashimoto:J. Japan Inst. Metals
74(2010) 384391.
10) D. G. Morris:Nanostructured Metals and Alloys, ed. by S. H. Whang, (Wood Head Publishing, Cambridge, 2011) pp. 299328.
11) Y. M. Wang and E. Ma:Bulk Nanostructured Materials, ed. by M. J. Zehetbauer and Y. T. Zhu, (Wiley-VCH, Weinheim, 2009) pp. 425 453.
12) Y. Estrin and A. Vinogradov:Acta Mater.61(2013) 782817.
13) Y. S. Sato, H. Kokawa, M. Enomoto and S. Jogan: Metall. Mater. Trans. A30(1999) 24292437.
14) Y. S. Sato and H. Kokawa: Metall. Trans. A32(2001) 30233031. 15) Y.-J. Kwon, I. Shigematsu and N. Saito:Mater. Trans.44(2003) 1343
1350.
16) Y. S. Sato, S. H. C. Park and H. Kokawa: Metall. Trans. A32(2001) 30333042.
17) R. S. Mishra and Z. Y. Ma:Mater. Sci. Eng. R50(2005) 178.
18) M. F. Ashby:Philos. Mag.21(1970) 399424.
19) C. Hays and E. G. Kendall:Metallography6(1973) 275282.
20) H. Li and R. C. Bradt:J. Mater. Sci.28(1993) 917926.
21) J. Harding:Acta Metall.17(1969) 949958.
22) N. Kamikawa, X. Huang, N. Tsuji and N. Hansen:Acta Mater. 57
(2009) 41984208.
23) H. Mughrabi, K. Herz and X. Stark:Int. J. Fract.17(1981) 193220.
24) J. W. Hutchinson:J. Mech. Phys. Solids12(1964) 2533.