Munich Personal RePEc Archive
Industry Wage Differentials and Working
Conditions in Turkey: A Brief Note
Polat, Sezgin
Galatasaray University, GIAM
15 August 2016
Online at
https://mpra.ub.uni-muenchen.de/73230/
Industry Wage Differentials and Working
Conditions in Turkey: A Brief Note
Sezgin Polat
*GIAM / Galatasaray University, Department of Economics
This version, August 2016
Abstract
In this article, we test the compensating wage differentials hypothesis for the man-ufacturing industry using official industrial accident figures provided by the Ministry of Labor and Social Security and wage data for the 2009-2014 Household Labor Force Surveys. First, we estimate a standard hedonic wage equation for the fatal and injury risk at the industrial level. After controlling for industry effects, the positive injury risk compensation disappears and becomes insignificant while the fatal risk premium reverses its sign from positive to negative. For an alternative estimation, we also used a two-step procedure by regressing industry wage differentials on working conditions including accident risk and several industry-specific averages. The results show, con-trary to the compensating wage differentials hypothesis, that poor working conditions (higher fatal risk, longer working hours and high turn-over rate) are associated with lower wage compensation at the industry level. Our findings reveal a segmented labor market where low pay sectors are characterized by poor working conditions.
Keywords: Hedonic Wages; Wage Differentials; Working Hours; Work Accident; Fatal Risk; Turkey
JEL Codes: J31; J81; J28
1
Introduction
The theory of equalizing differences suggests that, among other factors, wage differentials should reflect the work environment and working conditions Rosen (1986). Hard or poor
*Galatasaray University, Department of Economics. Ciragan Cad. No: 36, Ortakoy 34349,
conditions are generally associated with dangerous jobs, working environments where workers are more exposed to accident risks or jobs that require overtime and longer hours. In this study, we test the hypothesis of compensating wage differentials for the case of Turkey, using pooled cross-section data (2009-2014) from Household Labor Force Surveys (HLFS).
There are very few studies which directly deal with wage compensation and working conditions in Turkey. The higher incidence of fatal work accidents are documented in Toks¨oz (2008) and OECD (2006)1, while Messenger (2011) reports that, among European
countries, Turkey is an exceptional case in that low wages and longer hours are correlated. In developing countries, weak regulations and institutions worsen working conditions (e.g poorer work safety and more accidents), particularly in rapidly growing sectors facing global competition H¨am¨al¨ainen (2009), although poor working conditions also undermine productivity. 2 Finally, Turkey scores the highest level of subjective work intensity among
European countries, (Eurofound, 2012).
The structure of the paper is as follows. We briefly present the data before introducing the basic hedonic OLS model using industry-wide injury and fatality risk in the second section. Because the OLS estimates with and without industry controls show inconsistent results, we limit the framework to identifying the interaction effects of other factors. Using a two-step strategy which allows for multi-level estimation, we next regress industry wage differentials on working conditions proxies, including accident risks and factors like longer work hours. Our results suggest that wage differentials do not reflect wage compensation for industry-specific characteristics, which include long hours, poor work safety and high job-turnover rates. These findings support the labor market segmentation thesis, which is more relevant than the compensating wage differential theory in the context of developing countries.
2
Data and Estimation Strategy
For wage regressions, Turkey’s Household Labor Force Surveys (HLFS) provide detailed information on wages and work characteristics. In order to estimate the wage premium related to unsafe work, we obtained accident rates from the official industrial accident figures provided by Turkey’s Ministry of Labor and Social Security (MLSS). The MLSS’s
1Turkey ranks highest among OECD countries in terms of fatality and injury incidence.
2Messenger et al. (2007, p.123) argue that, in developing countries, ”the relationship between working
industry classification, which is compatible with HLFS, has broad coverage including 24 sub-sectors of manufacturing industry (Nace, rev. 2). The accident figures include only formally employed wage-earning workers who are subject to social security coverage (un-der Article 4-1/a of Act 5510).3 The total number of workers corresponding to each
sec-tor were obtained from the MLSS while we calculated per worker figures according to the number of registered workers in each industry.4 Pooled cross-sectional wage data for
2009-2014 are restricted to formal workers with social security coverage (Article 4-1/a). The standard hedonic wage model Eq. (1) estimated in this study combines the usual wage equation with a compensation factor (taste) for the risk to wage earners associated with each specific industry.
ln(wijt) =α+β1Xijt+β2Hjt+γpjt+εijt (1)
In Eq. (1),wijt denotes the log real hourly wage expressed in 2014 prices of individual
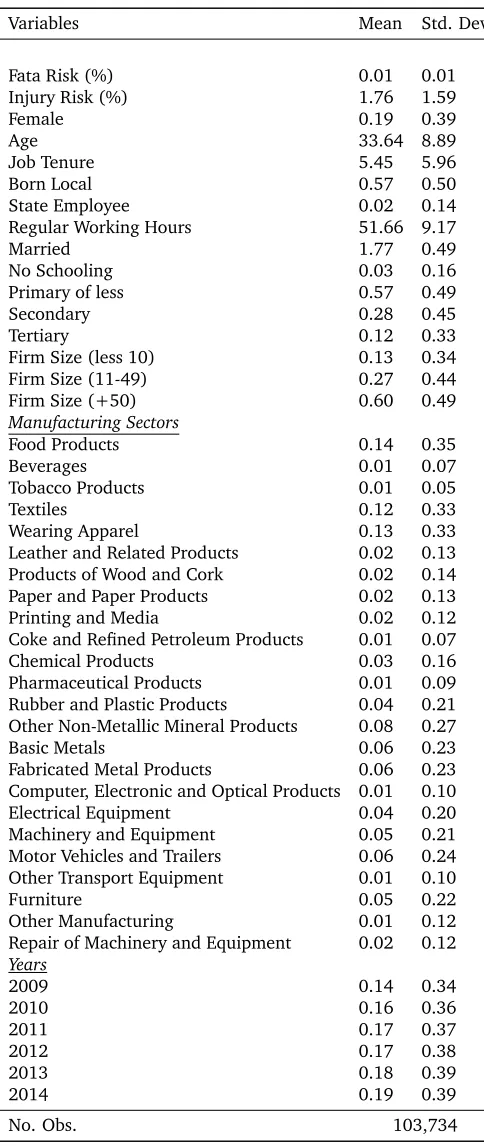
iin sub-sectorjin yeart. X is a set of individual covariates including gender, education (4 categories), age, age squared, tenure and its square, marital status, born local, state em-ployee, firm size (3 categories), occupation (9 categories), year and region(12, NUTS1) dummies. H indicates the industry effects(24 manufacturing sectors, Nace rev.2) γ1 de-notes the compensation associated with the industry specific fatality or injury risk for a given year, pjt. ε is the error term. Table 1 gives a brief description of data that will be
used in regressions.
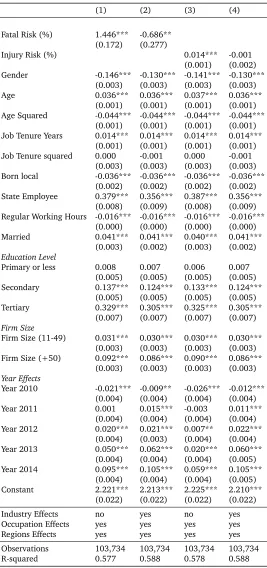
Table 2 presents the results from the hedonic wage model. The basic coefficients of the wage regression have the expected signs. Hourly wages increase with completed ed-ucation level, age and tenure. Female and single workers earn less than other categories. Controlling for industry effects modifies the previously significant positive coefficients of remuneration for fatality and injury risks in model specifications (Table2, columns 1 and 3), becoming insignificant for injury risk while the sign for fatal risk reverses to negative (Table 2, columns 2 and 4). However, the coefficients for the other variables do not change sign or lose their statistical significance.5 We therefore need to address these inconsistent
results for risk compensation since they indicate a multicollinearity problem reported by
3It is a legal obligation in Turkey for firms to report work accidents.
4For developing economies, ignoring the amount of informal employment and the importance
self-employment biases the true accident cases in each sector. H¨am¨al¨ainen et al. (2009) argue that the global figures provided by the ILO underestimate the true level of accidents.
5Returns to education decrease slightly after controlling for industry effects, which show some selection
Table 1: Brief Descriptive Statistics
Variables Mean Std. Dev.
Fata Risk (%) 0.01 0.01
Injury Risk (%) 1.76 1.59
Female 0.19 0.39
Age 33.64 8.89
Job Tenure 5.45 5.96
Born Local 0.57 0.50
State Employee 0.02 0.14
Regular Working Hours 51.66 9.17
Married 1.77 0.49
No Schooling 0.03 0.16
Primary of less 0.57 0.49
Secondary 0.28 0.45
Tertiary 0.12 0.33
Firm Size (less 10) 0.13 0.34
Firm Size (11-49) 0.27 0.44
Firm Size (+50) 0.60 0.49
Manufacturing Sectors
Food Products 0.14 0.35
Beverages 0.01 0.07
Tobacco Products 0.01 0.05
Textiles 0.12 0.33
Wearing Apparel 0.13 0.33
Leather and Related Products 0.02 0.13
Products of Wood and Cork 0.02 0.14
Paper and Paper Products 0.02 0.13
Printing and Media 0.02 0.12
Coke and Refined Petroleum Products 0.01 0.07
Chemical Products 0.03 0.16
Pharmaceutical Products 0.01 0.09
Rubber and Plastic Products 0.04 0.21 Other Non-Metallic Mineral Products 0.08 0.27
Basic Metals 0.06 0.23
Fabricated Metal Products 0.06 0.23
Computer, Electronic and Optical Products 0.01 0.10
Electrical Equipment 0.04 0.20
Machinery and Equipment 0.05 0.21
Motor Vehicles and Trailers 0.06 0.24
Other Transport Equipment 0.01 0.10
Furniture 0.05 0.22
Other Manufacturing 0.01 0.12
Repair of Machinery and Equipment 0.02 0.12
Years
2009 0.14 0.34
2010 0.16 0.36
2011 0.17 0.37
2012 0.17 0.38
2013 0.18 0.39
2014 0.19 0.39
No. Obs. 103,734
Accidents cases and number of insured workers are provided from Ministry of Labor and Social Security numbers conform the criteria under the article 4-1/a of Act 5510.
earlier studies like Hintermann et al. (2010) and Viscusi and Aldy (2003). It is hard to dis-tinguish the premium associated with a specific industry and the risk compensation related to a particular job. By using few industry dummies, Leigh (1995) finds that risk variables and inter-industry differentials are correlated. He concludes that the data is insufficient to produce accurate estimates of risk compensation. One possible solution to this problem, proposed by Kochi (2011), is to use more detailed risk data, which would help isolate spe-cific accident rates by including comprehensive occupation-industry pairs. However, it is not always possible to obtain a breakdown matching specific industry-occupation pairs for every country. In Turkey’s case, Polat (2014) argues that gender-specific industry controls do not undermine the results for 2010 and 2011. While injury risk is not positively com-pensated, fatality risk has a negative compensation for the manufacturing industry. Thus, it seems that OLS estimates are not conclusive enough to explain why inter-industry wage differentials fail to reflect unsafe working conditions and omitted variable bias can not be addressed within this framework.
Eq. 1 estimates a labor supply model that, because it treats accident risks as uniform within each industry, suffers from endogeneity bias (Hwang et al., 1992) and lacks indica-tors to measure poor working conditions and production technology (Brown, 1980). The first bias is unavoidable and can not be eliminated without an indicator capable of measur-ing workers’ abilities or preferences. The second bias is primarily due to industry specific effects that could be controlled using various indicators.6 However, besides these two bi-ases, the institutional and regulatory constraints that are crucial for safer technology are supposed to be neutral in this setting. A number of studies help highlight the role of the institutional setting in determining the safety of working conditions. For instance, reduced unionization (Kim and Fishback, 1999) and changes in liability rules (Kim and Fishback, 1999) both affect the size of compensating differentials. Morantz (2011) finds that, for the mining industry, unionization leads to more frequent inspections and potential fines for safety violations.
From the firms’ perspective, when costly safety measures are adopted, the risk premium is reduced by the preventive technology. Assuming that accident risks can be eliminated by investing in safer technology, the trade-off between capital and risk would imply that less productive firms would hire workers willing to accept the associated risks. In this case, however, the cost of introducing safer technology and the premium associated with the risk undertaken by the workers should be equal. The equilibrium price would reinforce that
Table 2: Hedonic Wage Regressions for Pooled Cross-Sections (2009-14)
(1) (2) (3) (4)
Fatal Risk (%) 1.446*** -0.686** (0.172) (0.277)
Injury Risk (%) 0.014*** -0.001 (0.001) (0.002) Gender -0.146*** -0.130*** -0.141*** -0.130***
(0.003) (0.003) (0.003) (0.003) Age 0.036*** 0.036*** 0.037*** 0.036***
(0.001) (0.001) (0.001) (0.001) Age Squared -0.044*** -0.044*** -0.044*** -0.044***
(0.001) (0.001) (0.001) (0.001) Job Tenure Years 0.014*** 0.014*** 0.014*** 0.014***
(0.001) (0.001) (0.001) (0.001) Job Tenure squared 0.000 -0.001 0.000 -0.001
(0.003) (0.003) (0.003) (0.003) Born local -0.036*** -0.036*** -0.036*** -0.036***
(0.002) (0.002) (0.002) (0.002) State Employee 0.379*** 0.356*** 0.387*** 0.356***
(0.008) (0.009) (0.008) (0.009) Regular Working Hours -0.016*** -0.016*** -0.016*** -0.016***
(0.000) (0.000) (0.000) (0.000) Married 0.041*** 0.041*** 0.040*** 0.041***
(0.003) (0.002) (0.003) (0.002) Education Level
Primary or less 0.008 0.007 0.006 0.007 (0.005) (0.005) (0.005) (0.005) Secondary 0.137*** 0.124*** 0.133*** 0.124***
(0.005) (0.005) (0.005) (0.005) Tertiary 0.329*** 0.305*** 0.325*** 0.305***
(0.007) (0.007) (0.007) (0.007) Firm Size
Firm Size (11-49) 0.031*** 0.030*** 0.030*** 0.030*** (0.003) (0.003) (0.003) (0.003) Firm Size (+50) 0.092*** 0.086*** 0.090*** 0.086***
(0.003) (0.003) (0.003) (0.003) Year Effects
Year 2010 -0.021*** -0.009** -0.026*** -0.012*** (0.004) (0.004) (0.004) (0.004) Year 2011 0.001 0.015*** -0.003 0.011***
(0.004) (0.004) (0.004) (0.004) Year 2012 0.020*** 0.021*** 0.007** 0.022***
(0.004) (0.003) (0.004) (0.004) Year 2013 0.050*** 0.062*** 0.020*** 0.060***
(0.004) (0.004) (0.004) (0.005) Year 2014 0.095*** 0.105*** 0.059*** 0.105***
(0.004) (0.004) (0.004) (0.005) Constant 2.221*** 2.213*** 2.225*** 2.210***
(0.022) (0.022) (0.022) (0.022)
Industry Effects no yes no yes Occupation Effects yes yes yes yes Regions Effects yes yes yes yes
Observations 103,734 103,734 103,734 103,734 R-squared 0.577 0.588 0.578 0.588
The omitted category for dummies; having no schooling for education, less than 10 work-ers for firms size, the year 2009 for year effect, food sector for industry, executive man-agers for occupations, Istanbul province for regions. We control region (12), year (6), occupation (9) and industry (24) fixed effects.
risk premium should be paid according to the trade-off. In short, if productivity dispersion (wage differentials) reflects the level of firm-specific technology then more productive (with higher capital) firms should pay less to their workers for risky tasks than firms with less safe technology.
However, industry wage differentials may not only reflect risk compensation but also industry-specific technology differences that are hard to identify with limited (pooled cross-sectional) data, although multi-levelling could offer one improvement. In this study, we propose a solution involving a two-step procedure used to model hierarchical struc-tures (Hanushek, 1974), (Saxonhouse, 1976). Bryan and Jenkins (2016) have recently discussed the effectiveness of a two-step procedure to isolate the source of variation by multi-levelling the estimation. The proposed solution is to regress the raw industry differ-entials (qjt) obtained in the first step (Eq.2) on the proxy variables that we think measure
working conditions and environment (second stage). In the second step (Eq.2), the esti-mated industrial wage differentials (qˆjt) are regressed on accident risks and indicators such
as industry averages (factor-weighted) proxying for unobserved productivity. The second stage also controls for the fixed effects for year and industry (24 sub-sectors). We argue that, in the presence of multi-collinearity correlation bias, the standard hedonic wage re-gression may be unable to differentiate industry wage differentials from the compensating premiums related to working conditions.
ln(wijt) =α+βXijt+qjt+ǫijt (2)
ˆ
qjt =γIjt+ηjt (3)
Table 3: Second Stage Results (Industrial Wage Differentials and Industry Specific Indicators
M1 M2 M3 M4 M5 M6 M7 M8 M9 M10 M11 M12 M13 M14 M15
Fatal Risk (%) -0.924* -0.746* -1.117** -1.033* -0.293
(0.526) (0.445) (0.535) (0.557) (0.491)
Injury Risk (%) -0.002 -0.001 0.005* 0.007** -0.000
(0.004) (0.004) (0.003) (0.003) (0.004)
Ave. Job Tenure Years 0.018** 0.016*** 0.017*** 0.012* 0.012
(0.008) (0.005) (0.006) (0.007) (0.007)
Ave. Working Hours -0.011* -0.010* -0.015*** -0.011* -0.016*** -0.013*** -0.013*** -0.005 -0.005
(0.006) (0.006) (0.003) (0.006) (0.003) (0.003) (0.003) (0.005) (0.005)
Unqualified Workers -0.257*** -0.061 -0.109 -0.251*** -0.272***
(0.082) (0.074) (0.071) (0.084) (0.078)
Value-Added per worker -0.037 -0.001 0.074*** -0.009 0.065*** 0.060*** 0.048*** -0.018 -0.022
(0.035) (0.033) (0.015) (0.034) (0.013) (0.016) (0.013) (0.031) (0.031)
Administrative Workers 0.078 0.253 0.226 0.115 0.028 -0.315 -0.339
(0.177) (0.263) (0.299) (0.287) (0.306) (0.212) (0.207)
Constant 0.005 0.004 -0.113** 0.628* 0.169*** 0.402 -0.002 0.570 0.003 0.685 0.159 0.016 0.141 0.597* 0.662*
(0.007) (0.006) (0.051) (0.349) (0.053) (0.381) (0.013) (0.447) (0.295) (0.466) (0.251) (0.266) (0.222) (0.337) (0.340)
Year Effects + + + + + + + + - + - - - + +
Industry Effects + + + + + + + + - + - - - + +
Observations 144 144 144 144 144 144 144 144 144 144 144 144 144 144 144
R-squared 0.909 0.904 0.914 0.911 0.917 0.906 0.904 0.915 0.647 0.912 0.640 0.670 0.669 0.929 0.929
*** p<0.01, ** p<0.05, * p<0.1. Robust standard errors in parentheses.
3
Discussion
We do not present the estimation results from the first-step regression since they did not differ significantly from the expected dummy variables for industry-by-year pairs. Table 3 displays the results of the second stage with various specifications. It is striking that, on average, industries with higher fatality accident risk pay are correlated with lower wage premiums while injury risk is positively compensated in some specifications. It is possible that more risk-exposed sectors may be associated with various factors other than accident risk that affect wage differentials. The inclusion of industry-specific averages might help isolate these omitted factors. Krueger and Summers (1988) find that, in OLS estimations, controlling for working conditions does not change pay differentials across industries. For example, they integrated value added per worker7 to reflect differences in production
technology and profit sharing. This has a positive and significant impact on wage differ-entials. For the share of unqualified workers, the negative impact significantly captures unobserved productivity or the limited level of human capital, even after including other variables. Average years of tenure is included to proxy for workforce turnover and firm-specific knowledge accumulation. Given its positive impact, we can interpret tenure as a proxy for turnover. Note that firm-specific experience may also reflect that sector-specific skill building is important in Turkey’s case, in addition to the other standard human capital proxy of education level. However, the share of administrative workers has no significant effect on sector pay differences.
As already mentioned, the role of longer working hours also needs further discussion. Low pay (less productive) sectors are associated with longer working hours. The legal framework in Turkey allows firms to determine the working hours of each worker during a working week. According to the World Bank’s Doing Business Index(2010)8, the standard
number of working hours in a day (Article 63, Labor Law, 2003) is restricted to eleven hours in Turkey, which is not common in most OECD countries, as the usual upper limit in practice is eight hours per day. In the Turkish labor market, working hours commonly exceed the standard 45 hours per month9 (without compensation) in both the formal
and informal sectors (Toks¨oz, 2008);(Messenger, 2011). Finally, although multi-leveling
7Aggregated data for industry-level value added per worker are derived from the Annual Firm Census
(TurkStat).
8http://www.doingbusiness.org/data/exploretopics/employing-workers
9The minimum wage is paid on a monthly basis. Polat and Ulus (2014) argue that monthly wage
improves the estimation compared to the standard hedonic regression, these results should be interpreted cautiously as further research is needed to address the shortcomings of this study. In particular, greater than two-digit disaggregation of sectors may refine the relationship between low pay and poor working conditions more clearly.
4
Conclusion
References
Brown, C. (1980). Equalizing differences in the labor market. The Quarterly Journal of Economics, pages 113–134.
Bryan, M. L. and Jenkins, S. P. (2016). Multilevel modelling of country effects: a caution-ary tale. European Sociological Review, 32(1):3–22.
Eurofound (2012). Fifth european working conditions survey.
H¨am¨al¨ainen, P. (2009). The effect of globalization on occupational accidents. Safety Science, 47(6):733–742.
H¨am¨al¨ainen, P., Leena Saarela, K., and Takala, J. (2009). Global trend according to esti-mated number of occupational accidents and fatal work-related diseases at region and country level. Journal of Safety Research, 40(2):125–139.
Hanushek, E. A. (1974). Efficient estimators for regressing regression coefficients. The American Statistician, 28(2):66–67.
Hintermann, B., Alberini, A., and Markandya, A. (2010). Estimating the value of safety with labour market data: are the results trustworthy? Applied Economics, 42(9):1085– 1100.
Hwang, H.-s., Reed, W. R., and Hubbard, C. (1992). Compensating wage differentials and unobserved productivity. Journal of Political Economy, pages 835–858.
Kim, S.-W. and Fishback, P. V. (1999). The impact of institutional change on compensat-ing wage differentials for accident risk: South korea, 1984–1990. Journal of Risk and Uncertainty, 18(3):231–248.
Kochi, I. (2011). Endogeneity and estimates of the value of a statistical life. Environmental Economics, 2, Issue 4:17–31.
Krueger, A. B. and Summers, L. H. (1988). Efficiency wages and the inter-industry wage structure. Econometrica: Journal of the Econometric Society, pages 259–293.
Leigh, J. P. (1995). Compensating wages, value of a statistical life, and inter-industry differentials. Journal of Environmental Economics and Management, 28(1):83–97. Messenger, J. C. (2011). Working time trends and developments in europe. Cambridge
Journal Of Economics, 35(2):295–316.
Morantz, A. (2011). Does unionization strengthen regulatory enforcement-an empirical study of the mine safety and health administration. NYUJ Legis. & Pub. Pol’y, 14:697. OECD (2006). Society at a Glance: OECD Social Indicators-2006 Edition. Organisation for
Polat, S. (2014). Wage compensation for risk: The case of Turkey. Safety Science, 70:153– 160.
Polat, S. and Ulus, M. (2014). Hours worked, wages and productivity. Mimeo, Department of Economics, Galatasaray University.
Rosen, S. (1986). The theory of equalizing differences. Handbook of labor economics, 1:641–692.
Saxonhouse, G. R. (1976). Estimated parameters as dependent variables. The American Economic Review, 66(1):178–183.
Toks¨oz, G. (2008). Decent work country report- Turkey.International Labour Organization. Viscusi, W. K. and Aldy, J. E. (2003). The value of a statistical life: a critical review of