Diffusion of Al and Al-Substituting Elements
in Ni
3Al at Elevated Temperatures
Md. Moniruzzaman
1,+1, Hiroaki Fukaya
1, Yoshinori Murata
1,+1,
Katsushi Tanaka
2,+2and Haruyuki Inui
31Department of Materials, Physics and Energy Engineering, Graduate School of Engineering,
Nagoya University, Nagoya 464-8603, Japan
2Department of Materials Science and Engineering, Graduate School of Engineering,
Kyoto University, Kyoto 606-8501, Japan
3Department of Materials Science and Engineering, Graduate School of Engineering,
Kyoto University, Kyoto 606-8501, Japan
Diffusion of Ti, V, Nb, Mo and Ta in Ni3Al phase was investigated at different temperatures using NiAlX (X=Ti, V, Nb, Mo, Ta) pseudo-binary diffusion couples. The magnitude of the interdiffusion coefficients was in the descending order of V, Mo, Ti, Nb and Ta at all experimental temperatures ranging from 1423 to 1573 K. Diffusion data obtained in this study was compared with those of Re and Ru available in the literature as Re and Ru are recently being added in modern Ni-based superalloys. Diffusion retardation occurred for Ti, V, Nb, Mo and Ta as compared to Ru, and this can be explained by the anti-site diffusion mechanism. The high activation energy for anti-site formation is required for¢-site (Al-site) elements, such as Ti, V, Nb, Mo and Ta. However, as Ru can diffuse either by¡- (Ni-site) or¢-site preferences without creating local disorder, Ru diffusion is not retarded by the anti-site diffusion mechanism. [doi:10.2320/matertrans.M2012218]
(Received June 20, 2012; Accepted September 5, 2012; Published October 17, 2012)
Keywords: nickel-based superalloys, nickel aluminide, diffusion couple, interdiffusion coefficient, activation enthalpy
1. Introduction
Nickel based superalloys comprise a class of materials developed particularly for superior properties at elevated temperatures, and they are being widely used as materials for blades in aircraft engines and land-based gas turbines.1)
Nickel aluminide, Ni3Al (£A), has attracted much attention
as an important phase in these superalloys as it exhibits the inverse temperature dependence of strength.2)The ordered£A lattice, denoted as L12, is stable up to the melting
temper-ature,Tm(Tm=1668 K for pure Ni3Al). However, this phase
in a pure binary form shows poor high-temperature creep strength and this strength can be improved by alloying. The elements replacing Al in Ni3Al, such as Ti, Nb, Ta etc.
strengthen the£Aphase and thus contribute in strengthening the superalloys, whereas the Ni substituting elements (Co, Fe, Cr etc.) improve ductility.3) Furthermore, considerable
amounts of Re have been added to Ni-based superalloys in the process of alloy evolution for improving both creep strength and hot corrosion resistance. Re and other refractory elements introduced so far are £ stabilizing elements,4)and
their addition increases the negative mismatch between £ and £A phases in superalloys. Therefore, the addition of £A -stabilizing elements, such as Ti, V, Nb, Mo and Ta is necessary for maintaining coherency between £ and £A phases.
The diffusion parameters of the alloying elements in Ni-based superalloys are important for understanding the excellent high-temperature properties attributed by the
alloying elements in high-temperature processes, including homogenization and precipitation of the £A phase in £ matrix.5) Despite the obvious importance of the diffusion
phenomena of Ni-based superalloys, little attention has been paid to obtaining diffusion parameters. Information concern-ing the interdiffusion of Re in a binary NiRe system has been reported by Karunaratne et al.,6)while Hattori et al.7)
reported the interdiffusion in ternary NiAlRe and NiAlW systems. Moreover, the activation enthalpy of Nb in Ni3Al,
reported by Jiri Cermaket al.,3)shows a substantially lower value than in the literature,8)although the authors suggested some possible explanations for this discrepancy. Jiri Cermak
et al.3) got the activation enthalpy of Nb in Ni3Al to be
306 kJ/mol where as Divinskiet al.2)mentioned the value to be 476 kJ/mol in their respective experiments. Thus, further research on the diffusion of Al and Al-substituting solute atoms should be necessary. In this study, the intrinsic diffusion of Ti, V, Nb, Mo and Ta in Ni3Al was studied
systematically in NiAlX (X=Ti, V, Nb, Mo, Ta) systems in the temperature range of 14231573 K.
2. Experimental Procedure
Button ingots of Ni23Al (mol%) andfive kinds of ternary Ni alloys were prepared by arc melting under high-purity argon (Ar) gas atmosphere for the diffusion experiments. Their terminal compositions are shown in Table 1. These alloys were prepared from high-purity nickel (99.99 mass pct), aluminum (99.99 mass pct), titanium (99.5 mass pct), vanadium (99.9 mass pct), niobium (99.9 mass pct), molyb-denum (99.95 mass pct) and tantalum (99.95 mass pct). The compositions placed the alloys in the single£Aphase region of the ternary phase diagram at all experimental temperatures. The ingots were cut into rectangular samples (10©10©
+1Corresponding author, E-mail: monir@silky.numse.nagoya-u.ac.jp,
+2Present address: Department of Mechanical Engineering, Kobe
Univer-sity, Kobe 657-8501, Japan
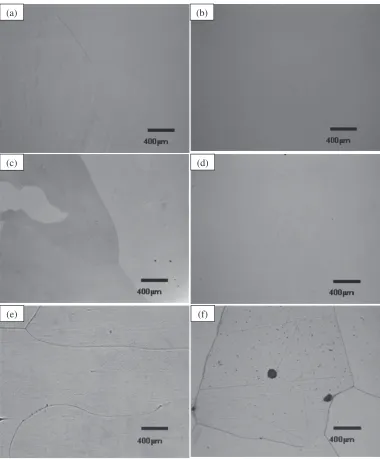
2 mm), and then annealed at 1573 K for 240 h in order to promote homogenization and grain growth. Sufficiently large grain sizes for the diffusion experiments were obtained after this heat treatment in all six alloys, as shown in Fig. 1. In the cases of Ni23Al2Ti and Ni23Al2Nb, no grain boundary is seen in thefigure because of their larger grain sizes than the respective micrograph sizes.
The homogenized samples were ground flat into plates, and then polished with a 0.25-µm diamond slurry for
finishing. The plate specimens were then cleaned with acetone in an ultrasonic cleaner. Each diffusion couple listed in Table 1 was assembled with inert markers of alumina
fibers 0.3 µm in diameter, placed between the polished surfaces of two plate specimens, and clamped using a molybdenum holder. Before this arrangement, the surfaces of the holder were coated with alumina powders 1 µm in diameter to prevent direct contact with the alloys. Five types
(a) (b)
(c) (d)
(e) (f)
[image:2.595.108.488.68.527.2]Fig. 1 Optical micrographs showing the grain sizes of the alloys, (a) Ni23Al, (b) Ni23Al2Ti, (c) Ni23Al2V, (d) Ni23Al2Nb, (e) Ni23Al2Mo and (f ) Ni23Al2Ta for diffusion couples after homogenization at 1573 K.
Table 1 Heat treatment conditions of diffusion couples.
No. Diffusion couple (mol%) Homogenization Diffusion annealing
1 Ni23Al/Ni23Al2Ti 1573 K, 240 h
1523 K, 168 h 1473 K, 265 h 1423 K, 360 h
2 Ni23Al/Ni23Al2V 1573 K, 240 h
1523 K, 96 h 1473 K, 120 h 1423 K, 144 h
3 Ni23Al/Ni23Al2Nb 1573 K, 240 h
1523 K, 96 h 1473 K, 120 h 1423 K, 144 h
4 Ni23Al/Ni23Al2Mo 1573 K, 240 h
1523 K, 189 h 1473 K, 328 h 1423 K, 600 h
5 Ni23Al/Ni23Al2Ta 1573 K, 240 h
[image:2.595.47.291.597.786.2]of diffusion couples were prepared, as shown in Table 1. The diffusion couples were encapsulated in quartz ampoules under Ar gas for diffusion annealing, at three different temperatures for different durations, as shown in Table 1. Then, the couples were quenched into water by breaking the ampoules and then sectioned perpendicular to the diffusion interface. The exposed surface was polished using a 0.3-µm alumina powder finish and cleaned with acetone in an ultrasonic cleaner. The redistribution profiles of the elements along the diffusion zone were measured by SEM/EDX with the position of the inert alumina marker fixed as the origin of the diffusion distance.
3. Analaysis Method
Sisson et al.9) correlated the direct and the cross
interdiffusion coefficients with intrinsic diffusion coefficients of elements i in jk alloys (where i: Ti, V, Nb, Mo, Ta; j: Al; k: Ni). According to Sissonet al.9)and Shucket al.10)
the interdiffusion coefficient becomes equal to the intrinsic diffusion coefficient, when the atomic concentration of element i, Ci, approaches zero:
lim
ci!0 ~
Dk
ii¼DiðjkÞ; ð1Þ
lim
ci!0 ~
Dk
ij¼0; ð2Þ
where DiðjkÞ is the intrinsic diffusion coefficient of element i in (jk) binary alloys, D~k
iithe direct interdiffusion
coefficient and D~k
ij the cross interdiffusion coefficient. The
above relationships were also used by Minamino et al.11)
According to eqs. (1) and (2), the direct coefficient of the
£Aphase becomes equal to the intrinsic diffusion coefficient of element i in the £A phase, because the cross coefficient
~
Dk
ij goes to zero at infinite dilution of element i. Therefore,
the interdiffusion flux of element i, denoted by J~i, can be
written as
for Ci!0; J~i¼ Dið£0Þ
@Ci
@X: ð3Þ
In this diffusion equation, Hall’s method12) can be used to estimate the intrinsic diffusion coefficient for i element in£A,
D
ið£0Þ, by analysis of the end of diffusion profiles using the
following relationships:
Yi¼1
2ð1þerfcðuÞÞ; ð4Þ
where Yi is the normalized concentration defined by Yi¼ ðCiCi Þ=ðCiþCi Þ. Cþi and Ci are terminal
atomic concentrations of element i of the diffusion couples. In eq. (4), according to Hall,12)u is represented by
u¼ht0x:5þl¼h þl; ð5Þ
where t, x, h and l, respectively, are the time, distance, slope and intercept of the line ofucurve on the probability paper. Using these parameters, the diffusion coefficient is represented by
~
DiðYiÞ ¼ 1
4h2þ
l³1 2
2h2expðu
2ÞerfcðuÞ: ð6Þ
In eq. (5), if h and l are constants, then u plot gives a straight line. However, u plot sometimes does not give a straight line, as will be shown in section 4. Therefore, in this study, h and l are defined at each segment in the u plot, according to Sarafianos.13)
4. Results and Discussion
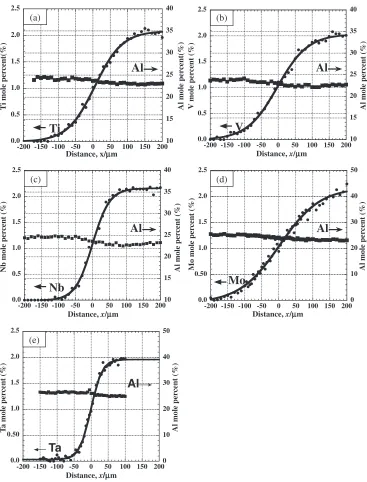
Representative redistribution profiles of Ti, V, Nb, Mo and Ta with their corresponding Al profiles in the respective couples after diffusion annealing at 1523 K are shown in Fig. 2. Thefitting line in each profile in thefigure was drawn using a high-order function as follows:14)
CiðxÞ ¼C
i þ
Cþ
i Ci
1þexp
xx0
x
; ð7Þ
whereCi andCþi are the terminal atomic concentrations of element i at distancexof¹¨and+¨, respectively, and x0
is a constant. In Fig. 2, a difference in diffusion distances is observed among solute elements in their respective systems. For example, Ti, V, and Mo diffused about 200 µm, whereas Nb and Ta diffused less than 100 µm at 1523 K.
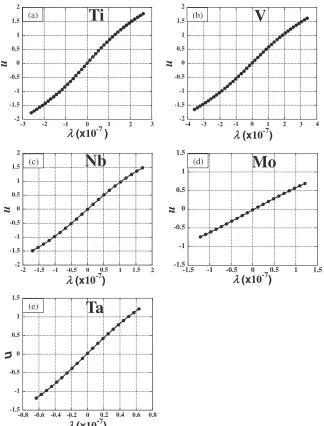
According to eqs. (4)(5),u plots were obtained based on the experimental results shown in Fig. 2. The plots are shown in Fig. 3. As mentioned in section 3, each u plot does not give a straight line, but has a curvature. Thus,handl
values are obtained by taking the derivative of the curve in eachuplot in Fig. 3. On the basis of thesehandlvalues, interdiffusion coefficients are calculated according to eq. (6). The obtained interdiffusion coefficients for the solute elements Ti, V, Nb, Mo and Ta are presented in Fig. 4. Irrespective of the temperature dependence, the interdiffusion coefficients are slightly larger for V, followed by Ti, Mo, Nb, and relatively smaller values are obtained for Ta.
The intrinsic diffusion coefficients obtained from the extrapolation to Ci¼0 for Ti, V, Nb, Mo and Ta as Ciin
£A (DðTi£0Þ, DðV£0Þ,DNbð£0Þ, DMoð£0Þ and DðTa£0Þ, respectively) are obtained from the curves in Fig. 4, and they are presented as a function of the reciprocal absolute temperatures in Fig. 5. The intrinsic diffusion coefficient of ruthenium (Ru) and rhenium (Re) in the£Aphase reported by Mabruriet al.15)is
also displayed in the figure for comparison. Mabruri used Darken-Manning equation16,17) for the analysis of intrinsic
diffusion coefficients. Figure 5 shows that the diffusivity of Ti, V, Nb, Mo, Ta and Re in the£Aphase is much lower than that of Ru within the range of experimental temperatures. Ta shows the lowest diffusivity among the seven elements.
The activation energy and the frequency factor for the intrinsic diffusivities obtained from the Arrhenius plot in Fig. 5 are shown in Table 2. The Arrhenius parameters of each element in the£phase reported so far are also listed in Table 2 for comparison. Table 2 shows that the activation energies of Ti, V, Nb, Mo, Ta and Re in the £A phase are significantly larger than those in the £ phase indicating that these elements diffuse in Ni3Al in a similar mechanism. This
mechanism is discussed in the following paragraph. On the other hand, Ru exhibits comparable values both in the£Aand
£ phases15,18)which means that Ru diffuses in the £A phase
occupancy of Ru in£Aphase in reported by Mabruriet al.15)
Although the Ru site occupancy reported here is supported by some other authors,2,11,1921) it is a speculation from the low and comparable activation energy values of Ru in both
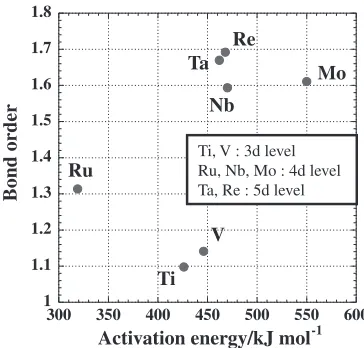
£ and £A phases and further study is necessary for its verification. Figure 6 shows the variation of activation energies with the bond order of elements. Bond order implies the strength of interaction in NiX (X=Al-substituting elements) system.22)In the same d-orbital energy level group, the large bond order element needs the large activation energy for diffusion. For example, Ti and V belong to 3d energy level. V has the larger bond order than Ti. The activation energy of V is found larger than Ti in this study. This means that the strength of NiX affects the activation energy. Other experimental elements within the same d-orbital energy level also satisfy the same scheme.
It is well accepted that the diffusion of elements in Ni3Al
(L12-type structure) depends strongly on the site preference
of the element.2,11,2327) An ¡-site (Ni site) in L12 structure
has eight nearest neighbor¡-sites and four nearest neighbor
¢-sites, whereas¢-sites (Al site) are exclusively surrounded by twelve ¡-sites. From this configuration, it is naturally expected that ¡-site atoms (e.g., Ni atom) can migrate over their own sublattice without disturbing the long range order, by the ordinary vacancy mechanism (the sublattice vacancy mechanism28)). The migration of ¢-site atoms (e.g., Al or Al-substituting solutes), however, appears to be less easy because their jump to a neighboring site must disrupt the ordered atomic arrangement. This can be explained by the anti-structure bridge (ASB) mechanism.2) There are always
some Al atoms present on ¡ sublattice sites. These atoms (anti-structure Al atoms) can also migrate through the ¡
0.0 0.5 1.0 1.5 2.0 2.5 10 15 20 25 30 35 40 -200
V mole per
cent (%)
Al mole per
cent (%)
Al
V
Distance, x/μm
(b) 0.0 0.5 1.0 1.5 2.0 2.5 10 15 20 25 30 35 40 -200
Nb mole per
cent (%)
Al mole per
cent (%)
Al
Nb
Distance, x/μm
(c) 0.0 0.50 1.0 1.5 2.0 2.5 0 10 20 30 40 50 -200
Mo mole per
cent (%)
Al mole per
cent (%)
Distance, x/μm
Al
Mo
0.0 0.50 1.0 1.5 2.0 2.5 0 10 20 30 40 50 -200 T a mole per cent (%)Al mole per
cent (%)
Al
Ta
Distance, x/μm
(e) 200 150 100 50 -50 -100 -150 0 200 150 100 50 -50 -100 -150 0 200 150 100 50 -50 -100 -150 0 200 150 100 50 -50 -100 -150 0 (d) 0.0 0.5 1.0 1.5 2.0 2.5 10 15 20 25 30 35 40
-200 -150 -100 -50 0 50 100 150 200
T
i mole per
cent(%)
Al mole per
cent(%)
Al
Ti
Distance, x/μm
(a)
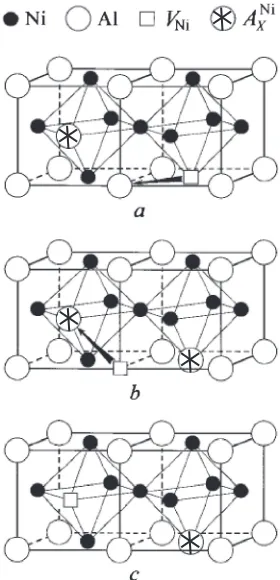
[image:4.595.115.482.67.549.2]sublattice by exchanging their positions with Ni vacancy at¡ sublattice. To perform an elementary migration an Al anti-site atom and a Ni vacancy must occupy nearest neighbor positions of the Ni sublattice. The anti-structure bridge (ASB) mechanism consists in the following sequences of atomic jump as shown in Fig. 7: (a) a nearest neighbor jump of a Ni vacancy into an adjacent Al site. Here an additional anti-structure Al atom is created at the initial position of the Ni vacancy, (b) a nearest neighbor jump of an initial anti-structure Al atom into the new vacant position on the Al sublattice. Vanaccy on the Ni sublattice is restored now. Final structure of this two-step ASB jump is shown in Fig. 7(c). As a result of accomplishing two vacancy jumps, the anti structure Al atom and the Ni vacancy exchange their positions:
ANi
AlþVNi!ANiAlþA0NiAl þVAl!A0NiAl þVNi ð8Þ
Here ANi
Al denotes an Al atom at the Ni sublattice (the anti
structure Al atom); VAland VNiare the vacancies on Al and
Ni sublattices, respectively. In true sense, initial andfinal Al
atoms are different Al atoms as denoted by the primed symbol in eq. (8). Two Al atoms participate in an elementary ASB jump, namely nearest neighbor site and anti site atoms, andfinally they exchange the host lattices: the Al atom jumps from the Al to the Ni sublattice and the anti structure Al atom goes to the Al sublattice. Thus diffusion of Al atoms in the
¢-sites must overcome the energy associated with local disordering caused by the exchanging positions betweenANi Al
and VNi. This means that diffusion of Al atoms needs a larger
activation enthalpy including the atomic ordering energy. For simplicity, this activation enthalpy, Qord, is assumed to
be the sum of the activation enthalpy for diffusion in the disordered£Aphase,Qdis, and the ordering energy,Eord, then
Qord¼QdisþEord; ð9Þ
In the case of the¡-site atoms migrate from¡-sites to one of the nearest eight ¡-sites, they can diffuse without creating local disordering. Thus, the solutes substituting for Al show higher activation enthalpy than the elements substituting for Ni. This corresponds to the additional contribution needed for
(a)
-2 -1.5 -1 -0.5 0 0.5 1 1.5 2
-3
λ
(x
10
-7)
u
Ti
-2 -1.5 -1 -0.5 0 0.5 1 1.5 2
-4
u
V
λ
(x
10
-7)
(b)
-2 -1.5 -1 -0.5 0 0.5 1 1.5 2
-2
u
Nb
λ
(x
10
-7)
(c)
-1.5 -1 -0.5 0 0.5 1 1.5
-1.5
u
Mo
λ
(x
10
-7)
(d)
-1.5 -1 -0.5 0 0.5 1 1.5
-0.8
u
Ta
λ
(x
10
-7)
1.5 1 0.5 -0.5
-1 0 1.5
1 0.5 -0.5 -1
-1.5 0 2
0.8 0.6 0.4 0.2 0 -0.2 -0.4 -0.6
3 2 1 0 -1
-2 -3 -2 -1 0 1 2 3 4
(e)
[image:5.595.139.463.68.494.2]10-16 10-15 10-14
0
Interdiffusion coeff
icient/m
2 s
-1
Ti concentration/mol% 1423K
1473K 1523K
(a)
10-16
10-15 10-14
0
Interdiffu
sion coeff
icient/m
2 s
-1
V concentration/mol% 1423K
1473K 1523K
10-16
10-15 10-14
0
Interdiffu
sion coeff
icient/m
2 s
-1
Nb concentration/mol% 1423K
1473K 1523K
10-16 10-15 10-14
0
Interdiffu
sion coeff
icient/m
2 s
-1
Mo concentration/mol% 1423K
1473K 1523K
(d)
10-17 10-16 10-15 10-14
0
Interdiffu
sion coeff
icient/m
2 s
-1
Ta concentration/mol% 1523K
1573K
1473K
2 1 1.5
0.5 0.5 1 1.5 2
2 1 1.5 0.5
2 1 1.5 0.5
2 1 1.5 0.5
(b)
(e) (c)
Fig. 4 Interdiffusion coefficients determined as a function of concentration at different temperatures for the solute elements of (a) Ti, (b) V, (c) Nb, (d) Mo and (e) Ta in Ni3Al.
1 1.1 1.2 1.3 1.4 1.5 1.6 1.7 1.8
300
Bond order
Activation energy/kJ mol-1 Ti
V Ru
Nb
Mo Ta
Re
Ti, V : 3d level Ru, Nb, Mo : 4d level Ta, Re : 5d level
600 550 500 450 400 350
Fig. 6 Variation of activation energies with the bond order of experimental elements.
10-17 10-16 10-15 10-14
6.3
Reciprocal temperature, T-1/K-1 (x10-4)
Ru
V
Re
Ti
Nb
Mo
Ta
Intrinsic diffusion coeff
icient,
D
/m
2 s
-1
7.1 6.9
6.8 6.7 6.6 6.5
6.4 7
Fig. 5 Extrapolated intrinsic diffusion coefficients for Ti, V, Nb, Mo, Ta, Re15)and Ru15)in Ni
[image:6.595.138.462.78.509.2] [image:6.595.335.517.580.754.2] [image:6.595.65.270.584.753.2]antisite formation2,29) i.e., the low mobilities of Ti, V, Nb,
Mo, Ta and Re atoms in Ni3Al compared to those in Ni is due
to this anti structure bridge diffusion mechanism. The elements occupying both sites (¡- or ¢-sites) can diffuse by a similar mechanism to that for Ni substituting elements. Ru can diffuse either by ¡- or ¢-site preference, and hence its diffusion is not retarded by the anti structure bridge diffusion mechanism. Thus, Fig. 5 shows more rapid diffusion of Ru than of Ti, V, Nb, Mo, Ta and Re.
5. Conclusion
The diffusion of Ti, V, Nb, Mo and Ta in Ni3Al phase was
investigated at four different temperatures of 1423, 1473, 1523 and 1573 K using pseudo-binary diffusion couples. Irrespective of the temperature dependence, the magnitudes of interdiffusion coefficients were in the descending order of Ru, V, Mo, Ti, Nb, Re and Ta. On the basis of modified Hall method, the activation enthalpy (Q) for solute element diffusion in Ni3Al was estimated from experimental data. The
activation enthalpies of Ti, V and Nb in the£Aphase obtained from this study were very close to the result reported so far.2,31) The resulting activation enthalpies and frequency factors obtained in this study are summarized as follows:
DðTi£0Þ¼1:8100expð426 kJmol1=RTÞ
DðV£0Þ¼1:7101expð446 kJmol1=RTÞ
DðNb£0Þ¼3:5101expð470 kJmol1=RTÞ
DðMo£0Þ¼5:2104expð550 kJmol1=RTÞ
DðTa£0Þ¼7:16100expð462 kJmol1=RTÞ
Acknowledgments
This work was supported in part by a Grant-in-Aid for Scientific Research of Japan Society for the Promotion of Science (JSPS), Japan.
REFERENCES
1) T. M. Pollock, R. D. Kissinger, R. R. Bowman, K. A. Green, M. McLean, S. L. Olson,et al.(eds.): Superalloys 2000, Warrendale (PA, USA), (The Minerals, Metals and Materials Society; 2000).
2) S. V. Divinski, S. Frank, U. Sodervall and C. Herzig:Acta Mater.46
(1998) 43694380.
3) J. Cermak, A. Gazda and V. Rothova:Intermetallics11(2003) 939 946.
4) A. F. Giamei and D. L. Anton:Metall. Trans. A16(1985) 19972005. 5) C. E. Cambell, W. J. Boettinger and U. R. Kattner:Acta Mater.50
(2002) 775792.
6) M. S. A. Karunaratne, P. Carter and R. C. Reed:Mater. Sci. Eng. A281
(2000) 229233.
7) M. Hattori, N. Goto, Y. Murata, T. Koyama and M. Morinaga:Mater. Trans.46(2005) 163166.
8) M. S. A. Karunaratne, P. Carter and R. C. Reed:Acta Mater.49(2001) 861875.
9) R. D. Sisson, Jr. and M. A. Dayananda:Metall. Trans. A 8(1977) 18491856.
10) F. O. Shuck and H. L. Toor:J. Phys. Chem.67(1963) 540545. 11) Y. Minamino, S. B. Jung, T. Yamane and Hirao:Metall. Trans. A23
(1992) 27832790.
[image:7.595.45.291.93.379.2]12) L. D. Hall:J. Chem. Phys.21(1953) 8789. Table 2 The arrhenius parameters for the diffusion of Ti, V, Nb, Mo, Ta, Re
and Ru in£and£A(Ni3Al) phases.
Diffusion elements Phase
Q (kJ/mol)
D0
(m2/s) Reference
Ti
£ 270 ® Karunaratneet al.18)
£A 426 1.8©100 This study
£A 425 8.6©10¹1 Divinskiet al.2) £A 468 5.6©101 Minaminoet al.11)
V
£ 268 ® Millionet al.30)
£A 446 1.7©101 This study
£A 459 5.9©101 Yamaneet al.31)
Nb
£ 230 ® Karunaratneet al.18)
£A 470 3.5©101 This study
£A 476 2.6©101 Divinskiet al.2)
Mo £ 393 ® Karunaratneet al.
18)
£A 550 5.2©104 This study
Ta £ 251 2.2©10
¹5 Karunaratneet al.18)
£A 462 7.16©100 This study
Re £ 330 5.0©10
¹4 Karunaratneet al.18)
£A 468 1.5©101 Mabruriet al.15)
Ru £ 304 2.5©10
¹4 Karunaratneet al.18)
£A 319 1.3©10¹3 Mabruriet al.15)
Fig. 7 A scheme of the atomic arrangements according to the anti structure bridge mechanism. (a) Initial Ni vacancy and Al (or solute X) anti structure atomANi
[image:7.595.99.239.430.720.2]13) N. Sarafianos:J. Mater. Sci.21(1986) 22832288.
14) T. Ikeda, A. Almazouzi, H. Numakura, M. Koiwa, W. Sprengel and H. Nakajima:Acta Mater.46(1998) 53695376.
15) E. Mabruri, S. Sakurai, Y. Murata, T. Koyama and M. Morinaga:Mater. Trans.49(2008) 14411445.
16) L. S. Darken: Trans. Am. Inst. Min. Metall. Eng.175(1948) 184. 17) G. S. Manning:Acta Metall.15(1967) 817826.
18) M. S. A. Karunaratne and R. C. Reed:Acta Mater.51(2003) 2905 2919.
19) C. Jiang and B. Gleeson:Scr. Mater.55(2006) 433436.
20) A. P. Ofori, C. J. Rossouw and C. J. Humphreys:Acta Mater.53(2005) 97110.
21) M. Shimotomai, T. M. Wang and M. Doyama: J. Nucl. Mater.116
(1983) 347348.
22) H. Adachi, T. Mukoyama and J. Kawai: Hartree-Fock-Slater Method for Materials Science®The DV-X¡Method for Design and Character-ization of Materials, (Springer Series in Materials Science, Kyoto, 2005) pp. 2529.
23) P. Shewmon: Diffusion in Solids, 2nd ed., (TMS, Warrendale, PA, 1989) pp. 7175.
24) H. Bakker: DIMETA-82, Diffusion in Metals and Alloys, (Trans Tech Publ. Switzerland, 1983).
25) F. J. Kedves and D. L. Beke, (eds.): Proc. DIMETA-82, (Trans Tech Publications, Aedermannsdorf, Switzerland, 1983) pp. 266283. 26) R. W. Cahn: MRS Symp. Proc., (MRS, Pittsburgh, PA, 57 1987)
pp. 385404.
27) H. Weber, J. Huenecke and G. Frohberg: Z. Metallkd.80(1989) 389 397.
28) H. Numakura, T. Ikeda, H. Nakajima and M. Koiwa:Mater. Sci. Eng. A
312(2001) 109117.
29) H. Mehrer: Mater. Trans. JIM37(1996) 12591280.
30) B. Million, J. Ruzichova and J. Vrestal:Czech. J. Phys. B30(1980) 541551.