Munich Personal RePEc Archive
Cracking Down on Bribery
Banuri, Sheheryar and Eckel, Catherine
Development Economics Research Group, World Bank, Department
of Economics, Texas AM University
2015
Online at
https://mpra.ub.uni-muenchen.de/61235/
Cracking Down on Bribery
Sheheryar Banuri a and Catherine Eckel b a
Development Economics Research Group, World Bank 1818 H St NW, MC 3-356, Washington, DC, 20433
b Department of Economics, Texas A&M University 4228 TAMU, College Station, TX, 77845
December 30, 2014
Corresponding Author: Sheheryar Banuri; [email protected]; Development Economics Research Group, World Bank, 1818 H St NW, MC 3-356, Washington, DC, 20433; Tel: 210-394-5515; Fax: 202-522-4881
Abstract
Do crackdowns on bribery impact corrupt behavior in the long run? In this paper we observe the long-run impact of a short-term punishment institution (i.e., a crackdown) on bribery behavior in a lab setting. We conduct lab experiments in two countries with cultures that differ in corruption norms, and which experience very different levels of bribery: the US and Pakistan. Bribery is implemented in the laboratory as a repeated three-player sequential game, consisting of a firm, a government official and a citizen. The design contains three phases: pre-crackdown, crackdown, and post-crackdown. Results show that post-crackdown behavior is not significantly different from the pre-crackdown behavior in either country. We conclude that short-term crackdowns may impact behavior in the short run, depending on the strength of the existing corruption norms in the country. More importantly, in our setting crackdowns are completely ineffective in the long run, as corrupt behavior rebounds to pre-crackdown levels.
Keywords: Bribery, Corruption, Experiments, Punishment, Culture JEL Classification Codes: C91, D73, K42, Z13
1 Introduction
Because corruption is seen as an important impediment to growth, governments
implement a variety of policies to combat its effects. These include citizen advocacy, public
expenditure tracking surveys, independent watchdog agencies, and large-scale corruption
crackdowns. Anti-corruption reforms are costly, in that they require substantial expenditures in
terms of manpower and time, as well as large amounts of political capital, to sustain the
intervention. Most reforms begin with a period of high intensity and scrutiny, but because this
level of activity is not sustainable, it is followed by either a partial or complete retraction. These
temporary “crackdowns” occur very frequently in countries where corruption is an important
issue, suggesting that punctuated corruption crackdowns may be viewed as effective in changing
expectations or norms of behavior.1 However, they may have little long run impact, with corrupt behavior rebounding when the crackdown phase is over. It even is possible that
crackdowns exacerbate the corruption problem by crowding out existing intrinsic motives
against corruption.2
In this paper, we use lab experiments to investigate whether corruption crackdowns
inhibit or exacerbate corruption in the long run. We observe the long-run impact of a short-run
punishment institution (i.e., a crackdown) on one particular type of corrupt transaction: bribery.3 Crackdowns in developing countries usually emerge in conjunction with elections, or with actual
or anticipated changes in political conditions in response to scandals, discontent among the
populace, or attempts to de-legitimize regimes (Brinkerhoff and Kulibaba 1996; Kpundeh, 1999).
These crackdowns contain differing combinations of rhetoric and substance, but share a common
feature that reforms typically break down after an initial period of high impact. For example,
Dininio (2005) presents the case of La Paz, Bolivia, where anti-corruption reforms were
introduced, championed by the mayor. Once the mayor left office, however, corrupt practices
returned in force. Similarly, Di Tella and Schargrodsky (2003) present the case of Buenos Aires,
1
For example, Lui (1983) reports 304 cases in China over a period of just four years resulting from multiple crackdowns on corrupt practices as reported in the media. Di Tella and Schargrodsky (2003) provide an example in Argentina, and Dininio (2005) provides examples in Bolivia, Venezuela, and Italy. In recent times China has signaled intent to crack down by prosecuting a high profile politician (Bo Xilai) due to corruption (Buckley, 2013). 2
A number of studies show that fines can crowd out intrinsic motives for refraining from “bad” behavior, with short- and long-run consequences (e.g., Gneezy and Rustichini 2000). See fn. 6.
3
where a crackdown on corruption decreased corrupt behavior, only for it to rebound once the
intensity of monitoring was lowered.
Aside from Di Tella and Schargrodsky (2003), however, little is known about the effects
of these crackdowns on overall corruption levels due to the absence of data that can be used to
evaluate such interventions. Some evidence suggests that if reforms are not sustained,
re-corruption (or backsliding) occurs (e.g. Dininio, 2005). From the perspective of standard
economic theory, the decision to engage in corrupt behavior is made based on the (extrinsic)
costs and rewards of doing so, leading to the expectation that post-crackdown behavior will
return to pre-crackdown levels (Becker 1968).
Intrinsic motives may play a role in the decision to refrain from corrupt behavior in that
an individual incurs “moral costs” by engaging in corruption (Abbink, 2005, among others).
Recent research on corruption emphasizes non-pecuniary motives in corrupt transactions, and
highlight differences in levels of corruption and response to policy changes across cultures
(Banuri and Eckel 2012; Abbink and Serra 2012). For example, Fisman and Miguel (2007) show
that the number of diplomats with unpaid parking tickets in New York correlates strongly with
the corruption level of their country of origin. Cameron et al. (2009) demonstrate that the
propensity both to practice and to punish corruption differs by culture, and that the variation in
corruption by gender also depends on culture. Barr and Serra (2010) find that individuals
originating from corrupt countries are more likely to engage in corrupt acts in a lab setting.4 The implication of this line of research is that intrinsic motives and norms are important,
and policies should be designed accordingly (Bardhan 2006).5 If intrinsic motives play a role in abstaining from corruption, then even a short-term policy has the potential to impact long-run
behavior in a positive way.Crackdowns may reduce corruption in the long run, if the crackdown
signals a new norm, which is then internalized by the corrupt agents. However, it is also possible
that a crackdown may exacerbate the corruption problem by crowding out “good” motivations.6
4
For theoretical research in this area, see Hauk and Saez-Marti (2002). For empirical work, see Licht et al. (2007). 5
Intrinsic motives and norms are related concepts. A norm of corruption constitutes an expectation of corrupt behavior within the society. Intrinsic motivations depend on social norms: the propensity to engage in corruption is dependent upon the behavior of peers and collective reputations (Tirole 1996). As Bicchieri and Muldoon (2011) point out, policy interventions can serve to change potentially harmful norms that are prevalent in a society. 6
In either case, differences in norms may impact the post-crackdown effect of a policy. In
countries with high levels of corruption and robust norms supporting corruption, the long run
impact of a short-run intervention is likely to be small.
The central question addressed in this study is whether a crackdown has long-term
effects. In a companion study we demonstrate the effectiveness of a punishment regime in
combating bribery (Banuri and Eckel 2014). This paper focuses instead on the post-crackdown
period: Once a crackdown regime is removed, does it have a lasting impact on behavior?
Furthermore, do the effects vary by culture: that is, does the crackdown have different
post-crackdown effects in societies with weak corruption norms versus societies with strong
corruption norms?
Laboratory experiments are particularly useful for assessing policy changes where field
data are limited. This paper tests directly the long-term impact of a short-term punishment
regime in the lab. By using the lab, we implement a “clean test” of a policy change, removing all
other confounding factors that affect outcomes in the field. The use of the lab to study corruption
has its share of critics, however. In particular, there is considerable debate about using
laboratory methods to study complex social phenomena such as corruption and social norms.
Laboratory experiments often implement simplified versions of a phenomenon. Detractors argue
that such simplification is inappropriate, as it removes necessary contextual richness.
Furthermore, inferring long-term impacts in a lab context may also be inappropriate, as remarked
by Gneezy and List (2006). Perhaps the strongest critique of lab studies in this arena is its weak
external validity, particularly when using developed-country subjects. We attempt to account for
this potential shortcoming by using subjects from two countries.
The US and Pakistan are selected as venues for the study due to their differences in
overall perceptions of corruption and experience with bribery.7 US subjects constitute a sample from a society with weak norms of corruption: here petty corruption is relatively rare, and
tolerance for it is low. In contrast, Pakistani subjects constitute a sample from a society with
strong norms of corruption: here corruption (petty corruption in particular, but grand corruption
late to collect their children from a day-care center. They find that the fine increases the number of parents who arrive late, and its subsequent removal fails to restore the previous pattern of behavior. Implementation of the fine crowds out intrinsic motivation, and this effect persists after the fine is removed. See Gneezy et al. (2011) for an excellent review of when and how incentives work to modify behavior. Ryan and Deci (2000) discuss the same issues from a psychological perspective; see Deci at al. (1999) for a meta-analysis of 128 such studies. 7
as well) is frequent and expected (Fisman and Miguel 2007; Kaufmann et al. 2005; Treisman
2007; Transparency International 2011). The experiment uses a repeated game with stable
partners, consisting of three players: a firm, which can initiate a bribe; a government official,
which can provide a favor to the firm; and a citizen, representing a third party that is impacted by
the actions of the government official. We use a within-subjects ABA design, with the first 10
rounds of the experiment having no possibility of punishment (called the “pre-crackdown
phase”). The second 10 rounds introduce the possibility of punishment (“crackdown phase”);
here the citizen can choose to punish either the firm or the government official, or both, at a cost
to themselves. The final 10 rounds are identical to the first; i.e., the punishment institution is
removed and behavior is then observed (“post-crackdown phase”). Our focus is to compare
bribery in the first 10 rounds with the final 10 rounds in order to test for differences after the
crackdown has ended.
Our findings show that crackdowns have some impact on bribery behavior in the short
term, particularly in low corruption settings (while enforcement is active), but behavior returns to
pre-crackdown levels during the post-crackdown phase. These results favor the economists’ view
that corruption is determined by extrinsic factors. Short run institutions are largely ineffective in
altering behavior in the long run in both high and low corruption settings. Sustained legal
enforcement may be necessary to constrain corruption, even in societies with weak norms.
The rest of the paper proceeds as follows. The next section contains a brief review of
recent literature on experiments in corruption, culture, and social norms. In subsequent sections
we describe the experimental design, implementation, and results. The final section concludes.
2 Related Literature
Economists have sought a deeper understanding of the role of norms and culture in
corrupt activity, and several such studies illustrate the value of the lab as a venue for studying
corruption. Abbink et al. (2002) conduct some of the first lab experiments exploring the role of
extrinsic motives on corruption. Using a repeated two-player game consisting of a firm and a
government official, they show that exogenously-imposed punishment (with a very low
probability) significantly reduces subjects’ propensity to engage in corrupt acts. However, if
corruption generates negative externalities for other participants, this does little to discourage
reduces the overall level of bribery. Finally, Abbink and Hennig-Schmidt (2006) compare the
use of loaded language (i.e. the use of the term ‘bribe’) in instructions and find no discernible
difference from a more neutral framing. Our design is informed by this research.8
In a field setting that parallels the experimental design presented here, Di Tella and
Schargrodsky (2003) observe medical supply purchasing behavior of hospital employees before
and after a corruption crackdown in Buenos Aires, Argentina. Using price data on medical
inputs, they argue that higher reported prices constitute embezzlement by employees, and are
able to show that an increase in monitoring has an immediate impact on prices, though the
impact diminishes over time as monitoring decreases. However, prices do not return to
pre-crackdown levels. They show that the long run impact on prices is due to continued monitoring
in the post-crackdown phase, as well as higher compensation for employees (respondents that are
paid higher wages are less likely to purchase inputs at inappropriately high prices), rather than a
change in norms of behavior. This result illustrates the importance of extrinsic incentives:
embezzlement responds to monitoring. However, higher salaries also play an important role, and
in combination with the greater threat of punishment, yield a discernible change in behavior. One
issue with Di Tella and Schargrodsky (2003) is that they use the crackdown as a backdrop to
examine the role of wages in constraining corruption. However, the independent effect of the
crackdown – in terms of raising awareness, removing worst offenders, changing motives and
norms – cannot be identified. We add to the literature on the effect of anti-corruption policies by
isolating the effect of crackdowns on long-run, post-crackdown behavior.
Experiments also examine the impact of intrinsic motives and cultural norms on
behavior. Cameron et al. (2009) conduct a cross-cultural experiment on bribery using subjects
from four countries (Australia, India, Indonesia, and Singapore) in a one-shot three-player
bribery game. Their treatments vary the level of punishment and welfare effects of bribes. They
find similar propensities to engage in corruption across cultures, but different usage of
punishment. Subjects in India are more tolerant of bribes than in Australia (consistent with
corruption norms); however, subjects in Singapore are more tolerant than subjects in Indonesia
(inconsistent with corruption norms). They argue that this inconsistency arises from recent
institutional changes in Indonesia designed to combat corruption. Using a similar framework,
8
The discussion below does not exhaust the experimental literature on corruption. For related results on bribery see
Alatas et al. (2009) show that gender differences in corruption vary by culture. In a related
experimental paper, we show that implementation of punishment varies by culture: Pakistani
subjects punish corrupt behavior less than Americans, and thus identical institutions designed to
curb corrupt behavior produce different effects across cultures (Banuri and Eckel 2014).
Barr and Serra (2010) conduct an experiment using international students at Oxford
University. They find that individuals from more corrupt societies are more likely to engage in
corruption in the lab. They argue that subjects bring their social norms into the lab, and these
norms impact their intrinsic motivation to engage in corrupt activities. These results are similar
to Fisman and Miguel (2007), who show greater parking violations by diplomats from
high-corruption countries. In related research, Bicchieri (2006) provides an excellent overview and
argues that preferences for norm compliance rely on expectations about norms in the population
(empirical expectations), and expectations that others will adhere to the norm (normative
expectations). A norm can then be internalized (i.e. transformed into intrinsic motivation) when
one attributes value in conforming to the norm absent of external inputs.
Another important area of inquiry involves the use of punishment to reduce free riding in
public goods settings. Fehr and Gachter (2000) show that allowing subjects to punish
non-contributors substantially reduces free riding and increases voluntary contributions to public
goods. Herrmann et al. (2008) examine punishment behavior across cultures. Chaudhuri (2011)
provides a review of laboratory research on punishment. It is worth noting that several studies
adopt a similar design to ours, consisting of pre-punishment, punishment and post-punishment
phases. Our design is most similar to Masclet et al. (2003), which examines the role of monetary
vs. non-monetary punishment mechanisms in public goods games. Their main finding is that
non-monetary punishment is as effective in raising contributions as monetary punishment. Most
relevant for us, however, is that they find no differences in contributions in the post-punishment
phase in either case, indicating the importance sustaining an intervention to enhance
contributions. We find results in line with theirs.
3. Experimental Design and Implementation
To test the effects of a crackdown, we construct a three-player repeated bribery game
with fixed partners. The three players are: a firm that makes a discrete choice of whether to offer
makes a discrete choice whether to grant the firm a favor; and a third party (citizen) who is
negatively impacted by the transaction. In the baseline the citizen is passive, but in the
punishment phase he can punish, at a cost, both the official and the firm. Figure 1 presents the
structure of the game.
[Figure 1 here]
Note that all players begin with an initial endowment of 50 tokens; thus the initial
distribution of resources is “fair.” Furthermore, since engaging in corruption reduces total
welfare, this starting point is also the social optimum. To offer a bribe, the firm incurs a cost of
10 tokens; this cost is incurred regardless of whether the bribe is accepted. The official can
observe the offer, and can then choose to accept the bribe and provide a favor to the firm, or to
reject and report the bribe. Providing a favor costs the government official 2 tokens (understood
as the costs of dishonesty, similar to Abbink et al. 2002). The favor benefits the firm by 30
tokens, and hurts the citizen by 35 tokens, yielding a reduction in net welfare. Finally, the
government official can provide a favor, even if a bribe has not been offered; doing so solicits a
bribe by signaling to the firm his willingness to engage in bribery. This is an important aspect of
the repeated game framework; officials can effectively initiate the bribery process even if the
firm does not do so.9 Further note that in the baseline (without punishment) the citizen is passive, and does not have any action that impacts the earnings of the other two players.10 The Nash equilibrium of the stage game is for the firm to bribe, and the official to accept the bribe
and grant a favor.
In the second phase a crackdown is implemented via a punishment institution whereby
citizens can allocate up to 15 tokens to punish either the firm, or the government official, or both.
The punishment technology is linear, and an expenditure of one token by the citizen reduces the
earnings of the target by two tokens. Note that because punishment is costly, the Nash
equilibrium of the stage game remains unchanged, where a bribe is offered and a favor provided,
and punishment is zero.
9
This design choice stems directly from the observation that petty corruption involves fixed relationships. Officials know that there is a distribution of clean and corrupt agents, and often have to signal their willingness to participate in bribe transactions before bribes are offered. Officials can signal their willingness by providing favors in the hopes of attracting bribes at a later date.
10
This form of “third-party punishment” is designed to capture whistle-blowing, the first
step towards prosecuting corruption. It is common in developing countries that a citizen, at some
cost, can take the first move in initiating a prosecution that can result in fines or imprisonment
for the parties to the corrupt transaction.11 The cost of punishment reflects the short-term burden of the whistle-blower. Reporting the transaction may yield benefits, but likely only in the long
run. In most countries, there is no immediate benefit to reporting a bribe, which is why amnesty
programs for those who report paying a bribe have been proposed (Basu, 2011).12
Furthermore, our design allows citizens to punish firms and officials regardless of their
actual behavior. This design choice was made in part for simplicity, to avoid imposing rules on
citizens about when they can punish. In addition, the fixed-partners design, which reflects the
repeated interaction inherent in most petty corruption, means that punishment can be effective
whenever it is implemented. This mimics a situation where citizens can report and punish
wrongdoing in a repeated interaction at any point. Finally, since subjects are in fixed triads and
develop reputations, punishment has strategic value, even though it does not change the Nash
equilibrium in monetary payoffs.13
At the beginning of the experiment subjects are told that they will engage in three tasks,
and that all earnings accumulated throughout the session will be paid to them in cash at the end
of the session. First is the pre-crackdown phase, which consists of ten rounds where the citizen’s
role is passive: his payoffs are determined by the actions of the other two payers. Second is the
crackdown phase, consisting of ten rounds where the citizen is given the option to punish the
other two players. While subjects know that the experiment will continue for multiple rounds,
the instructions for the second phase are revealed only at the end of the first phase (and
instructions for the third phase revealed only at the end of the second phase). The third,
post-crackdown phase consists of ten rounds, and is identical to the first phase. A quiz is conducted
11
An alternative way to model punishment is via institutional punishment (as in Abbink et al., 2002), where detection is probabilistic, and the penalty is implemented automatically (by the experimenter) conditional on detection. See Fehr and Fischbacher (2004) for an experimental study of third-party punishment across cultures. 12
The current use of internet technology (for example, corruption reporting websites such as “ipaidabribe.com”) is designed to reduce the costs of reporting for the citizens.
13
In our model (as in the real world), bribery is risky. To overcome this, officials sometimes have relationships with specialists whose sole job is to mediate bribery transactions with citizens. An example of this is discussed in
after each set of instructions to gauge comprehension of the task. Since partners are fixed
throughout the session, subjects are reminded of this at the beginning of each phase.
Note that we use ‘loaded’ language – describing the players as firm, official and citizen –
to increase the probability of triggering social norms; however we do not use words with an
illegal connotation (such as “bribe”). Loaded language enhances subject understanding of the
environment of the experiment, but avoiding stronger terms protects against negative framing
that might yield experimenter demand effects.
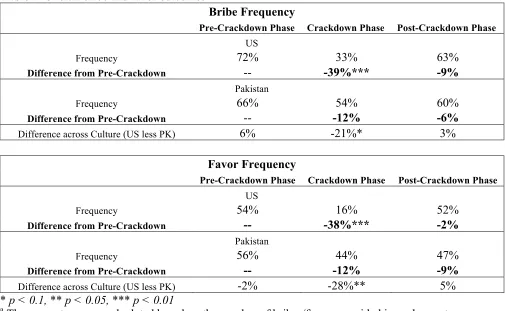
Sessions were conducted in February and March 2010. Samples are drawn from each of
two countries that vary in the overall level of corruption: In the US, 96 undergraduate students
were recruited at the University of Texas at Dallas; in Pakistan, 123 undergraduate students were
recruited at the Institute of Business Administration in Karachi. Table 1 describes the samples in
the two locations. Game instructions are provided in the online appendix. All sessions were
conducted in English.14 In each session, subjects were randomly assigned to the role of firm, government official, or citizen. The roles for each subject remained fixed throughout the session.
[Table 1 here]
In the final stage of each session, subjects were asked to complete a survey containing
questions about their demographic and socioeconomic status, as well as questions relating to the
experiments themselves. At the end of the session, subjects were paid their cumulative earnings,
including a show up fee of $5 in the US and PKR 100 in Pakistan. The exchange rate for tokens
was $1 USD for 100 tokens in the US and PKR 30 for every 100 tokens in Pakistan, such that for
the most conservative response (no bribe, no favor and no punishment), each subject would earn
$10 USD. Payoffs were calibrated across the two countries based on the cost of two lunches at
local restaurants that students at each location were known to frequent. The instructions and
game were computerized using the z-Tree application developed by Fischbacher (2007).
4. Results
Table 2 provides a summary of the overall bribes and favors in the experiment. In the
pre-crackdown phase (rounds 1 - 10), bribes are offered in the US in 72 percent of decisions, and
14
in 66 percent of decisions in Pakistan (the difference is not significant: p=0.60).15 During the crackdown, US bribes are significantly lower, dropping to approximately 33 percent, while in
Pakistan they are relatively stable at 54 percent (difference between US and Pakistan in
crackdown phase: p<0.10). This reduction (from pre-crackdown to crackdown phase) is
significantly lower in the US (p<0.01), but not in Pakistan (p=0.12). Finally, in the
post-crackdown phase, US bribes rebound back to 63 percent (a 9 percent reduction from
pre-crackdown: p=0.27), while Pakistan bribes rebound back to 60 percent (a 12 percent reduction
from pre-crackdown: p=0.44). Post-crackdown bribes are not significantly different between the
US and Pakistan (p=0.84).
Favors are granted in the US at a rate of 54 percent during the pre-crackdown rounds, not
significantly different from 56 percent in Pakistan (p=0.87). During the crackdown phase, a
substantial reduction in favors is observed in the US (from 54 to 16 percent, p<0.001). In
Pakistan, however, a relatively small reduction is observed during the crackdown (from 56 to 44
percent, p=0.12). In this phase, favors are significantly lower in the US than in Pakistan
(p<0.05). Post crackdown, however, favors rebound for the US sample back up to 52 percent
(p=0.82). For the Pakistan sample, favors rebound to 47 percent (p=0.23). In addition, favors in
the post crackdown phase are not significantly different across cultures (p=0.67).
[Table 2 here]
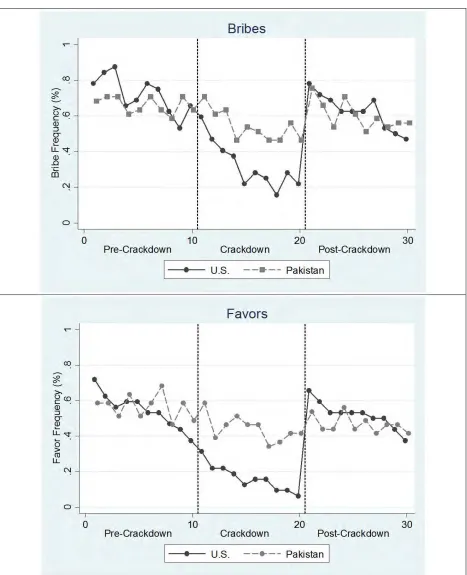
Figure 2 illustrates the overall levels of bribes and favors across the two cultures. This
figure tells the main story of the results. Pre-crackdown behavior is quite similar across the two
countries, in contrast to previous studies (Cameron et al. 2009; Barr and Serra, 2010).16 During the crackdown phase, both bribes and favors fall in both countries, but the US levels are below
those of Pakistan. Most importantly, regardless of what happens during the crackdown, bribery
rebounds sharply at the end of the crackdown phase. These results point to the ineffectiveness of
crackdowns in constraining corrupt behavior in the long run.
15
Unless otherwise indicated, all non-parametric tests between the US and Pakistan are 2 sample, 2-tailed proportions tests. Non-parametric tests between phases are one-sample 2-tailed proportions tests. Since this is a repeated game, treating each decision as independent is inappropriate. Therefore, the proportions tests are conducted using each subject as a single observation, rather than each decision as a single observation. 16
[Figure 2 here]
4.1 Pre- and Post-Crackdown Comparison of Bribes and Favors
Next, we turn to the main question of our study: comparing behavior in the
pre-crackdown and post pre-crackdown phases with each other. We observed that the beginning of the
post-crackdown phase shows a large break with the overall trend in the experiment. We turn our
attention to whether corruption increases or decreases once punishment institutions are removed
(in the post-crackdown era).
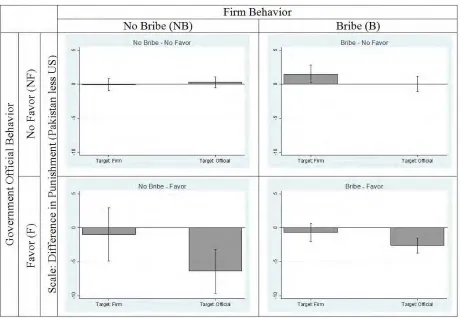
Figure 3 presents bribe frequencies and compares behavior in the post-crackdown phase
with behavior in the pre-crackdown phase for the US (top left) and Pakistan (top right). Figure 3
also presents favor frequencies in the pre- and post-crackdown phases for the US (bottom left)
and Pakistan (bottom right). What is striking in these figures is that the overall trend in bribes
and favors is virtually identical between the phases.
[Figure 3 here]
To formally test differences between pre- and post-crackdown bribes and favors, we
estimate random-effects probit models on the probability of offering a bribe in the US and
Pakistan separately.17 We regress the dummy variable for offering a bribe (equaling 1 if a bribe was offered) on dummy variables for the crackdown and post-crackdown phases. We use the
round number (from 1 to 10) to account for the trend in each phase separately.18 We also control for basic demographic information (gender and age). Estimation results are shown in table 3:
model 1 reports the results for the US, while model 2 does the same for Pakistan.19 If bribery responds purely to incentives, then we should observe no difference in the post-crackdown phase
relative to the pre-crackdown phase. However, if intrinsic motives to abstain from corruption are
important, then the post-crackdown phase could be affected by the crackdown. If such motives
are crowded out, then we should observe an increase in bribery in the post-crackdown phase;
17
Estimates are robust to using fixed effects logit models (not shown). 18
We use the round numbers for each phase separately so as to compare the intercepts and slopes from the post-crackdown phase to the intercept and slope in the pre-post-crackdown phase directly. The online appendix presents the alternate specification under the assumption of a common trend with structural breaks. We are grateful to an anonymous referee for pointing out this alternate specification.
19
alternatively, if punishment signals a new norm, then we should observe a reduction in bribes in
the post-crackdown phase.
[Table 3 here]
The regression results confirm what we observe in the figures. In the post-crackdown
phase, bribe behavior is not significantly different from the pre-crackdown phase, either in the
US (p=0.34), or in Pakistan (p=0.81). During the Crackdown phase, however, bribes are
significantly lower than in the pre-crackdown phase by about 44% overall (p<0.01). This is not
true for Pakistan, however, where we observe an overall decline of just 6% (p=0.50). In the US,
the probability of offering a bribe declines over time at a rate of 3.8% per round (p<0.01),20 and is not significantly different in either the crackdown or post-crackdown phases (p=0.23 and
p=0.74 respectively).21 In Pakistan, the probability of offering a bribe declines at a rate of 0.88% per round, but it is not significantly different from zero (p=0.39). Further, the probability is not
significantly different in the crackdown and post-crackdown phases (p=0.14 and p=0.20
respectively).
Favors also display a virtually identical pattern to bribes. Table 3 reports favor results for
the US and Pakistan, using the same model specification as above, focusing on government
official behavior. Again, both in the US (p=0.31) and Pakistan (p=0.26), post-crackdown
probability of providing a favor is not significantly different from the pre-crackdown probability
overall. We observe a significant reduction in the probability in the crackdown phase for the US
(a reduction of 45%; p<0.01), but not for Pakistan (p=0.32). In the US, favor probability
declines over time at the rate of 4.1% per round (p<0.01), and does not significantly differ for the
crackdown and post-crackdown rounds (p=0.73 and p=0.50 respectively). In Pakistan, the
20
Changes in probability were calculated using marginal effects (not reported). 21
What would explain the reduction in the probability of offering a bribe or favor over time in the US? This is a
probability of providing a favor is also declining, but it is not significant overall (p=0.59), or in
the crackdown and post-crackdown phases (p=0.25 and p=0.64 respectively).
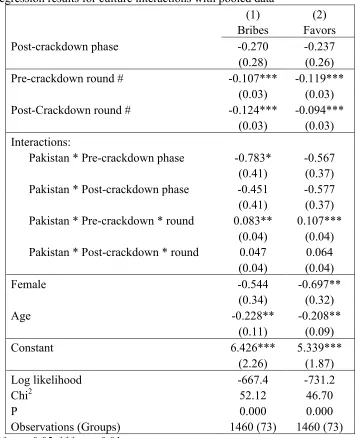
One aspect of this analysis is to test the effectiveness of crackdowns across the two
settings. In order to do this, we pool the US and Pakistan samples and estimate random-effects
probit models on the probability of offering a bribe (model 1) and the probability of providing a
favor (model 2), for just the pre- and post-crackdown phases. 22 We add Pakistan interaction terms for the intercepts and slopes of the pre- and post-crackdown phases. Thus, as before, we
directly compare behavior in the pre- and post-crackdown phases, but across cultures. We
regress the dummy variable for offering a bribe (equaling 1 if a bribe was offered) on a dummy
variable for the post-crackdown phase. We use the round number (from 1 to 10) to account for
the trend in each phase separately, and interact a dummy variable for Pakistan with each of the
variables above. We also control for basic demographic information (gender and age). The
results are presented in table 4. Crucially, we see that the pre-post crackdown differences in
intercepts and slopes are not significantly different between the two countries (intercept
difference-in-difference: p=0.33; slope difference-in-difference: p=0.85).
These results confirm the incentives hypothesis, that crackdowns are ineffective in
sustaining reductions in bribery regardless of intrinsic motives or norms. There are a few
interesting differences, however. First, the initial probability of offering a bribe is significantly
higher in the US than in Pakistan (p<0.10). However, while the probability of a bribe
significantly decreases over time in the US, it significantly increases in Pakistan, relative to the
US (p<0.05), and is relatively stable overall (i.e. not significantly different from zero: p=0.40).
This higher initial probability of bribe offers is puzzling since overall levels of corruption in
Pakistan are greater than in the US. Our data do not allow us to address this question.
[Table 4 here]
Overall, the results show an interesting pattern. First, in the US, the crackdown appears
to have an immediate effect on bribes and favors. In addition to this, we observe sharp rebounds
in bribe and favor behavior once the crackdown is removed. In Pakistan neither the trend, nor
the crackdown, point to a reduction in bribes or favors. These results indicate that once the
crackdown is alleviated, subjects return to the pre-crackdown levels of bribes and favors.
22
4.2 Crackdown Impact: Punishment, Bribes and Favors
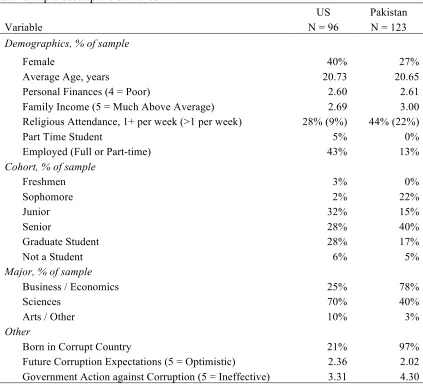
Despite the fact that punishment is costly to the punisher, we see a considerable amount
of punishment in the experiment in both countries. Punishment behavior during the crackdown
phase across the two countries is described in figure 4, which shows average differences in
punishment between countries for four possible combinations of bribes and favors. The figure
contains the difference in punishment expenditure between US and Pakistani subjects, and shows
that while punishment of firms is not significantly different between the two countries, subjects
in Pakistan punish government officials at significantly lower levels when favors have
occurred.23 Punishment of government officials is lower in Pakistan when a favor has been
granted, indicating that officials are less likely to be held responsible for their corrupt behavior.
[Figure 4 here]
In addition, figure 5 presents expenditure on firm and official punishment separately for
the US and Pakistan and shows that punishment declines over time during the crackdown phase
as firms and officials reduce their corrupt practices.
[Figure 5 here]
During the crackdown phase, punishment directly and indirectly affects corrupt behavior,
and contributes to the impact of the crackdown.24 To test the effectiveness of both direct and indirect punishment, we conduct random effects OLS regressions on the change in bribes and
favors (from round t-1 to round t) on punishment spending by the citizen in the previous round.
To test for cross-cultural differences in responsiveness to punishment, we add variables for
Pakistan (dummy variable equaling 1 if the subject is located in Pakistan) and interactions terms
of culture with previous punishment behavior. The results are presented in Table 5.
[Table 5 here]
This table shows that firm punishment in the previous round has a negative and
significant impact on the change in bribing behavior across rounds, with firms less likely to offer
a bribe as a response. Similarly, tokens spent punishing the official also yield changes in
23
One exception to the difference in firm punishment is that Pakistani subjects punish firms approximately 1.5 tokens more than US subjects when a bribe is offered, but not accepted by the official. While we have little evidence of why this occurs, we conjecture that this may be due to differences in how subjects perceive the
confiscation of the bribe. US subjects may view the confiscation as punishment, while Pakistanis may not view that as punishment, and feel the need to further reprimand the firms.
24
behavior: official punishment in the previous round has a negative and significant impact on the
change in favor provision, with officials less likely to provide favors. Interestingly, tokens spent
on firm punishment also lead to a change in favor provision, independent of official punishment;
providing an indirect effect through reduced bribing. Importantly, however, while higher
spending on punishment significantly reduces the propensity to engage in bribes/favors in
subsequent rounds, this propensity does not vary by culture. That is, Pakistani firms/officials are
no more or less sensitive to punishment than US firms/officials (as noted by the insignificant
coefficients on the interaction terms in the table). Responsiveness to punishment does not vary
by culture. Therefore, the main reason for the differential impact of punishment institutions
across cultures (replicating findings from Banuri and Eckel, 2014) is that Pakistanis punish
officials significantly less than in the US. Punishment of officials yields a reduction in favors,
and subsequently, a reduction in bribes.
Overall, we find stark rebounds of both bribes and favors in the US and Pakistan, which
indicates that subjects largely return to similar levels of bribery post-crackdown. This suggests
that engaging in bribery (at least in the time horizon of our experiment) is determined largely by
incentives, and that intrinsic motives (through cumulative moral costs) may play a role in
reducing the likelihood of engaging in bribes, but these motives do not respond to crackdowns.
We conclude that temporary policy interventions do not alter bribes in the long run. Importantly,
however, a temporary regime shift does not exacerbate the corruption problem. This indicates
that, while crackdowns may not have a lasting positive impact, they may not have detrimental
impacts either.
5. Conclusion
We address the question of how crackdowns on bribery might interact with social norms
to exacerbate the corruption problem. We implement corruption norms by drawing samples
from two countries with very different societal levels of corruption. Our results indicate that
bribery is largely affected by extrinsic incentives – direct financial consequences. Crackdowns
(i.e. punishment institutions) can be implemented in a way to shift incentives away from corrupt
behavior, but need to be sustained in order to have a long-term impact. Without enforcement, we
find that bribery returns back to pre-crackdown levels. Furthermore, the difference between pre-
impact in a repeated game framework. As a matter of policy, our results underline the need for
sustainable policy tools to combat corruption. Proponents of corruption crackdowns may argue
that each intervention changes corruption norms in subtle ways, and that repeated crackdowns
may eventually yield differences in overall corruption levels. We find very little evidence of any
impact of motives and norms.
One potential factor that our study cannot address is the effect crackdowns have on
selection. As a reviewer correctly points out, crackdowns may remove the outliers from the
corrupt pool, leaving the relatively “cleaner” individuals, and thus a relatively “cleaner” system.
These are testable ideas, but outside the scope of this paper. These selection issues are
interesting areas for future research.
Overall, these results are good news for policy-makers. First, if these lab results extend to
the field, they suggest that different anti-bribery policies can be tested in a field setting without
worrying about lasting negative effects. They also suggest that repeated crackdowns are not
likely to exacerbate the corruption problem. However, the results underline the importance of
sustainable institutions in reducing bribery. A key feature of this study is that it identifies the
effects of a temporary, unsustained policy, which (to our knowledge) has not been addressed in
the literature.
Our results find that corruption norms may be purely incentive-driven, and not based on
ingrained values. From a policy standpoint, this suggests that not only can we trial different
policy mechanisms without lasting effects, but also that individuals are not intrinsically
motivated to bribe, but rather respond to expectations and extrinsic factors. This lends credence
to the economist’s view of the importance of extrinsic motives in corruption settings. In effect,
this provides some good news in that corruption can be combated as long as institutional
Acknowledgements
We are indebted to Klaus Abbink, Rachel Croson, Reuben Kline, Sherry Xin Li, Angela de
Oliveira, Elizabeth Pickett, Wendy Mak, Eric McLester, Quoc Tran, participants of the
Economic Science Association meetings in Tucson, AZ, and participants of the workshop on
conflict experiments in Rennes, FR. The paper was substantially improved during the editorial
process. Funding was provided by the National Science Foundation (NSF SES-0921884). Any
References
Abbink K (2004) Staff rotation as an anti-corruption policy: an experimental study. Europ J Polit Economy 20:887-906
Abbink K (2005) Fair salaries and the moral costs of corruption. In: Kokinov B (ed) Advances in Cogntive Economics. NBU, Bulgaria
Abbink K, Hennig-Schmidt H (2006) Neutral versus loaded instructions in a bribery experiment. Exper Econ 9:103-121
Abbink K, Irlenbusch B, Renner E (2002) An experimental bribery game. J Law Econ Organ 18:428-454 Abbink K, Serra D (2012) Anticorruption policies: Lessons from the lab. Research in Experimental
Economics 15:77-115
Alatas V, Cameron L, Chaudhuri A, Erkal N, Gangadharan L (2009) Gender, culture, and corruption: Insights from an experimental analysis. Southern Econ J 75:663-680
Armantier O, Boly A (2012) On the external validity of laboratory experiments on corruption. Research in Experimental Economics 15:117-144
Azfar O, Nelson Jr W (2007) Transparency, wages, and the separation of powers: An experimental analysis of corruption. Public Choice, 130:471-493
Banuri S, Eckel C (2012) Experiments in culture and corruption: A review. In: Serra D, Wantchekon L (eds.) New Advances in Experimental Research on Corruption 15. Emerald Group, New York, pp. 51-76
Banuri S, Eckel C (2014) The Effects of Sanctions on Bribery: US Versus Pakistan. Working Paper, Texas A&M University
Bardhan P (2006) The economist’s approach to the problem of corruption. World Devel 34:341-348 Barr A, Lindelow M, Serneels P (2009) Corruption in public service delivery: An experimental analysis. J
Econ Behav Organ 72:225-239
Barr A, Serra D (2010) Corruption and culture: An experimental analysis. J Public Econ 94:862-869 Basu K (2011) Why, for a class of bribes, the act of giving a bribe should be treated as legal. India
Ministry of Finance Report
Becker G (1968) Crime and punishment: An economic approach. J Polit Economy 76:169-217 Bertrand M, Djankov S, Hanna R, Mullainathan S (2007) Obtaining a driver's license in India: an
experimental approach to studying corruption. Quart J Econ 122:1639-1676
Bicchieri C (2006) The Grammar of Society: The Nature and Dynamics of Social Norms. Cambridge: Cambridge University Press
Bicchieri C, Muldoon R (2011) Social norms. In: Zalta E (ed) The Stanford Encyclopedia of Philosophy, 2011 edn. Stanford, California
Brinkerhoff D, Kulibaba N (1996) Perspectives on participation in economic policy reform in Africa. Studies in Comparative International Development 31:123-151
Buckley C (2013) With Official’s Conviction, China Calls Attention to Its Crackdown on Corruption. New York Times. http://www.nytimes.com/2013/09/23/world/asia/with-officials-conviction-china-calls-attention-to-graft-crackdown.html. Accessed 18 December 2013
Chaudhuri A (2011) Sustaining cooperation in laboratory public goods experiments: a selective survey of the literature. Exper Econ 14:47-83
Deci E, Koestner R, Ryan R (1999) A meta-analytic review of experiments examining the effects of extrinsic rewards on intrinsic motivation. Psychological Bulletin 125:627-668
Di Tella R, Schargrodsky E (2003) The role of wages and auditing during a crackdown on corruption in the city of Buenos Aires. J Law Econ 46:269-292
Dininio P (2005) The risks of recorruption. In: Spector B (ed.) Fighting Corruption in Developing Countries: Strategies and Analysis. Kumariain, Colorado
Fehr E, Fischbacher U (2004) Third party punishment and social norms. Evolution and Human Behavior 25:63-87
Fehr E, Gachter S (2000) Cooperation and punishment in public goods experiments. Amer Econ Rev 90:980-994
Fischbacher U (2007) Z-tree: Zürich toolbox for readymade economic experiments. Exper Econ 10:171‐ 178
Fisman R, Miguel E (2007) Corruption, norms, and legal enforcement: Evidence from diplomatic parking tickets. J Polit Economy 115:1020-1048
Frey B, Jegen R (2001) Motivation crowding theory: A survey of empirical evidence. J Econ Surveys 15:589-611
Gneezy U, List J (2006) Putting behavioral economics to work: Testing for gift exchange in labor markets using field experiments. Econometrica 74:1365-1384
Gneezy U, Meier S, Rey-Biel P (2011) When and why incentives (don't) work to modify behavior. J Econ Perspect 25:191-209
Gneezy U, Rustichini A (2000) A fine is a price. J Legal Stud 29:1-17
Hauk E, Saez-Marti M (2002) On the cultural transmission of corruption. J Econ Theory 107:311-335 Herrmann B, Thoni C, Gachter S (2008) Antisocial punishment across societies. Science 319:1362-1367.
doi: 10.1126/science.1153808
Jain A (2001) Corruption: a review. J Econ Surveys 15:71–121
Kaufmann D, Kraay A, Mastruzzi M (2005) Governance matters IV: governance indicators for 1996-2004. World bank policy research working paper 3630
Kpundeh S (1999) The fight against corruption in Sierra Leone. In: Stapenhurst R, Kpundeh S (eds) Curbing Corruption: Toward a Model for Building National Integrity. World Bank, District of Columbia, pp. 207-234
Licht A, Goldschmidt C, Schwartz S (2007) Culture rules: The foundations of the rule of law and other norms of governance. J Compar Econ 35:659-688
Liu A (1983) The politics of corruption in the People's Republic of China. Amer Polit Sci Rev 77:602-623
Masclet D, Noussair C, Tucker S, Villeval M (2003) Monetary and non-monetary punishment in the voluntary contributions mechanism. Amer Econ Rev 93:366-380
Ryan R, Deci E (2000) Intrinsic and extrinsic motivations: Classic definitions and new directions. Contemporary educational psychology 25:54-67
Tirole J (1996) A theory of collective reputations (with applications to the persistence of corruption and to firm quality). Rev Econ Stud 63:1-22
Treisman D (2007) What have we learned about the causes of corruption from ten years of cross-national empirical research? Annual Review of Political Science 10:211-244
Fig. 2 Short and long run effects of punishment on bribes (top) and favors (bottom) across cultures
US Pakistan
Bribes
[image:25.612.60.553.70.439.2]Favors
Fig. 3 Pre-crackdown and post-crackdown bribe and favor frequency for US and Pakistani subjects. Graphs compare behavior in pre-crackdown phase to the post-crackdown phase.
[image:26.612.77.538.123.441.2]
Fig. 5 Citizen expenditure (in tokens) on punishment over time during the crackdown phase
Table 1 Sample descriptive statistics
US Pakistan
Variable N = 96 N = 123
Demographics, % of sample
Female 40% 27%
Average Age, years 20.73 20.65
Personal Finances (4 = Poor) 2.60 2.61 Family Income (5 = Much Above Average) 2.69 3.00 Religious Attendance, 1+ per week (>1 per week) 28% (9%) 44% (22%)
Part Time Student 5% 0%
Employed (Full or Part-time) 43% 13%
Cohort, % of sample
Freshmen 3% 0%
Sophomore 2% 22%
Junior 32% 15%
Senior 28% 40%
Graduate Student 28% 17%
Not a Student 6% 5%
Major, % of sample
Business / Economics 25% 78%
Sciences 70% 40%
Arts / Other 10% 3%
Other
Born in Corrupt Country 21% 97%
Table 2 Overall bribe and favor outcomes
Bribe Frequency
Pre-Crackdown Phase Crackdown Phase Post-Crackdown Phase
US
Frequency 72% 33% 63%
Difference from Pre-Crackdown -- -39%*** -9%
Pakistan
Frequency 66% 54% 60%
Difference from Pre-Crackdown -- -12% -6%
Difference across Culture (US less PK) 6% -21%* 3%
Favor Frequency
Pre-Crackdown Phase Crackdown Phase Post-Crackdown Phase
US
Frequency 54% 16% 52%
Difference from Pre-Crackdown -- -38%*** -2%
Pakistan
Frequency 56% 44% 47%
Difference from Pre-Crackdown -- -12% -9%
Difference across Culture (US less PK) -2% -28%** 5%
* p < 0.1, ** p < 0.05, *** p < 0.01
a
The percentages are calculated based on the number of bribes/favors provided in each country, divided by the total rounds where bribes and favors were possible.
b
Statistics tests between phases are one-sample 2-tailed proportions tests, and between the US and Pakistan are 2 sample, 2-tailed proportions tests. Since this is a repeated game, treating each decision as independent is inappropriate. Therefore, the proportions tests are conducted using each subject as a single observation, rather than each decision as a single observation.
Table 3 Regression results for bribe and favor activity in the US and Pakistan
(1) (2) (3) (4)
Bribes Favors
US PK US PK
Crackdown phase (D) -1.155*** -0.159 -1.494*** -0.227 (0.26) (0.23) (0.27) (0.23) Post-crackdown phase (D) -0.259 0.057 -0.259 -0.256 (0.27) (0.24) (0.26) (0.23) Round # -0.097*** -0.023 -0.113*** -0.014 (0.03) (0.03) (0.03) (0.03) Round # -0.052 -0.055 -0.016 -0.042 X Crackdown phase (0.04) (0.04) (0.05) (0.04) Round # -0.014 -0.049 0.028 -0.017 X Post-crackdown phase (0.04) (0.04) (0.04) (0.04) Female 0.254 -0.841** -0.809** -0.492 (0.40) (0.37) (0.39) (0.44) Age 0.074 -0.415*** -0.078 -0.335** (0.12) (0.12) (0.10) (0.14) Constant -0.335 9.534*** 2.626 7.362** (2.51) (2.58) (2.07) (2.92) Log likelihood -466.0 -583.1 -438.3 -607.0 Chi2 165.69 48.88 169.64 33.14
P 0.000 0.000 0.000 0.000
Observations (Groups) 960 (32) 1230 (41) 960 (32) 1230 (41)
* p < 0.1, ** p < 0.05, *** p < 0.01
a
Random effects Probit regression estimates. Table reports marginal effects with group-level clustered standard errors in parentheses.
b
For models 1 and 2, the dependent variable takes on a value of 1 if the firm offered a bribe and 0 otherwise. For models 3 and 4, the dependent variable takes on a value of 1 if the
government official provided a favor, and 0 otherwise. Models 1 and 3 are for US subjects, while models 2 and 4 are for Pakistan.
Table 4: Regression results for culture interactions with pooled data
(1) (2)
Bribes Favors
Post-crackdown phase -0.270 -0.237
(0.28) (0.26)
Pre-crackdown round # -0.107*** -0.119***
(0.03) (0.03)
Post-Crackdown round # -0.124*** -0.094***
(0.03) (0.03)
Interactions:
Pakistan * Pre-crackdown phase -0.783* -0.567
(0.41) (0.37)
Pakistan * Post-crackdown phase -0.451 -0.577
(0.41) (0.37)
Pakistan * Pre-crackdown * round 0.083** 0.107***
(0.04) (0.04)
Pakistan * Post-crackdown * round 0.047 0.064
(0.04) (0.04)
Female -0.544 -0.697**
(0.34) (0.32)
Age -0.228** -0.208**
(0.11) (0.09)
Constant 6.426*** 5.339***
(2.26) (1.87)
Log likelihood -667.4 -731.2
Chi2 52.12 46.70
P 0.000 0.000
Observations (Groups) 1460 (73) 1460 (73)
* p < 0.1, ** p < 0.05, *** p < 0.01
a
Random effects probit estimates. Table reports coefficients with group-level clustered standard errors in parentheses.
b
Table 5 Regression results for changes in bribes and favors during the crackdown phase
(1) (2)
Change in Bribes
Change in Favors
Round # 0.003 -0.004
(0.01) (0.01)
Firm punishment -0.019** -0.024*** (previous round) (0.01) (0.01) Government official punishment -0.010 -0.054*** (previous round) (0.01) (0.01)
Pakistan 0.045 0.021
(0.05) (0.04)
Interactions:
Pakistan * Firm punishment -0.017 0.007 (previous round) (0.01) (0.01) Pakistan * Government official punishment 0.016 0.010 (previous round) (0.01) (0.01)
Female 0.007 -0.058
(0.04) (0.04)
Age 0.005 0.004
(0.01) (0.01)
Constant -0.130 0.015
(0.29) (0.21)
Within R2 0.059 0.208
Between R2 0.011 0.086
Overall R2 0.046 0.159
P 0.000 0.000
Observations (Groups) 657 (73) 657 (73)
* p < 0.1, ** p < 0.05, *** p < 0.01
a
Random effects OLS regressions. Table reports coefficients with group-level clustered standard errors in parentheses.
b
Dependent variable for model 1 is the change in bribing from the previous round (t-1) to the current round (t). Hence the variable takes on a value of 0 if no change in behavior is observed; -1 if subject bribed in the previous round but did not in this round; and +-1 if subject did not bribe in the previous round but bribed in this round. Dependent variable for model 2 is the change in favors from the previous round (t-1) to the current round (t).
Online Appendix:
Cracking Down on Bribery, Social Choice and Welfare
Sheheryar Banuri and Catherine C. Eckel
Corresponding Author: Sheheryar Banuri; [email protected]; Development Economics Research Group, World Bank, 1818 H St NW, MC 3-356, Washington, DC, 20433; Tel: 210-394-5515; Fax: 202-522-4881
[image:33.612.72.540.224.503.2]Appendix 1: Additional analysis.
Table A1 Regression results for bribes and favors in the pre-crackdown phase
(1) (2) (3) (4)
Bribes Favors
US PK US PK
Round # -0.196* 0.057 0.112 0.007
(0.12) (0.10) (0.13) (0.09)
Favor (previous round) 0.553 0.243
(0.40) (0.33)
Bribe (current round) 3.210*** 1.586***
(0.13) (0.33)
History
Number of Successful Bribes
(Cumulative) 0.005 -0.264 -0.503** -0.076
(0.24) (0.21) (0.22) (0.16)
Log Likelihood -75.2 -100.1 -78.1 -117.0
Chi2 14.46 2.32 69.21 26.04
P 0.002 0.508 0.000 0.000
Observations (Groups) 207 (23) 234 (26) 270 (27) 300 (30)
* p < 0.1, ** p < 0.05, *** p < 0.01
a
Fixed effects logit regressions. Table reports coefficients with group-level clustered standard errors in parentheses. b
For models 1 and 2, the dependent variable takes on a value of 1 if the firm offered a bribe and 0 otherwise. For models 3 and 4, the dependent variable takes on a value of 1 if the government official provided a favor, and 0 otherwise. Models 1 and 3 are for US subjects, while models 2 and 4 are for Pakistan.
c Due to no variation in the dependent variable (i.e. subject always/never offered a bribe/favor), 9 groups (90
observations) were dropped from model 1, 15 (150 obs.) groups from model 2, 5 (50 obs.) groups from model 3, and 11 (110 obs.) groups from model 4.
Table A2 Cross-cultural comparisons of punishment
(1) (2) (3) (4)
Firm Punishment Government Official Punishment
[image:33.612.78.538.643.715.2](0.32) (0.59) (0.28) (0.51)
No bribe - Favor 2.150 2.801 11.820*** 11.860***
(1.87) (1.94) (1.55) (1.56)
Bribe - No favor 1.302** 1.055** 0.021 0.035
(0.51) (0.51) (0.42) (0.43)
Bribe - Favor 3.212*** 3.235*** 5.292*** 5.351***
(0.58) (0.63) (0.49) (0.50)
Pakistan X No bribe - No favor -0.068 -0.124 0.287 0.333
(0.47) (0.46) (0.40) (0.40)
Pakistan X No bribe - Favor -1.001 -1.389 -6.372*** -6.258***
(2.00) (2.00) (1.65) (1.66)
Pakistan X Bribe - No favor 1.500** 1.617** 0.040 0.199
(0.68) (0.66) (0.57) (0.56)
Pakistan X Bribe - Favor -0.690 -0.848 -2.595*** -2.564***
(0.66) (0.65) (0.56) (0.54)
Alternate target punishment -0.079* -0.059*
(0.04) (0.03)
Round # -0.143*** -0.046
(0.04) (0.03)
Total bribes in pre-crackdown -0.109 0.044
(0.11) (0.09)
Total favors in pre-crackdown 0.134 -0.051
(0.10) (0.09)
Overall R2 0.121 0.134 0.267 0.267
Between R2 0.208 0.182 0.226 0.198
Within R2 0.093 0.120 0.296 0.306
P 0.000 0.000 0.000 0.000
Observations 730 730 730 730
* p < 0.1, ** p < 0.05, *** p < 0.01
a Random effects regressions. Group-level clustered Standard errors in parentheses.
b
All models are restricted to the crackdown phase. Model 1 and 2 use citizen expenditure on firm punishment as their dependent variable. Mode1 1 controls for bribe and favor behavior in the triad, while model 2 adds controls for punishment of government official, period, and history. Models 3 and 4 estimate the same specification (as in models 1 and 2) for citizen expenditure on government official punishment.
c
Models 2 and 4 use punishment of the alternative target as a control. This is because citizens have a combined fixed budget of 15 tokens for punishing both the firm and the official.
Appendix 2: Alternative specification for Table 3 and related discussion.
In the paper, table 3 estimates a random effects probit model for bribes and favors in all rounds.
directly tested against each other. As an anonymous referee points out, an alternate specification
is to replace the round variable with another which ranges from 1 to 30, to capture the entire
trend of the experiment (similar to structural break analysis). This approach tests for structural
breaks, under the assumption of a consistent trend across phases. In this appendix, we estimate
the model similar to table 3 in the paper, but with the round variable specified as above. This
allows us to estimate the change in probability from the end of each round to the beginning of the
subsequent round.1
Table A3 below estimates a random effects probit model of the probability of offering a
bribe in the US and in Pakistan (models 1 and 2 in the table). We regress the dummy variable for
offering a bribe (equal to 1 if a bribe was offered) on dummy variables for the crackdown and
post-crackdown phases. We use the round number (from 1-30) to account for any trend, as well
as interactions between the phases and the round number. Finally, we control for basic
demographic characteristics (gender and age).
Taking the US data first, we observe what appears to be a significant negative trend over
the course of the experiment, with each successive round reducing the likelihood of a bribe
(p<0.01). This trend does not vary by phase, with both the punishment phase and
post-punishment phase yielding further insignificant reductions in the probability of offering a bribe
(p=0.23 and p=0.74 for the crackdown and post-crackdown phases respectively). For Pakistan,
we also observe a negative trend in bribes, but it is insignificant (p=0.39), as are the interactions
between phases and the trend (p=0.14 and p=0.20). The crackdown phase does not have an
independent effect at the outset, as we do not observe a significant shift in bribes immediately
after the crackdown phase is imposed either in the US (p=0.51), or in Pakistan (p=0.16). Once
the crackdown phase ends, however, we observe a significant increase in bribes immediately
afterwards, both in the US (p<0.05) and in Pakistan (p<0.05).
Favors follow a similar pattern, due to the strong relationship between bribes and favors.
In the US, we observe a negative and significant coefficient on the round variable (p<0.01),
which does not significantly differ by phase. In addition, we see no significant change at the
1 Note that most of the coefficients in table A3 are identical to those in table 3. This is simply because there is one
very minor difference between the two tables: the coding of the period variable (ranging from 1 to 10 for table 3, and from 1 to 30 for table A3). This change impacts the intercepts of the crackdown and post-crackdown phase, but leaves the other estimates unchanged. This is because the re-specification changes the interpretation of the
onset of the crackdown phase (p=0.73), but a significant increase in the probability of granting a
favor once the crackdown is removed (p<0.1). By contrast, in Pakistan the probability of
providing a favor does not change over time (p=0.59). In addition, the probability of providing a
favor does not significantly increase at the onset of either the Crackdown, or Post-crackdown
phases in Pakistan (p=0.45 and p=0.60 respectively). Thus, it is apparent that in the US, bribes
and favors decline over time, but a sharp increase is observed at the beginning of the
post-crackdown phase. In Pakistan, we find little evidence of a decline, and also no evidence of a
[image:36.612.96.510.287.658.2]rebound.
Table A3 Regression results for bribe and favor activity in the US and Pakistan – Alternate specification
(1) (2) (3) (4)
Bribes Favors
US PK US PK
Crackdown Phase (D) 0.332 0.626 -0.197 0.335
(0.50) (0.44) (0.57) (0.44)
Post-Crackdown Phase (D) 1.960** 1.509** 1.453* 0.368
(0.79) (0.72) (0.78) (0.69)
Round # -0.097*** -0.023 -0.113*** -0.014
(0.03) (0.03) (0.03) (0.03)
Round # -0.052 -0.055 -0.016 -0.042
X Crackdown Phase (0.04) (0.04) (0.05) (0.04)
Round # -0.014 -0.049 0.028 -0.017
X Post-Crackdown Phase (0.04) (0.04) (0.04) (0.04)
Female 0.254 -0.841** -0.809** -0.492
(0.40) (0.37) (0.39) (0.44)
Age 0.074 -0.415*** -0.078 -0.335**
(0.12) (0.12) (0.10) (0.14)
Constant -0.335 9.534*** 2.626 7.362**
(2.51) (2.58) (2.07) (2.92)
Log Likelihood -466.0 -583.1 -438.3 -607.0
Chi2 165.69 48.88 169.64 33.14
P 0.000 0.000 0.000 0.000
Observations (Groups) 960 (32) 1230 (41) 960 (32) 1230 (41)
* p < 0.1, ** p < 0.05, *** p < 0.01
a Random effects probit regression estimates. Table reports marginal effects with group-level clustered standard