Munich Personal RePEc Archive
Climate change impacts: Understanding
the synergetic interactions using graph
computing
Halkos, George and Tsilika, Kyriaki
Department of Economics, University of Thessaly
November 2016
Online at
https://mpra.ub.uni-muenchen.de/75037/
Climate change impacts:
Understanding the synergetic interactions using
graph computing
George E. Halkos and Kyriaki D. Tsilika
Laboratory of Operations Research,
Department of Economics, University of Thessaly
Abstract
In this study we provide a computerized graph structure for synthesizing and displaying the data on a region’s ecosystem-economic system. By applying Mathematica-based graph modelling we create a causal network of the synergistic impact mechanism among certain climate related factors. Our computational approach identifies a climate factor that affects most immediately or most strongly the others. Important factors are indicated through the use of graph theoretical tools. Our graph-based approach and its computational aspects allow for factor ranking(s) according to their importance to the network both numerically and visually, for certain settlement types. Our contribution provides quantitative estimates of impacts and adaptation potentials of five potential effects of climate change (migration, flooding- landslides- fire, air and water pollution, human health and energy-water-other resources) which play a substantial role at the synergistic impact mechanism. Results allow having a picture of the structure of synergistic impact mechanism in a glimpse. Specifically, visual output is created to detect i) the causal relationships of the synergetic mechanism under study ii) the most influential factor(s) in the synergistic mechanism and iii) classify the factor’s roles (based on the degree of their impact) within the coping mechanism.
Keywords: Graph theory; vertex centrality; Mathematica; climate related factors; environmental economics computation.
1. Introduction
We conduct an analysis of environmental impacts referring to certain categories of settlements. We consider settlements as ecosystems vulnerable to
climate-change related factors. One factor could have an environmental impact on many more. Within the framework of the synergistic mechanism of environmental effects we find that network-based measures may provide important insights into
recognizing the key factors in a given ecosystem. Understanding the influence of climate change on human settlements and the associated socio-economic effects is a
major challenge (Halkos, 2013; Halkos and Matsiori, 2012).
In a previous computational approach of the same issue (Halkos and Tsilika, 2014), infinite matrix representations of influence patterns per settlement type were
constructed. In the present approach, the synergistic impact mechanism is captured in one graph-theoretic formulation. Similar graph structures for economic models has
been computed in (Alkemade et al., 2002; Cerina et al., 2015; Halkos and Tsilika, 2016a; b).
In the proposed graph structure, each environmental factor corresponds to a
vertex and the synergy from one factor to another constitutes a (possibly weighted) directed edge. This way, we create a causal network of the synergistic impact
mechanism among certain climate related factors.
The issue of finding the “important” nodes in the causal network of synergistic effects is first confronted. Important nodes are indicated through the use of graph
theoretical tools. Nodes (factors) with a key role in the causal network of the synergistic impact mechanism have high centrality indicators. Usually indicators of
the most important vertices within a graph. The question of which nodes are the most
central has multiple answers. Definition of “central” varies by context or purpose (Freeman, 1979; Aroche-Reyes, 1996; Friedkin 1991; Everett and Borgatti, 2004; Borgatti, 2005; Borgatti and Everett, 2005; Borgatti and Everett, 2006). In some cases
the number of connections is the best centrality measure, in other cases “central” is relative to rest of network. In our analysis, we evaluate each indicator of centrality as
an influence metric and give its interpretation in the environmental context we set. Extending and exploiting this information, we proceed in identifying “key” factors and rank the factors’ roles in a given synergistic impact mechanism. A certain
algorithm for vertex coloring is employed for visual testing of linkage criteria. The visual output of this study is the ultimate result, since we succeed to
evaluate the synergetic interactions through a pseudo-geometric visualization, in a self-explanatory approach, free of any mathematical formulations, arguments and/or any other justification.
2. Visualizing Interactions among Climate Related Factors for three Settlement Types
In this section, we justify our assumptions for three types of settlements (i.e.
urban settlements, riverine coastal steeplands and resource dependent settlements) on the findings of IPCC (McCarthy et al., 2001), par. 7.6.2. Specifically, we take the interactions between migration, phenomena of flooding- landslides- fire, air and water
pollution, human health and energy-water-other resources, as featured in a tabular format in the IPCC report (McCarthy et al., 2001) chapter 7.
says that a white cell states no interaction; grey-shaded cells signify interactions of
variant influences. A dark shade is related to an intense impact.
In the pattern constructs below, while white cells are steadily white, all other cells, depending on the geographic, seasonal and/or sectoral level, fluctuate their
shades regionally. The derived matrix patterns are representative of every type of settlement. Rows and columns of matrices in Figure 1 feature five environmental
factors with a serial number from 1 to 5. Serial numbers 1-5 represent Migration (1), Flooding, Landslides, Fire (2), Air and Water Pollution (3), Human Health (4) and Energy, Water, other Resources (demand) (5).
Relevant concepts and notions are agriculture, forestry, transportation, infrastructure, extinction of species and loss of ecosystems, heat waves etc. The IPCC
report 2001 states that “in the 20th century, global temperatures increased in the range of 0,6±0,2° C and provide a number of possible effects of global warming on climate like extreme weather events (with very possible summer droughts in continental areas,
higher heat waves, etc), tropical storm intensity (hurricanes, etc), decomposition of methane hydrates, etc”.
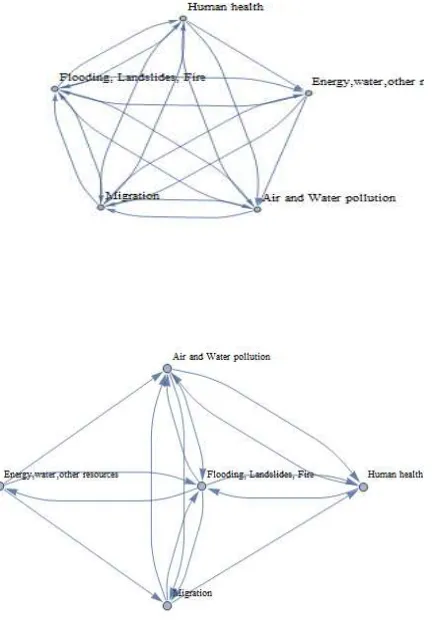
The visual approach presented in this paper, employs graphs with vertices the climate-related factors and edges their in-between interactions. Figure 2a, b, c provide a topological view of the matrix patterns of Figure 1. In all figures, we consider
synergy effects that occur with equal probability in any climate related factor and consequently, we construct unweighted graphs. We assume a flow process in which
no link is repeated (only the immediate synergistic effects are considered) and, synergy flows by parallel duplication (Borgatti, 2005). We do not approach the system with a dynamic model-based view; the dynamic flow context is out of the
takes place after the first activation of the synergistic mechanism and ii) priority has
been given to prevention measures and policy interventions based out mostly on the primary synergistic mechanism. Following Borgatti’s (2005) categorization, we study the case of “diffusion by replication”. We consider shortest paths (i.e., the geodesic
distances) in the sense of direct/immediate impacts.
[image:6.595.91.462.234.361.2]Figure 1: Matrix of synergistic effects for urban settlements, riverine coastal steeplands and resource dependent settlements
Figure 2: Graph illustration of the interactions of climate-related factors
2a. Urban settlements
[image:6.595.121.340.423.744.2]2c. Resource dependent settlements
3. Computational Description of our Methodology
Graphs are built from vertices and edges directly in a symbolic form. The computer input for the graph construction is the so-called adjacency matrix. In the
network analysis context, the adjacency matrix displays relationships between objects. Matrix inputs 1 and 0 indicate whether two objects are related or not.
In this study, the adjacency matrix is generated from climate hypotheses for types of settlements that are conceptualized verbally in the IPCC report (McCarthy et al., 2001, par. 7.6.2). Let A=(aij) be the adjacency matrix representing the synergistic
effects of the climate related phenomena. Elements aij=1 if a phenomenon i has an
impact on phenomenon j and aij=0 otherwise. The one and only task of a potential
user of our codes, is, to synthesize the adjacency matrix of the ecosystem under study and assign it in the appropriate built-in Mathematica functions. Following IPCC (2001) report, the study of the synergistic effects, results in the following adjacency
matrices.
The most influential node of the network is traced using indicators of
Table 1: Adjacency matrix of urban settlements 0 0 1 1 1 Resources Other Water, Energy, 1 0 1 1 1 Health Human 0 1 0 1 1 Pollution Water and Air 1 1 1 0 1 Fire , Landslides Flooding, 1 1 1 1 0 Migration Resources Other Water, Energy, Health Human Pollution Water and Air Fire , Landslides Flooding, Migration
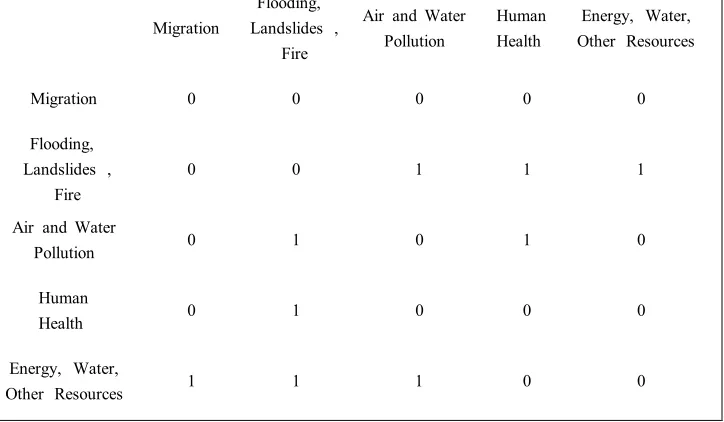
Table 2: Adjacency matrix of riverine coastal steeplands
0 0 1 1 1 Resources Other Water, Energy, 0 0 1 1 0 Health Human 0 1 0 1 1 Pollution Water and Air 1 1 1 0 1 Fire , Landslides Flooding, 0 1 1 1 0 Migration Resources Other Water, Energy, Health Human Pollution Water and Air Fire , Landslides Flooding, Migration
Table 3: Adjacency matrix of resource dependent settlements
[image:8.595.89.451.555.766.2]For the presentation and better understanding of our evaluation, we use a
vertex coloring methodology (http://reference.wolfram.com/language/ref/ ClosenessCentrality.html), exploiting the values of the vertex centrality measures.
In our computer experiments we use the following Mathematica functions
(Wolfram Language and System): for the graph model construction the
AdjacencyGraph and WeightedAdjacencyGraph functions, for graph metrics and measures evaluation the DegreeCentrality, ClosenessCentrality,
PageRankCentrality, EigenvectorCentrality functions1.
HighlightGraph [g,{α1,α2, …}] function highlights the αi that can be vertices,
edges, or subgraphs of g. Similar source codes are given in (Halkos and Tsilika
2016a; b).
4. Vertex Centralities
Centrality is a way to address the importance of a vertex in a given network. It
is defined as how actively this vertex interacts with others. There are several ways to calculate the centrality of a vertex as degree centrality, closeness centrality,
eigenvector centrality, page-rank centrality, betweenness centrality etc (see indicatively Harary et al., 1965; Freeman, 1979; Friedkin 1991; Everett and Borgatti, 2004; Borgatti, 2005; Borgatti and Everett, 2005; Borgatti and Everett, 2006; Everett
and Borgatti, 2005; Aldasoro and Angeloni 2015).
Definition 1. Closeness centrality is a measure to check if a node is close to other
nodes. Closeness centrality2 for a graph g is given as {1/l1, 1/l2,…]} where li is the
average distance from vertex i to all other vertices connected to i. If d is the distance matrix then the average distance li from vertex i to all connected vertices is given by
1 A Mathematica implementation is available on request.
2 Since centrality indices are computed in Mathematica, definitions of centrality are given as stated in
(Σj dij )/k, where the sum is taken over all finite dij and k is the number of vertices
connected to i. The closeness centrality for isolated vertices is taken to be zero.
Definition 2. (The simplest concept) Degree centrality is defined as the number of the
direct neighbors of the vertices. Degree centrality measures the immediate/direct
impact. The degree can be interpreted in terms of the immediate risk of a node for catching whatever is flowing through the node. We usually define two separate
measures of degree centrality, namely indegree and outdegree. Indegree centrality reveals whether the vertex in question is a source (more outflows than inflows) or a receiver (more inflows than outflows). In our environmental study, a source is a
threatening factor (able to trigger more climate change effects) and a sink a vulnerable one (is likely to be triggered by other climate change effects).
Observing the adjacency matrix of urban settlements, the obvious result from the first, second and fourth row is that the corresponding environmental factor (migration, flooding- landslides- fire, human health) has a dominant impact within the
coping mechanism of environmental effects. Quantifying this result, we evaluate closeness centrality (we select closeness centrality out of a variety of centrality
measures following Borgatti, 2005; Borgatti and Everett, 2005; Friedkin, 1991) for the associated graph, to certify that the (same) highest closeness centrality corresponds to the first, second and fourth climate-related factor. The performance of
our methodology is summarized in Tables 4, 5. Results concern only closeness centralities, but can be adjusted for any other centrality measure.
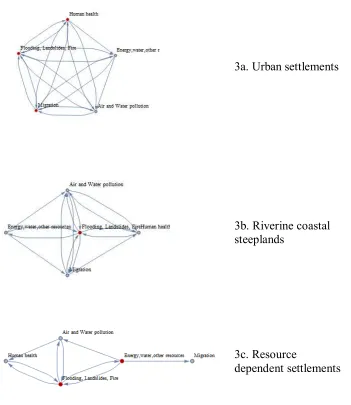
Nodes whose centrality index is 1 are “centres of the structure”. The more central a node is, the closer it is to all other nodes. In a self-explanatory visual scheme, Mathematica automatically highlights the vertex (vertices) with the highest
factors with a null to small share of environmental impacts, while red shaded vertices
represent factors having a significant degree of influence on the synergetic mechanism. The closeness centrality for isolated vertices is taken to be zero (blue colored vertex). The closeness centrality for vertices connected to all the other
vertices of the graph is taken to be one (red colored vertex).
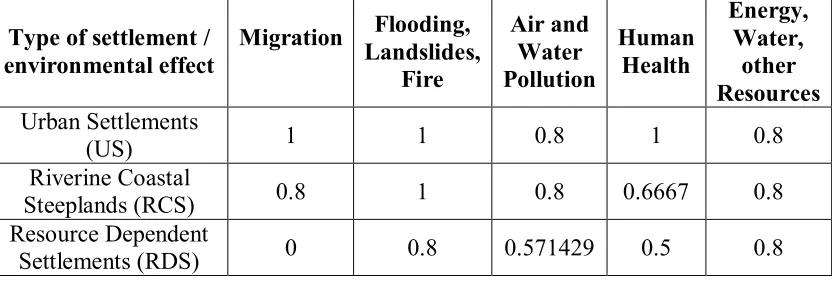
Table 4: Summary table of influence indices of environmental factors per type of settlement (based on closeness centralities)
Type of settlement /
environmental effect Migration
Flooding, Landslides,
Fire
Air and Water Pollution
Human Health
Energy, Water,
other Resources Urban Settlements
(US) 1 1 0.8 1 0.8
Riverine Coastal
Steeplands (RCS) 0.8 1 0.8 0.6667 0.8
Resource Dependent
Settlements (RDS) 0 0.8 0.571429 0.5 0.8
When performing an “impact analysis”, i.e. evaluating how environmental
factors influence each other and the synergistic mechanism system-wise, it may not be assumed that matrix A is a strict 0-1 matrix or that has constant input. The proposed
methodological approach can be generalized for weighted graph models, where in place of the adjacency matrix, a matrix X with entries real numbers, representing connection strengths, is employed. (xij) matrix is the matrix that captures all the
repercussions between the five factors and consists of the indicators of impact. For random weighted matrix of synergistic effects, nonzero entries are computer
generated numbers from Mathematica’s random number generator RandomReal[{1,
[image:11.595.92.508.254.395.2]Figure 3: Highlighting the maximum closeness centrality
3a. Urban settlements
3b. Riverine coastal steeplands
3c. Resource
dependent settlements
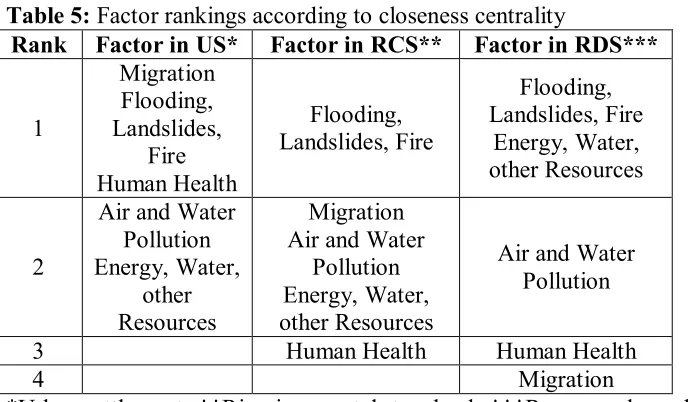
[image:12.595.120.361.591.722.2]Table 5: Factor rankings according to closeness centrality
Rank Factor in US* Factor in RCS** Factor in RDS***
1
Migration Flooding, Landslides,
Fire Human Health
Flooding, Landslides, Fire
Flooding, Landslides, Fire
Energy, Water, other Resources
2
Air and Water Pollution Energy, Water,
other Resources
Migration Air and Water
Pollution Energy, Water, other Resources
Air and Water Pollution
3 Human Health Human Health
4 Migration
*Urban settlements **Riverine coastal steeplands ***Resource dependent settlements
5. Evaluation and Discussion
In this study, the knowledge from different fields is combined for the purpose of dealing with the issue of climate change. When we define the matrix of synergistic effects, we take into account the seasonal, spatial/regional differences, the local
climate variability. Then, in our graph-inspired model, we perform the proposed “impact analysis”, as presented in sections 3, 4. The resulting images raise awareness
of the risks that emerge. In a first step, domino effect prediction and measurement of the transmission of risk within the climate related synergistic impact mechanism is made. Secondly, an evaluation of the evolution of environmental danger is achieved.
Our computational methodology highlights the most crucial factors in a given ecosystem. In the case of urban settlements, Figure 3a and Table 4 reveal three key
factors which strongly influence the underlying mechanism. In riverine coastal steeplands (Figure 3b), only one factor has a strong influential role within the associated synergistic mechanism. Consequently, less prevention measures are needed
settlements have lower centrality values than other types of settlements (see the
entries in “RDS” line of Table 4), a slower spread of climatic impacts and vulnerabilities is expected. Therefore, urban settlements (interpreting “US” line of Table 4) carry a higher systemic risk compared to resource dependent settlements.
Results in Table 5 help a decision maker set priorities at the country level.3
In the light of an anticipated future risk, activities aiming in risk and
vulnerability reduction and/or adaptation policies should take place. Using our information, local government or local community could prepare an early warning system, proceed with pre-disaster actions, (i.e. emergency evacuation, emergency
shelters, drain cleaning, disease surveillance, public awareness etc) and prepare for surprises (REC 2004; Revi et al., 2014; Dasgupta et al., 2014; Adger et al., 2014).
Effective policy interventions (as slope stabilization, watershed management upstream, land use management, standards enforced on housing quality) could intercept a potential crisis, a massive disaster, the damage of an upcoming
“environmental domino effect”. The effectiveness of such responses depends on an advanced understanding of the specific vulnerabilities, uncertainties, and priorities of
the synergetic mechanism under study.
A range of measures responding to risks reduces also the associated social costs, damage costs, climate change costs (Parry et al., 2007, par. 7.5; Halkos, 2014).
The use of policy rules is discussed among others by Amman and Kendrick (1999; 2003), Amman and Duraiappah (2004).
3 For the implementation of environmental management systems standards in corporate decision
6. Conclusions
Our approach focuses on an integrated computational framework that models the structured mechanism of environmental impacts in an ecosystem. The output produced visually pinpoints the impact of each factor and identify at a glance,
environmentally important factors.
In our computational experiments, the interactions between migration,
phenomena of flooding- landslides- fire, air and water pollution, human health and energy-water-other resources, are depicted in a graph. The matrix of their interconnections is our basis for our computational methodology. Given the linkages
between the five studied climate related phenomena, we construct symbolic graphs as visual and accurate representations of the mechanism of environmental impacts at a
regional level.
Centrality measures are the graph theoretic metrics for the quantitative analysis. Vertices whose centrality indicators are high seriously affect the synergetic
mechanism of environmental effects and point to criticality. By these means, our computational approach provides useful information on risk mapping, early warning,
References
Adger W.N., Pulhin J.M., Barnett J., Dabelko G.D., Hovelsrud G.K., Levy M., Oswald Spring Ú. and Vogel C.H. (2014). Human security. In: C.B. Field, V.R. Barros, D.J. Dokken, K.J. Mach, M.D. Mastrandrea, T.E. Bilir, M. Chatterjee, K.L. Ebi, Y.O. Estrada, R.C. Genova, B. Girma, E.S. Kissel, A.N. Levy, S. MacCracken, P.R. Mastrandrea and L.L. White (eds.). Climate Change 2014: Impacts,
Adaptation, and Vulnerability. Part A: Global and Sectoral Aspects. Contribution
of Working Group II to the Fifth Assessment Report of the Intergovernmental Panel on Climate Change. Cambridge and New York: Cambridge University Press.
p. 755-791. Available from: https://www.ipcc.ch/
pdf/assessment-report/ar5/wg2/WGIIAR5-Chap12_FINAL.pdf
Aldasoro I. and Angeloni I. (2015). Input–output-based measures of systemic importance,
Quantitative Finance, 15(4): 589-606.
Alkemade F., Amman H., and La Poutré J. A. (2002). The role of information in an electronic trade network. Computing in Economics and Finance, 376, Society for Computational Economics. Available from: http://ideas.repec.org/p/sce/scec f2/376.html.
Amman H.M. and Duraiappah A.K. (2004). Land tenure and conflict resolution: a game theoretic approach in the Narok district in Kenya. Environment and Development
Economics, 9(3): 383–407.
Amman H.M. and Kendrick D.A. (1999). Should Macroeconomic Policy Makers Consider Parameter Covariances? Computational Economics, 14(3): 263-267. Amman H.M. and Kendrick D.A. (2003). Mitigation of the Lucas critique with stochastic
control methods. Journal of Economic Dynamics and Control, 27(11-12): 2035-2057.
Aroche-Reyes F. (1996). Important coefficients and structural change: A multi-layer approach. Economic Systems Research, 8(3): 235-246.
Borgatti S.P. (2005). Centrality and network flow. Social Networks, 27: 55–71.
Borgatti, S.P. and Everett M.G. (2005). A Graph-Theoretic Perspective on Centrality.
Social Networks, 28: 466-484.
Borgatti, S.P. and Everett M.G. (2005). A Graph-Theoretic framework for classifying centrality measures. Social Networks 28: 466-484.
Blöchl F., Theis F.J., Vega-Redondo F. and Fisher E.O.N. (2011). Vertex centralities in input-output networks reveal the structure of modern economies. Physical Review E
- Statistical, Nonlinear and Soft Matter Physics, 83(4): 046127.
Cerina F., Zhu Z., Chessa A. and Riccaboni M. (2015). World input-output network.
PLoS ONE, 10(7): e0134025.
Dasgupta P., Morton J.F., Dodman D., Karapinar B., Meza F., Rivera-Ferre M.G., Toure Sarr A. and Vincent K.E. (2014). Rural areas. In: C.B. Field, V.R. Barros, D.J. Dokken, K.J. Mach, M.D. Mastrandrea, T.E. Bilir, M. Chatterjee, K.L. Ebi, Y.O. Estrada, R.C. Genova, B. Girma, E.S. Kissel, A.N. Levy, S. MacCracken, P.R. Mastrandrea and L.L. White (eds.). Climate Change 2014: Impacts, Adaptation,
and Vulnerability. Part A: Global and Sectoral Aspects. Contribution of Working
Group II to the Fifth Assessment Report of the Intergovernmental Panel on Climate Change. Cambridge and New York: Cambridge University Press. p. 613-657. Available from: https://www.ipcc.ch/ pdf/assessment-report/ar5/wg2/WGIIAR5-Chap9_FINAL.pdf
Evangelinos K. and Halkos G.E. (2002). Implementation of environmental management systems standards: important factors in corporate decision making. Journal of
Everett M.G. and Borgatti S.P. (2005). Extending centrality. In: P. Carrington, J. Scott, S. Wasserman (Eds.) Models and Methods in Social Network Analysis. Cambridge: Cambridge University Press.
Freeman L.C. (1979). Centrality in social networks: I. Conceptual clarification. Social
Networks, 1: 215-239.
Friedkin N. (1991). Theoretical foundations for centrality measures. American Journal of
Sociology, 96: 1478-1504.
Halkos G.E. and Evangelinos H.I. (2002). Determinants of environmental management systems standards implementation: evidence from Greek industry.
Business Strategy and the Environment 11(6): 360-375.
Halkos G.E. & Matsiori S. (2012). Determinants of willingness to pay for coastal zone quality improvement. The Journal of Socio-Economics 41 (4): 391-399
Halkos G.E. (2013). Exploring the economy–environment relationship in the case of sulphur emissions. Journal of Environmental Planning and Management 56 (2): 159-177.
Halkos G.E. (2014). The economics of climate change policy: Critical review and future policy directions. MPRA paper. Available from:
https://ideas.repec.org/ p/pra/mprapa/56841.html
Halkos G.E. and Tsilika K.D. (2014). Analyzing and visualizing the synergistic impact
mechanisms of climate change related costs. Applied Mathematics and
Computation, 246: 586-596.
Halkos G. and Tsilika K. (2016a). Assessing classical input output structures with trade networks: a graph theory approach. MPRA paper. Available from:
https://mpra.ub.uni-muenchen.de/72511/1/MPRA_paper_72511.pdf
Halkos G.E. and Tsilika K.D. (2016b). A new vision of classical multi-regional input-output models. Computational Economics, DOI 10.1007/s10614-016-9624-x. Harary F., Norman R.Z. and Cartwright D. (1965). Structural Models: An Introduction to
the Theory of Directed Graphs. New York: Wiley.
McCarthy J.J., Canziani O.F., Leary N.A., Dokken D.J., White K.S. (Eds.) (2001). Climate Change 2001: Impacts, Adaptation, and Vulnerability. Contribution of Working Group II to the Third Assessment Report of the Intergovernmental Panel on Climate Change. Cambridge: Cambridge University Press.
Parry M.L., Canziani O.F., Palutikof J.P., van der Linden P.J., Hanson C.E. (Eds.) (2007). Climate Change 2007: Impacts, Adaptation, and Vulnerability. Contribution of Working Group II to the Forth Assessment Report of the Intergovernmental Panel on Climate Change. Cambridge: Cambridge University Press.
REC (Renewable Energy Centre) (2004). Strategies for reducing the vulnerability of energy systems to natural disasters in the Caribbean. Working Paper Series 2004-1. Barbados Renewable Energy Centre, Bridgetown, Barbados, 16 pp.
Revi A., Satterthwaite D.E., Aragón-Durand F., Corfee-Morlot J., Kiunsi R.B.R., Pelling M., Roberts D.C. and Solecki W. (2014). Urban areas. In: C.B. Field, V.R. Barros, D.J. Dokken, K.J. Mach, M.D. Mastrandrea, T.E. Bilir, M. Chatterjee, K.L. Ebi, Y.O. Estrada, R.C. Genova, B. Girma, E.S. Kissel, A.N. Levy, S. MacCracken, P.R. Mastrandrea and L.L. White (eds.). Climate Change 2014: Impacts,
Adaptation, and Vulnerability. Part A: Global and Sectoral Aspects. Contribution
of Working Group II to the Fifth Assessment Report of the Intergovernmental Panel on Climate Change. Cambridge and New York: Cambridge University Press.
p. 535-612. Available from:
https://www.ipcc.ch/pdf/assessment-report/ar5/wg2/WGIIAR5-Chap8_FINAL.pdf
Wolfram Language and System. Documentation Center. Available from: