Local Structure and Glass Transition in Zr-Based Binary Amorphous Alloys
Tetsu Ichitsubo
1;*, Eiichiro Matsubara
1, Junji Saida
2and Ho-Sou Chen
31Department of Materials Science and Engineering, Kyoto University, Kyoto 606-8501, Japan 2Center for Interdisciplinary Research, Tohoku University, Sendai 980-8578, Japan
3
Bell Laboratories, Lucent Technology, New Jersey 08833, USA
The physical significance of the glass transition observed by differential scanning calorimetry (DSC) in the metallic glasses was considered through the measurements of the heating-rate,, dependence of the glass transition temperature,Tg, and the crystallization temperature,Tx, in
the Zr70Cu30and Zr70Ni30amorphous alloys and X-ray study of their structures in as-quenched and crystallized states. Zr70Cu30exhibits the glass transition before crystallization, but Zr70Ni30 is immediately crystallized at heating rates of conventional time scale in the DSC measurement. The heating ratecat the intersection of the two linear curves ofTgandTxagainstlogprovides us with a significant measure to
determine the glass-forming ability or thermal stability of the metallic glasses. By heating atlarger thanc, the crystallization is suppressed
and the glass transition is clearly observed even in Zr70Ni30. The thermal stability of the Zr70Cu30amorphous alloy is caused by retardation of crystallization due to the amorphous structure that is different from the Zr2Cu crystalline phase. In contrast, the thermal instability of Zr70Ni30is attributed to the structural similarity to the Zr2Ni crystalline phase. Thus, suppressing the crystallization is shown to be a key to enhance the thermal stability of the present amorphous alloys.
(Received August 30, 2005; Accepted September 8, 2005; Published October 15, 2005)
Keywords: glass transition, metallic glasses, zirconium-based amorphous, differential scanning calorimetry, superheating, X-ray diffraction method, structual analysis, supercooled liquid
1. Introduction
Amorphous state can be obtained in many alloys by rapidly quenching from the melts at a quenching rate more than
106C/min, but in some alloys, it can be prepared even at a
much slower quenching rate, e.g. 1–100C/min.1–5) These amorphous alloys with good glass-forming ability (GFA) usually show the glass-liquid transition and hence they are called ‘‘metallic glasses’’, in conformity with the definition that ‘‘a glass is an amorphous solid which exhibits a glass transition’’.4)
Initially, the metallic glasses have been found only in noble-metal based alloys, such as, Pd–Ni–P, Pt–Ni–P, etc.3)
Through 1990s, they have been discovered in other multi-component systems without containing either a noble metal or a metalloid element.6) Their good GFA and reversible
glass-liquid transition have attracted considerable attention, in comparison with oxide and polymer glasses. As it is mentioned above, the metallic glasses are characterized by the presence of the glass transition and their GFA is evaluated with some empirical parameters, such asTg=TlorTg=Tmand
a temperature span of a supercooled liquid region, Tx¼
TxTg, whereTg is the glass transition temperature,Tlthe
liquidus temperature,Tmthe melting temperature andTx the
crystallization temperature.
A fundamental question raised here is concerned about the thermal stability of metallic glasses: What kinds of factor determine whether the glass transition exists or not? That is, what is the physical significance of Tg observed by
differ-ential scanning calorimetry (DSC) in the metallic glasses? We believe that considering this question would link to understanding of the thermal stability of metallic glasses, and recently reported the feature of the glass transition of a less stable metallic glass based on the DSC measurements.7)In this paper, based on the experimental results of the
heating-rate dependence of Tx and Tg and the X-ray structural
analyses in both amorphous and crystallized states, we intend to discuss an essential characteristic of the glass transition and the thermal stability in metallic glasses. In this study, we have chosen two binary Zr70Cu30 and Zr70Ni30 amorphous
alloys. The Zr70Cu30 amorphous alloy shows the glass
transition prior to crystallization on heating and the Zr70Ni30
amorphous alloy is immediately crystallized.7–9)In the sense
that the glass transition exists, Zr70Cu30 is like a metallic
glass rather than a normal (marginal) amorphous alloy, and Zr70Ni30belongs to the latter.
2. Experimental
Alloy ingots having the nominal compositions were prepared by the arc-melting method using 99.9 mass%Zr, 99.999 mass%Cu and 99.9 mass%Ni. Zr70Cu30 and Zr70Ni30
amorphous ribbons about 0.03 mm thick and 2 mm wide were prepared by a single roller melt-spinning technique in argon atmosphere with a roller spinning at 4000 min1 and quenching from 1200C for Zr70Cu30 and from 1300C for
Zr70Ni30. The densities of the amorphous ribbons measured
by Archimedes’ method are 7.00 g/cm3 for Zr
70Cu30 and
7.03 g/cm3for Zr
70Ni30, respectively.
Differential scanning calorimetry (DSC) measurements were carried out using a standard commercial instrument (Perkin Elmer Diamond DSC) with an about 5–10 mg sample. Heat flow was measured during heating at a constant heating rate up to ¼500C/min, which is the highest
attained in the present instrument.
Structures of the as-prepared amorphous alloys were determined by high energy X-ray diffraction at SPring-8 synchrotron radiation on beam line BL04B2. Monochromatic incident X-rays of 61.74 keV from a Si(111) monochromator were used as incident beams. Scattering from the samples was detected by a portable Ge solid state detector. Observed intensities were corrected for absorption, polarization and
*Corresponding author, E-mail: [email protected]
Compton scattering, and converted to electron units per atom by the generalized Krogh–Moe–Norman method,10)using the
tabulated X-ray atomic scattering factors and anomalous dispersion terms.11) An interference function QiðQÞ was
computed from the resultant coherent scattering intensity,
IeuðQÞ:
QiðQÞ ¼QðIeuðQÞ hf2iÞ=hfi2; ð1Þ
hfi ¼X
2
j¼1
xjfj; hf2i ¼
X2
j¼1
xjfj2; ð2Þ
where Q¼4sin=, 2 is the scattering angle, is the wavelength, andxjand fjare the atomic fraction and X-ray atomic scattering factor of the jth element. A radial distribution function (RDF) is calculated by Fourier trans-formation ofQiðQÞ:
4r2ðrÞ ¼4r2oþ
2r
Z
Qmax
0
QiðQÞsinQrdQ; ð3Þ
where ðrÞ is the number density function, o the average number density and Qmax the maximum Q-value in the
present measurement. The advantage in the high energy diffraction method is a largeQmaxvalue of about 270 nm1in
the present measurements which reduces a truncation error in Fourier transformation so that the spatial resolution of RDF is greatly improved. Coordination numbers and atomic dis-tances at the first peak of RDF were evaluated by fitting the experimental QiðQÞ through the least squares method.12) Crystalline phases in the crystallized samples during the DSC measurements were investigated by the ordinary2–X-ray diffraction with MoKradiation.
3. Results
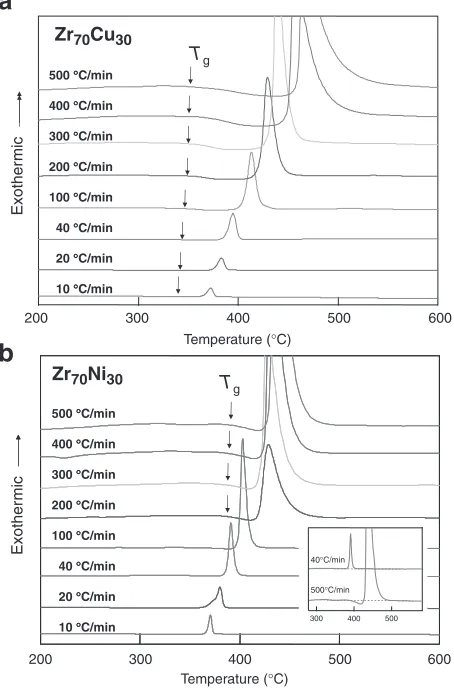
Figures 1(a) and (b) show the DSC profiles at various . These profiles are obtained by subtracting the DSC profile of the second run for the crystallized sample in the first run from that of the first run for the amorphous sample. Tg was
evaluated as an onset temperature of an endothermic deviation from the nearly linear variation with temperature in Fig. 1. Crystallization accompanies a sharp exothermic peak, andTx was determined as an onset temperature of the
peak. In the thermally stable Zr70Cu30amorphous alloy,Tgis
observed at every . On the other hand, in the less stable Zr70Ni30 amorphous alloy, Tg clearly appears only at very
high rates above about200C/min.
Figure 2 shows the interference functions QiðQÞ of the two amorphous alloys. Dotted curves correspond to the functions fitted for determination of coordination numbers and atomic distances in Table 1. RDFs calculated through Fourier transformation of QiðQÞ are shown in Fig. 3. Positions of the nearest neighbor pairs are indicated in the figure. The first peak of RDF for Zr70Cu30 consists of three
atom pairs, i.e., Cu–Cu at 0:2600:002nm, Zr–Cu at
0:2840:001nm and Zr–Zr at 0:3190:001nm. These atomic distances are almost equal to those calculated from Goldschmidt radii of Zr (0.160 nm) and Cu (0.128 nm). As is seen in Table 1, occupancies of Zr and Cu around Zr calculated from coordination numbers for Zr–Zr and Zr–Cu
pairs are close to the concentrations of Zr and Cu in the original glassy matrix, respectively. These structural param-eters in Zr70Cu30 indicate that the amorphous alloy is a
random structure. This appears in the shape of the first peak of RDF for Zr70Cu30in Fig. 3(a). In contrast, the first peak of
the Zr70Ni30amorphous alloy shows a clear split in Fig. 3(b).
The peak at larger rcorresponds to Zr–Zr pairs and that at lowerraccords with Zr–Ni and Ni–Ni pairs. In Zr70Ni30, the
atomic distance of Zr–Ni pairs (0.270 nm) is about 5% shorter than the distance (0.284 nm) calculated from Gold-schmidt radii of Zr and Ni (0.124 nm). At the same time, the atomic distances of Zr–Zr and Ni–Ni pairs are similar to those calculated from the atomic radii. Only Zr–Ni pairs show differently from the others. The occupancies of Zr and Ni around Zr in Table 1 are quite different from their concentrations. These structural parameters in Zr70Ni30
indicate that some chemical short range order (CSRO) clusters are formed in the amorphous state because of the presence of a strong chemical bond between Zr and Ni atoms. From this structural viewpoint, the Zr70Ni30amorphous alloy
is obviously different from the Zr70Cu30 amorphous alloy
consisting of randomly arranged atoms.
Figure 4 shows two examples of X-ray diffraction profiles at ¼20 and 500C/min in the crystallized Zr70Cu30 and
Zr70Ni30alloys. All the samples were prepared by quenching
a
500 °°C/min
400 °C/min
300 °C/min
200 °C/min
40 °C/min
Zr70Cu30
Tg
20 °C/min
10 °C/min 100 °C/min
500 400
300 200
Exother
mic
Temperature (°C)
600
b
Temperature (°C)
Exother
mic
Tg
600 500
400 300
200
500 °C/min
400 °C/min
300 °C/min
200 °C/min
40 °C/min
20 °C/min
10 °C/min 100 °C/min
Zr70Ni30
500°C/min 40°C/min
500 400 300
[image:2.595.314.541.81.426.2]from the temperature where the exothermic peak of crystal-lization appears (i.e., rapidly cooling from the peak temper-ature in the DSC profile). Crystalline phases formed in Zr70Cu30and Zr70Ni30crystallized in the DSC measurements
at every are tetragonal Zr2Cu (I4/mmm, 139) and Zr2Ni
(I4/mcm, 140), respectively. Coordination numbers and atomic distances calculated from the crystalline data are also tabulated in Table 1 for comparison, where the atomic distances of the Zr–Zr pairs are averages weighted by coordination numbers based on the crystalline structures. Structures in these crystalline phases are quite different each other because of the strong chemical bond between Zr and
Ni. The Cu–Cu distance is more than 20% longer than the Ni–Ni distance and the Zr–Cu distance is also about 5% longer than the Zr–Ni distance.
4. Discussion
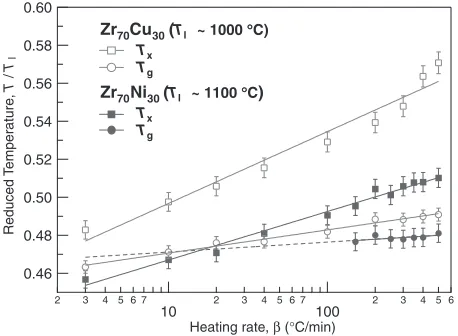
The reduced glass transition and crystallization temper-atures Trg and Trx, which are obtained by dividing the
experimentalTgandTxby the liquidus temperatures 1000C
for Zr70Cu30 and 1100C for Zr70Ni30, are plotted as a
function oflogin Fig. 5. TheTrgandTrxvalues are fitted
with an empirical linear relation proposed by Lasocka:13)
0
100
200
0
50
0
50
exp.
cal.
(b) Zr
70Ni
30Qi
(
Q
) (nm
-1
)
Q
(nm
-1)
Qi
(
Q
) (nm
-1
)
exp.
cal.
(a) Zr
70Cu
30 [image:3.595.309.539.72.338.2]Fig. 2 Interference functions QiðQÞ of (a) Zr70Cu30 and (b) Zr70Ni30 amorphous alloys. Solid and dotted curves correspond to the experimental profile and the profile fitted for determination of coordination numbers and atomic distances in Table 1.
Table 1 Atomic distances and coordination numbers in Zr70Cu30and Zr70Ni30amorphous alloys are compared with those calculated from crystalline data of Zr2Cu and Zr2Ni. Occupancies of Zr and Cu in the amorphous alloys are evaluated from the coordination numbers.r is the variations of atomic distances due to crystallization.
Zr70Cu30 ri j Ni j Occu. Zr2Cu ri j Ni j r
Zr–Zr 0:3190:001 7:90:2 71% Zr–Zr 0.313 8 1:9%
Zr–Cu 0:2840:001 3:20:1 29% Zr–Cu 0.289 4 1.8%
Total 11.1 12
Cu–Zr 0:2840:001 7:50:2 74% Cu–Zr 0.289 8 1.8%
Cu–Cu 0:2600:002 2:60:6 26% Cu–Cu 0.322 4 24%
Total 10.1 12
Zr70Ni30 ri j Ni j Zr2Ni ri j Ni j
Zr–Zr 0:3190:001 9:10:1 78% Zr–Zr 0.331 11 3.8%
Zr–Ni 0:2700:001 2:60:1 22% Zr–Ni 0.276 4 2.2%
Total 11.7 15
Ni–Zr 0:2700:001 6:10:2 75% Ni–Zr 0.276 8 2.2%
Ni–Ni 0:2530:007 2:00:6 25% Ni–Ni 0.263 2 3.9%
Total 8.1 10
0.0
0.2
0.4
0.6
0.8
0
500
1000
0
500
1000
(b) Zr
70Ni
302
π
2
r
ρ
(
r
) (nm
-2
)
r
(nm)
Zr
-Zr
Zr
-Ni
Ni-Ni
Zr
-Zr
Zr
-Cu
2
π
2
r
ρ
(
r
) (nm
-2
)
(a) Zr
70Cu
30Cu-Cu
[image:3.595.55.286.72.335.2] [image:3.595.48.549.436.619.2]Trx,rgTx,g=Tl¼ax,gþbx,glog: ð4Þ
Trxlargely increases with increase in. On the other hand,Trg
shows a much smaller change in every . This evidently shows that the glass transition and crystallization are controlled by different kinetic processes. Since the crystal-lization is controlled mainly by single-atom diffusion, the crystallization is largely retarded by a delay of the diffusion at a high heating rate. A small positive slope forTrgcould be
attributed to the structural relaxation of the rapidly quenched amorphous ribbons.
The heating rates c and reduced temperature Trc at the
intersection of the twoTg andTxcurves are 1.0C/min and
0.46 (315C) for Zr
70Cu30 and 17C/min and 0.47 (374C)
for Zr70Ni30, respectively. By heating the amorphous alloys
athigher thanc, we can observe the glass transition. The crystallization takes place prior to the glass transition at
lower thanc. In Zr70Cu30,cis less than the commonly used
heating rate around 10C/min. Thus, the glass transition is
normally observed in Zr70Cu30.cfor Zr70Ni30is just in the
range of the heating rates commonly used. Thus, in Zr70Ni30,
at less thanc in the DSC measurement, the amorphous
phase is crystallized due to the atomic diffusion, and by heating atmore thancthe diffusion of atoms is suppressed
up to a relatively high temperature, and the glass transition is observed. Consequently, a small c value denotes better thermal stability of the amorphous state. Trx of Zr70Cu30 is
always higher than that of Zr70Ni30and the slope ofTrx(i.e.,
bx in eq. 4) of Zr70Cu30 is larger than that of Zr70Ni30.
Reminding that Trgs for both of the amorphous alloys are
comparable at every, we can conclude that suppression of crystallization is essential to stabilize the amorphous state in the present alloys.
[image:4.595.50.289.73.258.2]The differences of the atomic distances between the amorphous and resulting crystalline phases are shown in Table 1. The differences of Zr–Zr and Zr–Cu pairs are less than 2%. The difference of Cu–Cu pairs, however, reaches 24%. In Zr70Ni30, the differences of every pairs are 2.2 to
3.9% that is slightly larger than those of Zr–Zr and Zr–Cu pairs in Zr70Cu30, but much less than that of Cu–Cu pairs.
Therefore, a more than 20% change of the Cu–Cu distance on average is required for the formation of the Zr2Cu crystalline
phase in the Zr70Cu30 amorphous alloy. This structural
difference between the amorphous and crystalline phases makes rearrangements of atoms, especially in the Cu–Cu pair correlations, more complicated to retard the crystallization in the Zr70Cu30 amorphous alloy. By contrast, however, the
structure of the Zr70Ni30 amorphous alloy resembles that of
Zr2Ni in terms of the interatomic distances. Thus, it is
expected that the Zr70Ni30 amorphous alloy is easily
crystal-lized to form the Zr2Ni phase.
It is noted on the crystallization in Fig. 4 that the peak width of Zr2Cu is much narrower than that of Zr2Ni at every
. This indicates that the size of the Zr2Cu precipitates
evaluated from the peak width at the half maximum is a few times larger than that of Zr2Ni. Thus, we consider that the
rate-determining process for the crystallization in Zr70Cu30is
the nucleation rather than the growth. In the Zr70Ni30
amorphous alloy, as stated earlier, there are many CSRO clusters similar to Zr2Ni in terms of the local structure. Thus,
it is natural to consider that there is not so large barrier for the nucleation of Zr2Ni. Actually, very fine Zr2Ni precipitates are
formed.
Typical thermally-stable glassy solids, such as oxide and polymer glasses, have a random network structure consisting of certain structural units (molecules). In these glasses, atoms composing a molecule are strongly coupled together with covalent bonds. Thus, the structural units are formed from regular polyhedra (for example, SiO4tetrahedra in a silicate
glass), and such glasses show extremely good GFA and reversible glass transition. In contrast, in the metallic glasses mainly composed of metallic elements, atoms are mostly linked with the metallic bonds much weaker than the covalent bonds and, therefore, they can diffuse in the amorphous matrix at a relatively low temperature. The atoms in the metallic glasses form densely packed and isotropic clusters like icosahedral clusters in Zr-based metallic glasses. In the stable oxide or polymer glasses, both glass transition and crystallization proceed with rearrangement of the
Intensity (counts/s)
0 20 40 60
20 40 60 80
0 20 40
332
411
310
002 220
211
2θ (deg)
332
411
310
002 220
211
Zr70Ni30
500 °C/min
20 °C/min
Zr70Ni30
0 20 40 60
20 40 60 80
0 50 100 150
114
006
110
004
101 200 116 211 213 206
103
2θ (deg)
114
006
110
004
103
101 200 116 211 213 206
500 °C/min
20 °C/min
Zr70Cu30
Zr70Cu30
a b
Fig. 4 X-ray diffraction profiles of (a) Zr70Cu30and (b) Zr70Ni30 crystal-lized in DSC measurements at¼500and 20C/min. MoKradiation
was used.
Reduced T
emper
ature
,
T
/
Tl
Heating rate, β (°C/min)
Tx
Tg
Zr70Ni30(Tl ~ 1100 °°C)
Zr70Cu30(Tl ~ 1000 °C)
Tx
Tg 0.60
0.58
0.56
0.54
0.52
0.50
0.48
0.46
2 3 4 5 6 7
10 2 3 4 5 6 7 100 2 3 4 5 6
Fig. 5 Reduced glass transition and crystallization temperatures Trg
(¼Tg=Tl) andTrx(¼Tx=Tl) are plotted as a function oflog, whereTl
is 1000C for Zr
[image:4.595.55.284.327.495.2]structural units (molecules), in which the atomic diffusion is not so significant. In the crystallization of the metallic glasses, however, atomic diffusion plays a significant role as it was shown in the present study. This characterizes the glass transition and crystallization in metallic glasses. Conse-quently, the thermal stability of the metallic glasses may depend on making the crystallization difficult by reducing the mobile atoms or making a significant difference between amorphous and crystallized structures.
5. Conclusion
In the Zr70Ni30 amorphous alloy, the glass transition is
observed only at an extremely high heating rate in the DSC measurements. In contrast, the Zr70Cu30 amorphous alloy
always shows the glass transition. The heating-rate depend-ence of Tx andTg in the Zr70Cu30 and Zr70Ni30 amorphous
alloys and the structures in both amorphous and crystallized states were investigated. Both the experimental reduced glass transition and crystallization temperatures,TrgandTrx, show
linear relations against log. The heating rate c at the intersections of the two curves,i.e. 1.0C/min for Zr
70Cu30
and 17C/min for Zr
70Ni30, provides us with a measure of
GFA and thermal stability of the metallic glasses. Sincecof Zr70Ni30is just in the same order ofcommonly used in the
DSC measurements, the glass transition is not usually observed. However, at larger thanc, the glass transition is revealed even in Zr70Ni30. In contrast, for Zr70Cu30, the
glass transition is observed at every . The structural difference between the amorphous and crystalline phases, especially in the Cu–Cu pair correlations, has been revealed in the Zr70Cu30 amorphous alloy. The similarity of the
structure of the Zr70Ni30amorphous alloy to that of the Zr2Ni
crystalline phase has also been detected. It is concluded that
the different thermal stabilities of these metallic glasses originate from these different structural characteristics in the two amorphous alloys.
Acknowledgement
This work was partly supported by Grant-in-Aid for Scientific Research on the Priority Area Investigation of ‘‘Materials Science of Bulk Metallic Glasses’’ (No. 15074212) from the Ministry of Education, Science, Sports and Culture, Japan. The high energy X-ray diffraction measurements at SPring-8 were carried out at BL04B2 of SPring-8 under the approval of the SPring-8 Program Advisory Committee.
REFERENCES
1) H. S. Chen and D. Turnbull: J. Chem. Phys.48(1968) 2560. 2) H. S. Chen and D. Turnbull: Acta Metall.17(1969) 1021. 3) H. S. Chen: Acta Metall.22(1974) 1505.
4) S. R. Elliott:Physics of Amorphous Materials, (Longman, London and New York, 1984).
5) M. Telford: Materials Today7(2004) 36. 6) A. Inoue: Acta Mater.48(2000) 279.
7) T. Ichitsubo, E. Matsubara, H. Numakura, K. Tanaka, N. Nishiyama and R. Tarumi: Phys. Rev. B72(2005) 052201.
8) J. Saida, M. Kasai, E. Matsubara and A. Inoue: Annals de Chimie-Science des Materiaux27(2002) 77.
9) Z. Fu-Qian: Mater. Sci. Eng.97(1988) 487.
10) Y. Waseda:The Structure of Non-Crystalline Materials(McGraw-Hill, New York, 1980) 27–41, 54–55.
11) International Tables for Crystallography, Vol. C, edited by A. J. C. Wilson (Kluwer Acad. Pub, 1995), pp. 500–501.
12) E. Matsubara, S. Tanaka, A. Makino and T. H. Chiang: Mater. Trans. 45(2004) 1199.