Evaluation of Tensile Strength and Fatigue Strength of Commercial
Pure Aluminum/Tough Pitch Copper Friction-Welded Joints
by Deformation Heat Input
*1Hiizu Ochi
1, Yoshiaki Yamamoto
2, Takashi Yamazaki
2;*2,
Takeshi Sawai
3, Gosaku Kawai
3and Koichi Ogawa
41Incubation Laboratory, Osaka Institute of Technology, Osaka 535-8585, Japan 2Faculty of Engineering, Setsunan University, Neyagawa 572-8508, Japan 3Faculty of Engineering, Osaka Sangyo University, Daito 574-8530, Japan
4Faculty of Liberal Arts and Sciences, Osaka Prefecture University, Sakai 599-8531, Japan
The relationship between joint strength and deformation heat input at the upset stage and the relationship between joint strength and upset burn-off length were examined on friction welded joints of 1050 pure aluminum to C1100 tough pitch copper. Joint quality was evaluated from the tensile strength and fatigue strength. It was found that both the deformation heat input at the upset stage and the upset burn-off length correlated well with joint strength. Additionally, when the deformation heat input at the upset stage or upset burn-off length exceeded a certain value, stable tensile strength was obtained. The mixing layer, intermetallic compounds of Al-Cu were interpolated into A1050, formed at the weld interface, and joints having a thick mixing layer fractured at the weld interface. Joint efficiencies of sound joints for the fatigue limit of the A1050 base metal were 88–100%. Judging from the fatigue limit, sound joints could be produced when either the deformation heat input at the upset stage or the upset burn-off length exceeded a certain value. [doi:10.2320/matertrans.L-MRA2008836]
(Received June 12, 2008; Accepted August 8, 2008; Published November 25, 2008)
Keywords: friction welding, 1050 pure aluminum, C1100 tough pitch copper, tensile strength, fatigue strength
1. Introduction
Recently, various industrial fields have seen an increased demand for dissimilar material joints due to the reduction of weight, resource conservation, energy saving and function-ality. Friction welding, which is one of the solid phase welding methods, is becoming widely used because it is possible to weld dissimilar materials and the procedure is easily automated. However, there are still unresolved issues in this method: e.g., setting the appropriate welding con-ditions is difficult for some materials, the optimum welding conditions depend on friction welding machines, and so on. Recently, the authors have begun to examine the relationship between joint performance and heat input (mechanical work) as well as joint performance and burn-off length. Heat input, which is an elemental factor of the friction welding phenomena, may be useful for evaluating the friction welding condition between different friction welding machines. Also, it will be convenient if the friction welding conditions could be evaluated in terms of the burn-off length. The heat input consists of friction heat input (by friction)1)and deformation
heat input (by deformation of the weld material).2,3)In similar
friction-welded joints of 5056 aluminum alloy,2) 6061
aluminum alloy,3)and SUS304 stainless steel,4)the authors
previously examined the relationship between joint strength (tensile strength and fatigue strength) and heat input (friction heat input, deformation heat input and total heat input); each relationship was evaluated at the friction stage, the upset stage and the total stage. The results revealed that the deformation heat input at the upset stage was closely related
to joint strength. In addition, the authors found that joint strength could also be evaluated by the upset burn-off length because the deformation heat input at the upset stage correlated with the upset burn-off length.
In the present study, the authors examined whether the same evaluation method of using heat input and burn-off length could be applied to the dissimilar joint of commercial pure aluminum to copper. The joint of this combination is widely used in electrical wiring parts and the demand for this joint is increasing in many industrial fields. The joint strength was evaluated by tensile testing, which is the most commonly used test, and by fatigue testing, which was used because most of the fractures of actual machine members are due to fatigue fracture and because fatigue strength is very important from the viewpoint of strength design.
2. Experiment
The materials used in the present study were 1050-H14 commercial pure aluminum (A1050-JIS) and C1100-H tough pitch copper (C1100-JIS). The chemical composition and mechanical properties of the base metals are listed in Tables 1 and 2, respectively. For each metal, a round bar 16 mm in diameter was cut to 100 mm in length, and a 20-mm length of the bar on the welding end was machined down to 14 mm in diameter. Friction welding was conducted using a brake-type friction welding machine. The friction welding factors used are shown in Table 3. In this study, the friction time or the friction burn-off length was controlled by a time control method or a burn-off control method, respectively.
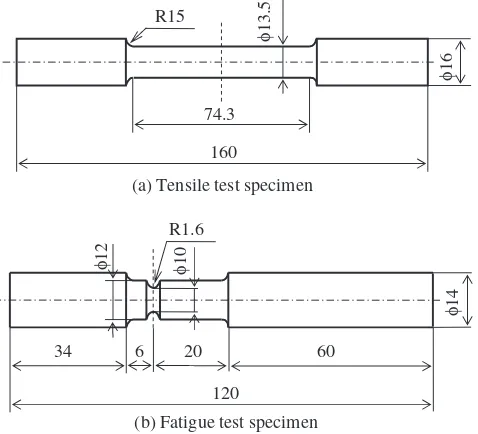
The joint strength of the friction-welded joints was evaluated by tensile testing and fatigue testing using the test specimen shown in Fig. 1. The fatigue specimen was notched at the weld interface; the stress concentration factor for the
*1This Paper was Originally Published in Japanese in J. JILM57(2007) 357–361.
grooved shafts in bending is about 1.66.5)The tensile test and
the fatigue test were carried out using an Instron-type universal testing machine and a cantilever rotary bending testing machine, respectively. For comparison, an A1050 base metal test specimen of the same shape as the joint was tested. The fatigue limit in the fatigue testing was the highest stress level that did not fracture during the course of 107 loading cycles.
In the friction welding of similar joints, the deformation heat input at the upset stage is more closely related to joint performance.2–4) In the present study, the relationship between joint strength and deformation heat input at the
upset stage was examined. The cycle of the brake-type friction welding process is shown in Fig. 2. This welding process has two stages: the friction stage and the upset stage. The upset stage usually occurs in time t2, when the upset
pressure is applied. However, the deformation of the welded metals almost ceases with the rotation stop.6)Therefore, the
phenomena occurring in the stopping period, tB, were
adapted for evaluation. The unit deformation heat input at the upset stageqfd(J/s) is shown in eq. (1), whereF(N) is
the thrust (the product of the upset pressure and cross-sectional area of the weld surface), andvB(m/s) is the upset
burn-off rate.1,2)
qfd¼FvB ð1Þ
The upset burn-off rate is calculated by dividing the upset burn-off length2(m) by the stopping timetB (s).
3. Results and Discussion
3.1 Tensile strength
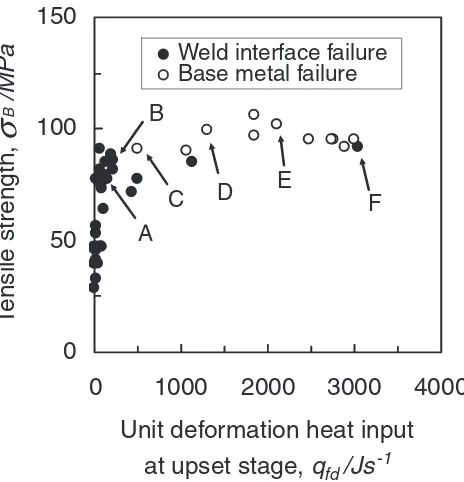
The relationship between tensile strength and deformation heat input at the upset stage is shown in Fig. 3. It was possible to obtain a stable tensile strength of 90–105 MPa (joint efficiency for A1050 base metal of 83–96%) and most of the joints fractured in the A1050 side when the deformation heat input at the upset stage exceeded 500 J/s.
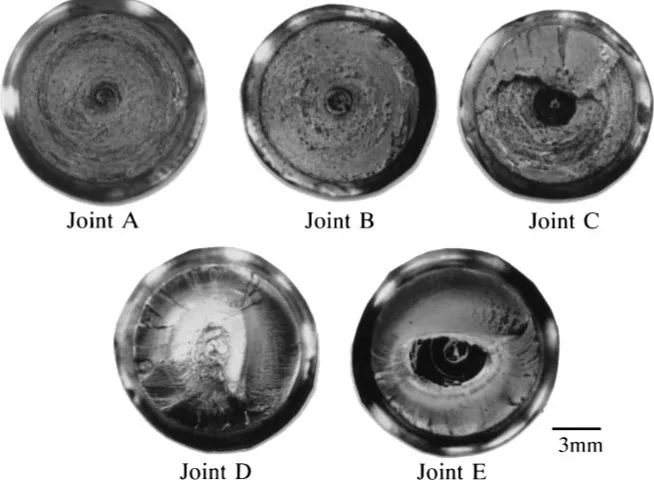
[image:2.595.48.543.85.125.2]The macrostructures of typical joints A-F, represented in Fig. 3, are shown in Fig. 4. The friction welding conditions, the deformation heat input at the upset stage and the upset burn-off length of these joints are shown in Table 4. A dark, feathery mixing layer formed in the A1050 side at the weld interface in joints A-D. The mixing layer decreased with the increase in deformation heat input at the upset stage, and so there was a little layer in joint E. In the friction welding of
Table 1 Chemical composition of base metals (mass%).
Material Si Fe Cu Mn Mg Cr Zn Ti Al
A1050-H14 0.13 0.13 0.00 0.00 0.01 0.00 0.00 0.01 99.72
[image:2.595.306.548.114.345.2]C1100-H — — 99.94 — — — — — —
Table 2 Mechanical properties of base metals.
Material Proof stress MPa
Tensile strength MPa
Elongation %
A1050-H14 105 109 25
[image:2.595.44.291.160.211.2]C1100-H — 257 54
Table 3 Friction welding factors used.
Factor Time control Burn-off length control Friction pressure P1, MPa 5–20 5–20
Upset pressure P2, MPa 15–140 15–140
Friction timet1, s 1.0, 2.0, 4.0 —
Friction burn-off length1, mm — 1.0, 2.0
Friction speed N, s1 50.0 50.0
Stopping timetB, s 0.1 0.1
φ
12
φ
10
φ
14
R1.6
φ
16
φ
13.5
(a) Tensile test specimen
(b) Fatigue test specimen 74.3
160
34 60
120 R15
6 20
Fig. 1 Shape and dimensions of test specimens (unit: mm).
[image:2.595.47.290.261.348.2] [image:2.595.52.291.383.600.2]pure aluminum to pure copper, intermetallic compounds of Al-Cu formed at the weld interface and were accompanied by a loss in strength.7–9) The X-ray diffraction pattern of the
fracture surface of the joint that fractured at the weld interface is shown in Fig. 5. Since peaks of CuAl2, AlCu and
Cu9Al4 were identified, it appeared that the dark layer in
Fig. 3 is the mixing layer, these intermetallic compounds were interpolated into A1050. In joints A-E, the mixing layer decreases with the increase in deformation heat input at the upset stage, because the base metal near the weld interface was exhausted, forming burrs under the action of the upset pressure. However, joint F had a thick mixing layer in spite of the large deformation heat input at the upset stage. This is probably because the intermetallic formation in the friction stage was too much to be satisfactorily exhausted due to the long friction time of 6.4 s. This caused the weld interface fracture.
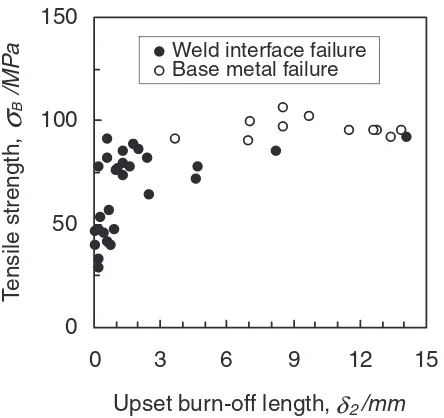
As is commonly known, it is necessary to mount various detectors on the friction welding machine in order to measure the deformation heat input at the upset stage. However, eq. (1) shows that, in the case of the same stopping time, the deformation heat input at the upset stage is proportional to the upset burn-off length. Therefore, the relationship between upset burn-off length and tensile strength was examined from
0
50
100
150
0
Unit deformation heat input
at upset stage,
q
fd/Js
-1T
ensile strength,
σ
B
/MP
a
Weld interface failure
Base metal failure
E
B
C
D
A
F
4000
3000
2000
1000
Fig. 3 Relationship between tensile strength and unit deformation heat input at upset stage: A-F are the symbols of the typical joints.
[image:3.595.55.287.73.314.2]Fig. 4 Macrostructures of the weld interface (left side: A1050, right side: C1100).
Table 4 Friction welding conditions, unit deformation heat input at upset stage and upset burn-off length.
Joint Friction pressure P1, MPa
Upset pressure P2, MPa
Friction time
t1, s
Friction burn-off length1, mm
Unit deformation heat inputqfd, J/s
Upset burn-off length2, mm
A 10 60 2.0 (0.22) 120 1.1
B 7.5 67.5 2.0 (0.16) 212 2.0
C 10 90 1.0 (0.09) 510 3.7
D 10 120 1.0 (0.11) 1312 7.1
E 20 140 1.0 (0.63) 2106 9.8
[image:3.595.113.483.390.616.2] [image:3.595.46.548.687.785.2]the viewpoint of easier evaluations during actual welding. This result is shown in Fig. 6. It was possible to obtain joints with stable tensile strength when the upset burn-off length exceeds 3 mm.
3.2 Fatigue strength
When friction welded joints are used as actual parts, dynamic strength properties such as the fatigue strength should be considered more than static strength properties. Therefore, the fatigue strength of joints A-E was inves-tigated. Joint A had low tensile strength and fractured at the weld interface, joint B had high tensile strength and fractured at the weld interface, and joints C-E had high tensile strength and fractured in the A1050 base metal side. S-N curves of the A1050 base metal and joints A-E are shown in Fig. 7. The fatigue limits of the A1050 base metal and joints A-E are 40, 15, 20, 40, 35 and 40 MPa, respectively. The fatigue strength and the fatigue limit of joints A and B are lower than those of the A1050 base metal, while the fatigue strength of joints C-E
are larger than that of joints A and B. The joint efficiency of joints C-E for the fatigue limit of the A1050 base metal was 88–100%.
Typical sections of the fractured regions after fatigue testing and the fatigue-fractured surfaces of the C1100 side of joints A-E are shown in Figs. 8 and 9, respectively. Joints A and B, which had low fatigue strength, fractured rectilinearly along the weld interface, and a concentric-circular trace of the friction is observed on the whole fracture surface. Although joints C-E, which had high fatigue strength, fractured either in the A1050 side near the weld interface or both in the A1050 side and at the weld interface, the fracture mode did not correlate with the stress amplitude.
Joints A and B, which fractured at the weld interface in tensile testing, fractured rectilinearly along the weld interface in the fatigue testing, too, and had low fatigue strength. Joints C-E, which fractured in the A1050 side in tensile testing and had stable tensile strength, had a fatigue limit for the A1050 base metal of 88–100% and fractured either in the A1050 side near the weld interface or both in the A1050 side and at the weld interface. In other words, in joints A-E the tensile strength property was similar to the fatigue strength property.
Fig. 5 X-ray diffraction pattern of the tensile-fracture surface.
0
50
100
150
0
Upset burn-off length,
δ
2/mm
T
ensile strength,
σ
B
/MP
a
Weld interface failureBase metal failure
15
12
9
6
3
Fig. 6 Relationship between tensile strength and upset burn-off length.
0 20 40 60 80 100
Number of cycles to failure,Nf
Bending stress
, σ
/ MP
a A1050 Joint A
Joint B Joint C Joint D Joint E
104 105 106 107
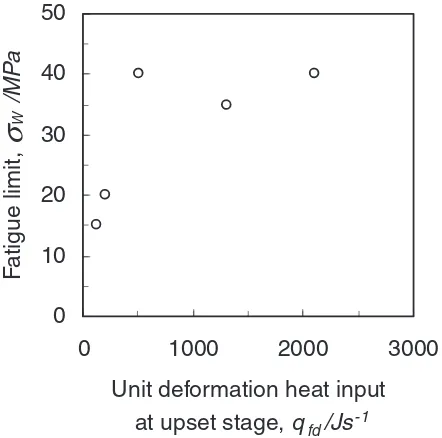
[image:4.595.120.476.71.271.2] [image:4.595.60.282.311.520.2] [image:4.595.307.545.315.480.2]The fatigue strength of the joints was evaluated by the deformation heat input at the upset stage or the upset burn-off length. The relationships between the fatigue limit and deformation heat input at the upset stage or upset burn-off length are shown in Figs. 10 and 11, respectively. It was possible to obtain joints having a fatigue limit for the A1050
base metal of 88–100% when the deformation heat input at the upset stage or the upset burn-off length exceeded a certain value. These facts indicate that, judging from the fatigue limit, the fatigue strength can be evaluated by the deforma-tion heat input at the upset stage and by the upset burn-off length.
Fig. 8 Sections of fractured regions after fatigue tests (left side: A1050, right side: C1100).
[image:5.595.117.479.73.377.2] [image:5.595.134.461.432.675.2]4. Conclusion
1050 pure aluminum to C1100 tough pitch copper was friction welded, and the tensile strength and fatigue strength of these joints were evaluated by the deformation heat input at the upset stage and the upset burn-off length. The results are as follows:
(1) In this combination of 1050 pure aluminum to C1100 tough pitch copper, it was possible to obtain joints having stable tensile strength (joint efficiency for A1050 base metal of 83–96%) when the deformation heat input at the upset stage or the upset burn-off length exceeded 500 J/s or 3 mm, respectively.
(2) The mixing layer interpolated intermetallic compounds of Al-Cu into the A1050 side formed at the weld interface. When the friction time was too long, joints having stable tensile strength fractured at the weld interface because of formation of the thick mixing layer.
(3) The fatigue strength of the joints which had stable tensile strength and fractured in the A1050 side in tensile testing was larger than that of the joint, which had low tensile strength and fractured at the weld interface in tensile testing. Judging from the fatigue limit, joints having a fatigue limit for A1050
base metal of 88–100% could be produced when the deformation heat input at the upset stage or the upset burn-off length exceeded a certain value.
(4) Under the friction welding conditions in the present study, tensile strength and fatigue strength, that is to say, the friction welding condition, could be evaluated by both the deformation heat input at the upset stage and the upset burn-off length.
REFERENCES
1) T. Sawai, K. Ogawa, H. Ochi, Y. Yamamoto, H. Furukawa and Y. Suga: J. Jpn. Light Metal Weld. & Const.38(2000) 66–76.
2) T. Sawai, K. Ogawa, H. Yamaguchi, H. Ochi, Y. Yamamoto and Y. Suga: J. JILM50(2000) 505–511.
3) Y. Yamamoto, H. Ochi, T. Sawai, K. Ogawa, R. Tsujino and M. Yasumomi: J. Soc. Mat. Sci. Jpn.53(2004) 512–517.
4) Ed. by Japan Friction Weld. Assoc., Friction Welding, (Corona Publishing Co. LTD., Tokyo, 1979) 34.
5) R. E. Peterson:Stress Concentration Design Factors, (John Wiley & Sons, New York, 1953) 43.
6) T. Sawai, K. Ogawa, H. Yamaguchi, H. Ochi, Y. Yamamoto and Y. Suga: J. JILM53(2003) 43–49.
7) Y. Itoh, T. Shindoh, M. Saitoh and M. Tezuka: Trans. Jpn. Soc. Mech. Eng. Sect A64(1998) 494–499.
8) M. Aritoshi, K. Okita, T. Enjo, K. Ikeuchi and F. Matsuda: Quarterly J. Jpn Weld. Soc.9(1991) 467–474.
9) S. Morozumi and M. Kikuchi: J. JILM32(1982) 195–201.
0
10
20
30
40
50
0
Unit deformation heat input
at upset stage,
q
fd/Js
-1
F
atigue limit,
σ
W/MP
a
3000
2000
[image:6.595.60.281.74.293.2]1000
Fig. 10 Relationship between fatigue limit and unit deformation heat input at upset stage.
0
10
20
30
40
50
0
Upset burn-off length,
δ
2/mm
F
atigue limit,
σ
W/MP
a
12
9
[image:6.595.319.533.75.268.2]6
3