Study of Thermal Stability of Ultrafine-Grained Copper
by means of Electron Back Scattering Diffraction
Ondrˇej Man
1, Libor Panteˇlejev
1and Ludvı´k Kunz
21
Institute of Materials Sciences and Engineering, Faculty of Mechanical Engineering, Brno University of Technology, Technicka´ 2896/2, 616 69 Brno, Czech Republic
2Institute of Physics of Materials, Academy of Sciences of Czech Republic, Zˇizˇkova 22, 616 62, Brno, Czech Republic
Thermal stability of ultrafine-grained (UFG) structure of 99.9% pure copper produced by eight equal channel angular pressing (ECAP) passes was studied. The annealing experiments were conducted at 180C in a tube furnace under argon as a covering gas. The dwell times were
in the range of 10 min to 120 min. The electron backscattering diffraction (EBSD) analyses were performed before and after annealing at exactly the same area in order to quantify the degree of decomposition of the UFG structure. Definition of grain boundaries was based on the misorientation angle of 1. More advanced analysis of the EBSD results based on a kernel average misorientation (KAM) parameter was
performed. Inverse pole figure maps with included grain networks did not reveal any substantial changes of UFG microstructure due to annealing. Some shift in the KAM modus in comparison with the initial state was observed but its magnitude was found negligible. Also changes in texture were found to be minor. On the other hand the microhardness increases with increasing time of annealing.
[doi:10.2320/matertrans.MC200909]
(Received July 24, 2009; Accepted October 13, 2009; Published January 25, 2010)
Keywords: ultra-fine grained copper, thermal stability of microstructure, electron backscattering diffraction, grain size, texture
1. Introduction
Equal channel angular pressing (ECAP) is one of the progressive methods of severe plastic deformation (SPD) used for enhancement of material properties via grain refinement.1)
One of the frequently discussed problems is the stability of ultra-fine grained (UFG) structures. It has been shown that the grain boundary structure of different materials is sensitive to elevated temperatures.2,3)The information on the stability
of UFG microstructures is still quite sparse. There is number of opened questions like these regarding the details of mechanism of grain coarsening.
The grain coarsening of UFG structures generally occurs at elevated temperatures.4)The formation of bimodal structure
was reported as well as changes in texture and an increase of low angle grain boundary (LAB) fraction in contrast to the amount of the high angle grain boundaries (HAB). These changes in microstructure result in changes of mechanical properties like microhardness, tensile characteristics and fatigue life.2–5)
The degree of ‘‘temperature effect’’ depends on the magnitude of strain imposed during the SPD process, i.e. on the number of passes through ECAP die and on the temperature of annealing. The dwell time at elevated temperature also results in changes of microstructure and in the related changes of properties attained during the SPD process.2)
There is no clear explanation of the temperature effect on UFG structure. It seems that the predominant role is played by the material purity, because alloying stabilizes the microstructure of UFG materials processed by ECAP.6,7) On the other hand impurities in UFG materials are undesir-able for many applications.8)Other factors, which may play a role, are the details of UFG microstructure, particularly the grain boundaries, which may vary according to the ECAP process.
For the characterization of microstructure, the EBSD technique beyond transmission electron microscopy (TEM) has been often used.9)EBSD analysis in material research is predominantly focused on changes of misorientation between adjacent analysed points which enables to characterize misorientation redistribution after thermal exposition.10) The kernel average misorientation analysis is increasingly applied for evaluation of average lattice distortion over given perimeter, i.e. for the representation of local strain.11)
The best method for evaluation of the changes taking place during thermal exposition is the observation ‘‘in situ’’, but this approach requires highly specific equipment and is thus rarely used so far.12)
Data from ‘‘ex situ’’ EBSD analysis are usually acquired from different areas of the same specimen and subsequently compared. This approach can lead to misinterpretation of the real state of microstructure, because the microstructure of severely plastically deformed material is inherently inhomo-geneous. That is why detailed EBSD analysis (especially texture analysis, calculation of grain size, misorientation angle distribution, KAM etc.) is definitely more accurate when performed at the same defined place before and after exposition.13)This approach can eliminate inaccuracy caused
by heterogeneity of UFG structures. Necessary prerequisite is to inspect sufficiently large area for this type of analysis.
The aim of the present paper is to examine the sensitivity of the UFG structure of copper produced by ECAP to grain growth during thermal exposition using EBSD analysis of the specific area on the specimen to eliminate sources of experimental errors due to material inhomogeneity.
2. Experimental Details
UFG copper of commercial purity (99.9%) was used in this study. The chemical composition is given in Table 1. Cylindrical billets of 20 mm in diameter and 120 mm in length were processed by eight passes of ECAP using route
Special Issue on Development and Fabrication of Advanced Materials Assisted by Nanotechnology and Microanalysis
BC14) at the laboratory of prof. R. Z. Valiev, Institute of
Physics of Advanced Materials, Ufa State Aviation Technical University, Russia. After ECAP, the billets were turned to 16 mm diameter and 100 mm length, Fig. 1.
The ultimate tensile strength and the yield stress of UFG Cu determined on four specimens wereUTS¼3875MPa and0:2 ¼3754MPa respectively.
Specimens with cross section approximately 44mm and length of 10 – 16 mm were machined from the billets. Specimen surface, parallel to the longitudinal axis of the billet, was carefully mechanically and finally electrolytically polished to enable the EBSD application. Electropolishing was performed in phosphoric acid-ethanol-water-isopropyl alcohol solution at 10 V with holding time of 60 s. The temperature of the electrolyte varied between 9 and 13C.
Annealing experiments were conducted at 180C in tube furnace under argon as a covering gas. The dwell times were in the range of 10 to 120 min. Temperature of the sample was controlled by Pt 100 thermal probe immersed into a shallow bore inside a specimen. Specimens were inserted to the preheated furnace and then, upon reaching the required temperature of the specimen, the dwell time was measured. After thermal exposition the specimens were cooled down in cold zone of the tube by the argon flow.
The EBSD analyses were made before and after annealing at specific area in order to quantify the degree of decom-position of the UFG structure. EBSD analyses were carried out with a Philips XL 30 scanning electron microscope with EBSD detector (TSL). Area of EBSD scans was3060mm with 0.15mm step. The grain sizes were calculated as diameter of a circle with the same area as the observed grain. Before and after thermal exposition the microhardness HV0:3 (using a 0.3 kg load) was measured for evaluation of the changes in mechanical properties during annealing.
3. Results
Figure 1 shows schematic drawing of positions of the samples inside the billet together with the system of
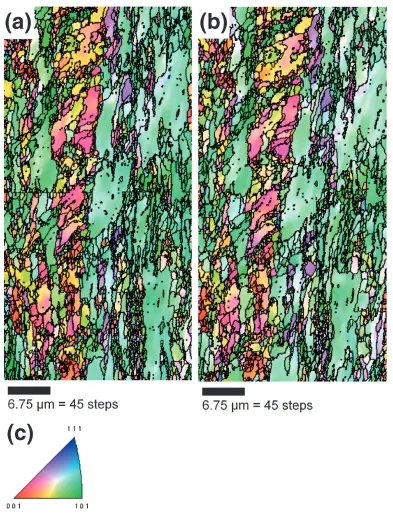
coordinates chosen for EBSD analyses. The microstructure of the UFG Cu as observed by means of EBSD is presented in Fig. 2. Microstructure of as-pressed sample, Fig. 2(a), in terms of the inverse pole figure map with included grain network shows combination of elongated small and large grains. Grain boundaries are characterized by the chosen misorientation angle of 1. Average grain size is 0.714mm. The same area of the specimen after thermal exposition at 180C for 120 min dwell time is shown in Fig. 2(b); the average grain size is 0.755mm. The color code for both inverse pole figure maps is in Fig. 2(c).
It is evident from the comparison of images before and after exposition that thermal exposition did not result in any substantial grain growth, only moderate redistribution of misorientation inside individual grains occurred. Microstruc-ture after thermal exposition seems to be rather finer.
Figure 3 shows the microhardness evolution with increas-ing dwell time. The hardness rises with increasincreas-ing annealincreas-ing time. Depicted points represent average values of 10 meas-urements of microhardness across the sample surface. The hardness tends to saturate with increasing time and after 120 min the average microhardness reaches the value of about 128 HV0:3.
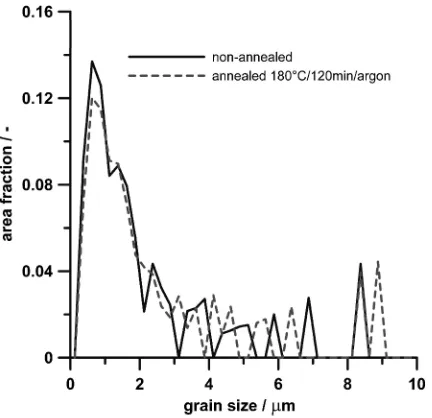
Grain size distribution in as-pressed state and after thermal exposition at 180C for 120 min is presented in Fig. 4. The maximum area fraction in both cases belongs to the grain size class with diameter 0.625mm; the respective area fraction being 0.137 for non-annealed state and 0.12 for the annealed one. This redistribution of grain size with respect to the area fraction is similar for all investigated dwell times (10, 30, 60 and 120 min) at chosen temperature. Only slight changes in grain size class occupancy for larger diameters were observed. Annealing of UFG Cu at 180C did not cause evolution of bimodal structure for all investigated dwell times.
The distribution of misorientation angles and kernel average misorientation before and after exposition for 120 min is presented in Figs. 5 and 6. Performed analysis shows that there are no significant changes in misorientation angles after thermal exposition. The small differences in distributions, which can be observed, lie within the scatter of the measurement accuracy. Generally, it can be concluded that the LAB (less than 15) or HAB fraction (more than 15) remains constant.
[image:2.595.48.552.86.128.2]Kernel average misorientation distribution was calculated for non-annealed and annealed state. For given pixel (kernel center) the average misorientation of that point with respect to its second nearest neighbors was calculated. KAM maximum of 3 was set for the calculation since higher values were proven unnecessary. This gave us an image of local lattice distortions within 0.3mm radius around each kernel center. Results of KAM analyses for 120 min dwell time are shown in Fig. 6. The distribution of kernel average
Table 1 Chemical composition of UFG Cu.
Cu, no less than Impurity (%), no more than
Bi Sb As Fe Ni Pb Sn S O Zn Ag
99.9% 0.001 0.002 0.002 0.005 0.002 0.005 0.002 0.004 0.05 0.004 0.003
[image:2.595.53.277.146.275.2]misorientation is practically the same for both observed states for all investigated annealing times.
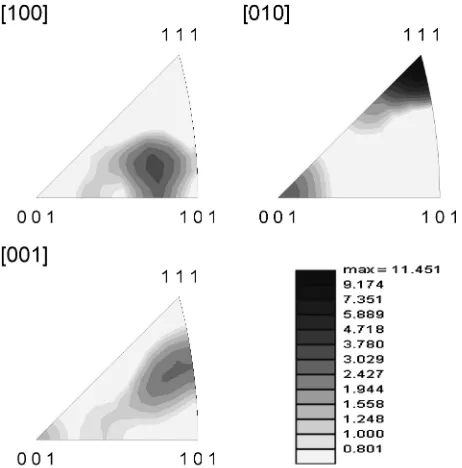
For detailed discovery of microstructural changes during thermal exposition, the texture analyses by means of EBSD were performed. Slight weakening of the texture achieved during ECAP process was observed after annealing for all selected dwell times. In Figs. 7 and 8 the textures in terms of inverse pole figures before and after annealing are shown for the case of 120 min dwell time. Several maxima can be seen in the texture: the (416) plane normal is aligned with ‘‘rolling direction’’ (RD) (i.e. longitudinal billet axis, Fig. 1), the (111) plane normal is aligned with ‘‘transverse direction’’ and (748) plane normal with ‘‘normal direction’’ (ND). Because
the microstructure of the billet after ECAP process is heterogeneous, the most pronounced planes in texture figures are different for each sample (Fig. 1). However comparison of the defined ‘‘specific area’’ on a single sample in non-annealed and non-annealed states gives qualitatively reliable view onto the texture evolution.
4. Discussion
Microstructural stability of UFG materials during thermal exposition is one of the most important limitations to their wider engineering application. There is no doubt that the grain coarsening of UFG Cu deteriorates mechanical
proper-Fig. 2 Comparison of UFG microstructure in (a) as-pressed state and (b) after thermal exposition at 180C/120 min/argon in terms of
[image:3.595.102.495.67.581.2]ties. Nevertheless, the explanation of the mechanisms of UFG microstructure coarsening and conditions under which the coarsening takes place are not clear. Moreover, the literature data are controversial. Thermal exposition up to 150C was reported as not relevant to the grain growth; related microstructural changes are minor.15) Insensitivity
of mechanical properties of ECAPed Cu up to 260C was found in Ref. 5). On the other hand, Molodova et al.2,16)
found that annealing at 150C for 2 min caused grain growth and evolution of bimodal structure; the decrease of micro-hardness was revealed already above 100C after 10 min annealing. This is in agreement with the experiments of Ho¨ppelet al.3)where the development of bimodal structure
at 170C was observed.
Results of the present work show that annealing at 180C does not result in any development of bimodal structure,i.e. there is no substantial local grain coarsening. Contrary to the results of Molodova et al.,16) who found considerable decrease of microhardness at 150C already after 100 s, the microhardness increase with longer dwell time on the temperature 180C was observed in the present study.
Fig. 5 Misorientation angle distribution in as-pressed state and after annealing.
Fig. 4 Grain size distribution before and after thermal exposition. Fig. 3 Evolution of microhardness after annealing at 180C.
Fig. 6 Kernel average misorientation distribution before and after annealing.
[image:4.595.69.271.65.236.2] [image:4.595.317.537.76.279.2] [image:4.595.62.278.276.485.2] [image:4.595.306.541.326.563.2] [image:4.595.61.277.527.668.2]Simultaneously, only very moderate changes (in the frame of the scatter of experimental data) in misorientation angle and grain size distribution were detected. Detailed KAM analysis revealed that the local distortion of lattice is qualitatively the same and the thermal exposition does not substantially change the KAM. Based on this, it could be concluded that annealing at investigated dwell times at 180C rather improved the hardness and did not deteriorate the UFG microstructure. Only slight weakening of texture achieved by ECAP process was found after annealing. This is in contrast with results of Etter et al.,17)showing pronounced changes
in texture as observed by EBSD already after 7 min 30 s annealing at 200C.
From the comparison of present results with literature data it follows that UFG Cu prepared by ECAP can exhibit differences as regards the stability of structure. One reason could be the influence of material purity on its behavior. This was suggested in Ref. 18); the UFG Cu of low purity exhibited better fatigue properties than UFG Cu of high purity. Another reason for different behavior can be sought in details of grain boundary structure. The UFG materials contain large volume fraction of grain boundaries which play more important role than in the case of conventionally grained metals. The yield stress is a function of nucleation conditions of dislocations at grain boundaries19) which can
substantially differ according to the details of ECAP conditions (ECAP rate, temperature, size of billets etc.). The observed increase of microhardness due to annealing can be explained by rearrangement of grain boundary structure, which cannot be observed by EBSD technique, but which can influence the conditions for dislocation movement and related mechanical properties, like hardness.
Materials prepared by severe plastic deformation often exhibit inhomogeneous microstructure in the whole volume of billets (in the case of ECAP), strips (accumulated
roll-bonding procedure) or disks (for high pressure torsion procedure). That is why it is important to choose more complex approach to microstructure evaluation and the ‘‘specific area method’’ seems to be the proper way, as also used in Ref. 13).
5. Conclusions
(1) The microhardness of ultra fine-grained Cu increases during annealing up to 120 min at 180C in Ar. (2) Electron backscattering diffraction analysis revealed
no grain growth after exposition at 180C for 10 up to 120 min.
(3) Changes in misorientation angle distribution are not significant for examined dwell times.
(4) Local lattice distortion evaluated from kernel average misorientations is qualitatively on the same level before and after thermal exposition.
(5) Only moderate changes in texture were observed after heating in comparison with as-pressed state.
Acknowledgement
This work was financially supported by the Ministry of education, youth and sports, under the contract 2E08017 and a project 1QS200410502 of the Academy of Sciences of the Czech Republic. This support is gratefully acknowledged.
REFERENCES
1) V. M. Segal: Mater. Sci. Eng. A197(1995) 157–164.
2) X. Molodova, G. Gottstein and R. J. Hellmig: Mater. Sci. Forum558– 559(2007) 259–264.
3) H. W. Ho¨ppel, M. Brunnbauer, H. Mughrabi, R. Z. Valiev and A. P. Zhilyaev: Proc. Materialsweek 2000, (Available from http://www. materialsweek.org/proceedings/).
4) R. K. Islamgaliev, F. Chmelik and R. Kuzel: Mater. Sci. Eng. A237 (1997) 43–51.
5) T. Kravchenko, A. Korshunov, N. Zhdanova, L. Polyakov and I. Kaganova: Mater. Sci. Forum584–586(2008) 960–965.
6) S. Lee, M. Furukawa, Z. Horita and T. G. Langdon: Mater. Sci. Eng. A 342(2003) 294–301.
7) K. Neishi, Z. Horita and T. G. Langdon: Mater. Sci. Eng. A352(2003) 129–135.
8) Y. Amouyal, S. V. Divinski, L. Klinger and E. Rabkin: Acta Mater.56 (2008) 5500–5513.
9) A. J. Wilkinson and P. B. Hirch: Micron.28(1997) 279–308. 10) W. Q. Cao, A. Godfrey, W. Liu and Q. Liu: Mater. Sci. Eng. A360
(2003) 420–425.
11) H. Li, E. Hsu, J. Szpunar, H. Utsunomiya and T. Sakai: J. Mater. Sci.43 (2008) 7148–7156.
12) O. V. Rofman, P. S. Bate, I. Brough and F. J. Humphreys: J. Microscopy233(2009) 432–441.
13) H. Kimura, Y. Kojima, Y. Akiniwa, K. Tanaka and T. Ishida: Key Eng. Mater.340–341(2007) 943–948.
14) K. Nakashima, Z. Horita, M. Nemoto and T. G. Langdon: Mater. Sci. Eng. A281(2000) 82–87.
15) J. Lian, R. Z. Valiev and B. Baudelet: Acta Metall. Mater.43(1995) 4165–4170.
16) X. Molodova, G. Gottstein, M. Winning and R. J. Hellmig: Mater. Sci. Eng. A460–461(2007) 204–213.
17) A. L. Etter, D. Solas, T. Baudin and R. Penelle: Mater. Sci. Forum495– 497(2005) 845–850.
18) P. Luka´sˇ, L. Kunz and M. Svoboda: Kovove Mater.47(2009) 1–9. 19) G. Saada: Mater. Sci. Eng. A400–401(2005) 146–149.
Fig. 8 Texture in terms of inverse pole figures (annealed state 180C/
[image:5.595.54.285.71.305.2]