A mathematical and experimental analysis of friction stir
welding of steel
AL-MOUSSAWI, Montadhar
Available from Sheffield Hallam University Research Archive (SHURA) at: http://shura.shu.ac.uk/20985/
This document is the author deposited version. You are advised to consult the publisher's version if you wish to cite from it.
Published version
AL-MOUSSAWI, Montadhar (2018). A mathematical and experimental analysis of friction stir welding of steel. Doctoral, Sheffield Hallam University.
Copyright and re-use policy
See http://shura.shu.ac.uk/information.html
A Mathematical and Experimental
Analysis of Friction Stir Welding of Steel
Montadhar Al-Moussawi
A thesis submitted in partial fulfilment of the requirements of Sheffield Hallam
University for the degree of Doctor of Philosophy
2018
Collaborating Organisation
I
Abstract
In the last decade there has been significant research into joining steel alloys using the Friction Stir Welding technique due to its ability to carry out welding below the melting point of the parent material and without using fillers such as in fusion welding techniques. This coincided with the increased use of DH36 and EH46 steel grades for ship building. The main reason for joining these steel grades by the friction stir welding technique is to reduce the weight of the vessel, as well as, the high welded joint quality especially mechanical properties such as fatigue and impact resistance. Other improved physical characteristics include increased tensile strength, microhardness and surface finish.
This research project has attempted to model friction stir welding using Computational Fluid Dynamics (CFD). Three different approaches have been used when considering the interface between the tool and the workpiece; these are torque, sticking/slipping and fully sticking. The project also investigates the mechanical properties of the welded joints including tensile, fatigue and microhardness. The microstructural evolution of welded joints carried out using different welding parameters is also investigated. The phenomenon of elemental precipitation/segregation during the friction stir welding process has been investigated and the limit of tool rotational speed at which the segregation occurs has been determined by modelling and also by heat treatment to simulate FSW. The purpose of the heat treatment trials was to attempt to replicate the temperature and time that the parent materials experiences during the FSW process. Defects in the weld joints associated with unsuitable friction stir welding parameters were also investigated and two new types of defect have been identified for the first time. Finally, tool wear has been investigated in the different weld joints in order to understand the suitable welding parameters that can prolong tool life.
The results from the mathematical modelling of FSW using CFD showed that the fully sticking assumption is the most effective approach for modelling friction stir welding of steel. The model also revealed that local melting at the advancing-trailing side of the tool is likely to occur at high tool rotational speeds. The experimental findings were in agreement with the results from the CFD model as the high tool rotational speed welded joints showed elemental segregation of Mn, Si, Al and O which only occurs when the peak temperature during welding approaches the melting point of steel.
II
Project's Contribution to Knowledge for FSW of Steel.
The project has introduced new ideas and new techniques which can be a step forward to
commercialize the FSW process of steel. The novel contributions are as follows:
It was found that a non-metallic layer along the weld line has been formed between
the SZ and HAZ in the high tool speeds welded joints (550 RPM, 400mm/min). This
layer can affect the thermocouple's readings and increase the experimental error for
the measurement of the peak temperature, so alternative methods of reading peak
temperature were considered and introduced.
Two new FSW defects have been identified,(1) a microcrack in the plunge-steady
state region when using an unsuitable traverse speed. (2) Microcracks associated with
precipitation of certain alloying elements such as TiN.
The FSW process has been found to be very sensitive to plunge depth, parts of a
millimetre can affect the heat generation, axial force values and defect formation.
The introduction of an optimised stationary shoulder tool can address the issue of
local melting, especially for high melting alloys with low thermal conductivity.
The estimation of peak temperatures of FSW from the metallurgical examination and
characterisation of TiN precipitates has been shown to be an alternative technique to
using thermocouples.
When CFD modelling the FSW process it has been shown that the fully sticking
assumption, validated by elemental segregation, was the most effective way of
assessing the tool-workpiece interface. Segregation of Mn, Al, Si and O was found to
III
Acknowledgements
First of all, I would like to thank Allah, our God and creator, who gave us the life and
knowledge.
The author would like to express thanks to the Ministry of Higher Education/Iraq for
financial support throughout the research. The author also would like to thank the following
people who without their help this work would never been completed. To my supervisor
Professor Alan Smith for continually providing support and encouragement and for Dr.
Masoumah Faraji, Dr. Andy Young and Steve Cater for their expertise.
To the technical support staff at Sheffield Hallam University especially Stuart Creasey, Paul
Allender and Dr. Bell Anthony.
A special thanks to Mathew Kitchen for his advice and support, to Mr Ali Reza the PhD
student at Sheffield Hallam University for his support in the CFD modelling. Thank you for
everyone who helped me during my PhD study.
IV
Project Outcomes and Cooperation
The following journal and conference papers have been published as part of the project outcomes.
Conference Presentations.
AL-MOUSSAWI, M., SMITH, Alan , YOUNG, Andrew E, FARAJI, M. and CATER, S.
(2016). An advanced numerical model of friction stir welding of DH36 steel. In: 11th International Symposium on Friction Stir Welding, TWI, Cambridge, 17-19 May 2016.
Smith, Alan, Al-Moussawi, M., Young, Andrew E, Cater, S. and Faraji, M. (2016).
Modelling of friction stir welding of 304 stainless steel. In: European Simulation and
Modelling Conference, Univ. of Las Palmas, 26-28th October 2016.
M. Al-Moussawi A J Smith, The Mechanism of Mn, Si, Al and O segregation in FSW of
DH36 Steel, 8th International Conference and Exhibition on Materials Science and
Engineering, May 29-31, 2017 Osaka, Japan.
Journal Publications
M. Al-Moussawi, A. J. Smith, A. Young, S. Cater & M. Faraji, 2017, Modelling of friction stir welding of DH36 steel, Int J Adv Manuf Technol, Published online 24 Feb 2017 on 10.1007/s00170-017-0147-y.
M. Al-Moussawi A J Smith, Thermo-Mechanical effect on Poly Crystalline Boron Nitride
Tool life During Friction Stir Welding (Dwell Period), Accepted paper, Metals and Material international Journal.
M. Al-Moussawi A J Smith, Friction Stir Welding of EH46 steel grade at Dwell Stage:
Microstructure Evolution, Accepted paper, Journal of Metallurgy, Microstructure and Analysis.
M. Al-Moussawi A J Smith, M. Faraji, Segregation of Mn, Si, Al, and Oxygen During the
Friction Stir Welding of DH36 Steel, Accepted paper, Journal of Metallurgy, Microstructure and Analysis.
M. Al-Moussawi A J Smith, Assumptions of Heat Generation in Modelling the Friction
Stir Welding of Steel, Accepted paper, International Journal of Modelling and simulation.
Journal Publications Under Review.
M. Al-Moussawi A J Smith, M. Faraji, Estimation of Peak Temperature and Cooling
Rate of Friction Stir Welding of EH46 Steel From TiN Precipitates, Under review, Journal of Material Science and Engineering A.
M. Al-Moussawi A J Smith, Poly Crystalline Boron Nitride Tool Wear During the
Friction Stir Welding of Steel, Under Review, Journal of Metallurgy, Microstructure and Analysis.
V
Nomenclature
Greek
Symbol Definition Units
𝛼 CFD material constant ---
𝛼𝑝 Probe slope angle degree
𝛼𝑠 Shoulder slope angle degree
𝜎 Stress N. m−2
σy The yield stress. N. m−2
𝜎xx Stress in X-direction N. m
−2
𝜎zz Stress in Z-direction N. m
−2
represent the amount of the mechanical energy converted to heat energy
(machine efficiency) ---
δo the initial partition of heat generated from plastic deformation to heat
generated from friction ---
The partition of heat generated from plastic deformation to heat
generated from friction (0 sticking, 1 sliding) ---
Stefan-Boltzmann constant.5.670373(21)×10−8 W m−2 K−4
𝜖 Emissivity of the plate surface. ---
strain ---
𝜀𝑖𝑗 strain tensor ---
𝜀𝑝. equivalent plastic strain rate s-1
𝜀𝑜. reference strain rate s-1
𝜀. strain rate s-1
𝜆 wave length of XR used (Braggs law) nm
𝜑 used to scale down heat generation (0-1) ---
𝜇 Friction coefficient ---
𝜇𝑢 Non-Newtonian viscosity Pa.s
Material density (Kg/m3)
𝜏contact Contact shear stress N. m−2
y
The yield shear stress N. m−2
The angle between a fixed direction in the plane of the specimen and the
projection in that plane of the normal to the diffracting lattice planes degree
𝛳 The Bragg angle degree
θ
The rotation angle of the tool. degree
𝜐 poisons ratio ---
ωo The Maximum rotational speed, RPM
𝜔
tool rotational speed. RPM
Ω The angle between the incident X-ray beam and the specimen surface degree
ψ The angle between the normal of the specimen and the normal of the
diffracting lattice planes degree
VI
Symbol Definition Units
A Area m2
Aprobend
Probe end area m2
Aprobeside Probe side area m2
Ashoulder Shoulder area m2
Ai material constant ---
Cp Specific heat J/Kg.K
do Free lattice space nm
dϕψ The inter-planer distance (d spacing) of strained material in the
direction of measurement defined by the angles ∅ and ψ nm
E Elastic modulus GPa
F Force N
h Heat convection coefficient W m-2.K -1
hj
The probe height mm
HV Vickers Hardness number Kg/mm2
k thermal conductivity coefficient W/m.K
M The torque
mo The flow rate of liquid or gas
KJ/Kg.K for liquids KJ/m3.K for gas m The thermal softening slope constant ---
n Strain rate slope ---
q heat flux W/m2
Qe Activation energy kJ mol−1
i Q
heat generated due to tool/workpiece interface. W
b
Q heat generated due to plastic deformation away from the interface. W
Qtotal Total heat generated from the tool W
Qshoulder Heat generated from the shoulder W
Qprobeside Heat generated from the probe-side W
Qprobend Heat generated from the probe end W
ri , ro Tool inner and out radii respectively m
Ris , Ros Maximum tool shoulder inner and outer respectively m Rip , Rop Maximum tool probe inner and outer respectively m
T Temperature K
𝑇∗ Homologous temperature K
To
The initial temperature. K
Tm
The solidus temperature. K
TNRX temperature of no recrystallization K
t time s
u flow velocity m/s
U The velocity of the tool in the welding direction m/s
Vx Velocity in the x-direction m/s
u, v, w velocity vectors in X,Y and Z direction respectively m/s
X X-coordinate m
Y Y-coordinate m
Z Z-coordinate m
VII
Abbreviations
ALE: Arbitrary Lagrangian Eulerian
AS: Advancing Side
αa: Acicular ferrite
αall: Allotriomorphic ferrite
BCC: Body Centred Cubic
BN: Boron Nitride
B: Bainite
CFD: Computational Fluid Dynamics
EDS: Energy Dispersive Spectroscopy
FSW: Fiction Stir Welding
FCA: Ferrite Cementite aggregate.
FEM: Finite Element Method
HAZ: Heat Affected Zone
HSLA: High Strength Low Alloy
PCBN: Poly Crystalline Boron Nitride
RS: Retreating Side
RX: Recrystallization
SAW: Submerged Arc Welding
SEM: Scanning Electron Microscopy
SZ: Stirred Zone
TC: Thermo-Couple
TEM: Transmission Electron Microscopy
VIII
List of Contents
1. Introduction………... 1
1.1 Objectives………... 4
2. Literature Review ………... 5
2.1 Friction Stir Welding (FSW) ………... 5
2.2 FSW Process Technique ………... 5
2.3 Friction Stir Welding Requirements ………... 6
2.4 Advantages and Limitations of FSW ……….. 7
2.5 Friction Stir Welding Applications ……….... 8
2.6 FSW Tools ………... 11
2.6.1 FSW Tool Geometry ………... 11
2.6.2 FSW Tool Requirements ………... 12
2.6.3 FSW Tools Materials ………... 13
2.6.4 PCBN FSW Tool Limitations and Wear/Breakage Issues ……….. 17
2.7 Material Welded by PCBN FSW tool ………. 18
2.8 FSW Process Parameters ………... 19
2.9 Material Flow around the FSW Tool ………... 22
2.9.1 Revealing Flow by Tracer Markers ………. 22
2.9.2 Estimating Material Flow from Numerical Simulation ……….. 24
2.10. Modelling the FSW Process ………... 27
2.10.1 Thermo-pseudo Mechanical Model ………... 28
2.10.2 Models Based on Material Flow and Heat Transfer (CFD) Techniques ……… 29
2.10.3 High Integrity Low Distortion Assembly HILDA project simulation work on DH36… 32 2.10.4 Advantages and Limitations of modelling using the CFD Technique……… 33
2.10.5 Models based on Torque………... 34
2.10.6 Summary of Previous work on Modelling of the FSW ………. 35
2.11 Materials ………... 36
2.11.1 Carbon Equivalency ………... 38
2.11.2 Phase Transformation Temperatures ……….. 38
2.11.3 The mechanism of formation of acicular ferrite and bainite……… 41
2.11.4 The effects of elements on austenite grain growth and precipitates formation………… 43
2.11.5 The difference between DH36 and EH46 in term of interstitial elemental percentage… 44 2.11.6 TiN Precipitates in Steel………... 45
2.12 Microstructure evolution and mechanical properties in FSW of Steel………... 46
2.13 FSW Defects………... 54
IX
2.14.1 Method of Measuring Residual Stresses………. 60
2.14.1.1 Numerical Methods Validated by Experiments……….. 60
2.14.1.2 Non-destructive Experimental Methods Based on X-ray……… 62
2.14.2 Sin2ψ Method Limitations ………... 64
2.14.3 Effect of Sectioning on Residual Stresses……….. 65
2.15 Measuring the FSW Temperature Experimentally………. 66
2.16 Summary of Literature Review………... 68
3 Numerical and Experimental Procedures………. 69
3.1 Introduction………... 69
3.2 Friction Stir Welding Machine and Samples Sizes……….. 70
3.3 Experimental Procedures………... 73
3.3.1 Metallographic Examination………... 73
3.3.2 Scanning Electron Microscopy SEM and EDS Examination………... 74
3.3.3 Calculating the BN percentage and TiN frequency in EH46 weld joints………. 74
3.3.4 Infinite Focus Microscopy (IFM) ………... 75
3.3.5 Micro-Hardness Measurement………... 75
3.3.6 Plates Preparation (FSW DH36 Steel) for Tensile and Fatigue Tests……….. 76
3.3.7 Thermocouples Set-up………... 79
3.3.8 Heat Treatments of DH36 and EH46 as received………. 81
3.3.9 Residual Stresses Measurement using X-ray Diffraction 2 Sin Method………... 83
3.3.10 X-Ray Diffraction -Scanning………... 84
3.4 Numerical Procedure………... 85
3.4.1 A Heat Equation for a Moving Heat Source………. 86
3.4.2 Heat generated during the FSW Process……….. 86
3.4.2.1 Heat generated due to plastic deformation away from the interface ( b Q )………... 86
3.4.2.2 Heat generated at Tool/Workpiece Interface ( i Q )………... 87
3.4.3 FSW Model Assumption………... 88
3.4.3.1 Torque Model………... 88
3.4.3.2 Sticking/Slipping Mathematical Solution Model………. 91
3.4.3.3 Fully Sticking Conditions………... 94
3.4.4 CFD numerical analysis equations………... 95
3.4.5 Geometry and Mesh of FSW Tool and Workpiece……….. 97
3.5.4.1 Geometry………... 97
3.5.4.2 Mesh of the Designed Geometry of FSW Tool and Workpiece……….. 100
X
3.4.6 Boundary Conditions………... 104
3.4.6.1 Representing the Material Flow………... 104
3.4.6.2 Heat Transfer From the Tool and Workpiece………... 106
3.4.6.3 The "Named Selection walls" surfaces and interior of the plate………... 108
3.4.6.4 Rotational/Traverse Speeds………... 108
3.4.6.5 Gravitational Forces………... 109
3.4.7 CFD Solution Method………... 109
3.4.8 User Defined Function (UDF) ………... 110
3.4.9 Materials Data Input for Modelling………... 110
3.4.10 The Independence of solution on Mesh……… 111
4 Results and Analysis………... 113
4.1 Friction Stir Welding Process Parameters Graphs……… 113
4.1.1 FSW of DH36 6mm plate thick ………... 113
4.1.2 FSW Process Parameters Graphs for FSW of DH36 steel plate (W9).…………. 121
4.1.3 FSW Process Parameters Graphs of EH46 (Plunge/dwell experiments W1-W7)…... 122
4.1.4 FSW Process Parameters Graphs of EH46 W8-W10……….. 128
4.2 Infinite Focus Microscopy (IFM) ………... 133
4.2.1 IFM Plunge Depth Experiments of EH46 W1-W7………..…………. 133
4.2.2 IFM of measured depths of 6mm and 8mm DH36 keyholes, SZ and HAZ following FSW. ………... 136
4.2.3 IFM macrographs of EH46 W8 and W10..………. 136
4.2.4 IFM image and measurements of the PCBN FSW tool………... 137
4.2.5 Distortion comparison between FSW and MIG welded 8mm thick DH36 steel plates, measured by using IFM. ..……….. 137
4.3 X-Ray Diffraction (XRD) Result………... 148
4.3.1 XRD scan of the top surface of Galvanised as received DH36 sample and polished DH36 and EH46 Parent Material.………... 148
4.3.2 XRD scans of FSW of DH36 samples……….. 148
4.3.3 XRD scanning of FSW samples of EH46 W1-W10………. 148
4.3.4 Residual Stresses………... 149
4.4 Mechanical Tests………... 158
4.4.1 Tensile test result………... 158
4.4.2 Fatigue Test result………... 161
4.4.3 Micro-hardness………... 162
4.5 SEM Analysis of DH36 and EH46 Steel in the as Received Condition………. 167
4.6 SEM FSW of DH36 samples at low (W9) and high (W6) tool speeds……… 173
XI
4.6.2 DH36 W6………... 174
4.7 SEM of EH46 W1-W7 Plunge Experiments……… 179
4.8 SEM Images of FSW samples W8 and W10 (EH46) showing the SZ and HAZ …... 189
4.9 Heat Treatment Trails of DH36 and EH46 Steel samples ……….………..…… 196
4.10 TiN precipitate in EH46………... 201
4.10.1 TiN precipitates in the heat treated samples………. 201
4.10.2 The Effects of the cooling rate on TiN particle size………. 202
4.10.3 TiN precipitates in FSW of EH46 Samples……….. 203
4.10.4 Comparison of the TiN Precipitates in FSW and Heat Treated Samples………. 204
4.11 Segregation/Precipitation Analysis using SEM-EDS of DH36 and EH46 of heat treated samples in temperature ranges of 1400oC to 1500oC……… 215 4.11.1 Heat treatments of DH36 and EH46 grades at 1400 oC ………... 215
4.11.2 Heat treatments of DH36 and EH46 grades at 1450 oC……… 216
4.11.3 Heat treatments of DH36 and EH46 grades at 1500 oC……… 217
4.11.4 SEM-EDS scanning regarding the elemental segregation of FSW samples of DH36 at high tool speeds (550RPM, 400mm/min) W6 and W8……… 218
4.11.5 Understanding Segregation process………... 219
4.12 Wear of Friction Stir Welding Tool………... 249
4.12.1 Tool Wear in FSW of DH36 at High Tool Rotational/Traverse Speeds……….. 249
4.12.2 Tool Wear in FSW EH46 W1-W7 Plunge/Dwell Samples……….. 249
4.12.3 Tool Wear in FSW EH46 (W8 and W10) FSW Under Steady State Conditions………. 250
4.13 Defects in FSW of Steel………... 262
4.14 CFD Modelling results………... 270
4.14.1 Mesh refinement………... 270
4.14.2 Material properties of the workpiece as a function of temperature………. 270
4.14.3 FSW Model Result of DH36………... 271
4.14.4 FSW Tool Optimisation………... 306
4.14.5 CFD results of Modelling EH46 Grade ……….. 308
5 Discussion………... 320
6. Conclusion……….………. 321
7. Further Work……….………. 325
8. References……….. 326
XII
List of Figures
Figure 1.1 Golden Mask of Tut-Ench-Amun as example of Egyptian soldering in 1330 B.C…. 1
Figure 1.2 Distribution of production costs for (a) SAW; (b) FSW; (c) FSW machine direct
cost……….. 2
Figure 2.1 The steps of the FSW process………. 6
Figure 2.2 An entire body of a car made of aluminium and fully welded by FSW technique…. 9 Figure 2.3: Eclips 500, the first aircraft used FSW technique……… 9
Figure 2.4: The Space Shuttle with two gigantic external fuel tank……….. 10
Figure 2.5: Panel joined by FSW technique for marine applications……… 10
Figure 2.6: FSW tools developed at TWI company. -a- WhorlTM and -b- MxTrifluteTM ……… 12
Figure 2.7: a- SEM image of PCBN Q70 (70% cBN, 30%WRe) [20], b-PCBN tool image…….. 14
Figure 2.8: The Cooling system including PCBN tool for FS welding ferrous alloys…………. 15
Figure 2.9: The relationship between ω , V and plunge depth is as studied by for FSW of AA6061-T651………. 20
Figure 2.10: Forces and torque generated during the FSW process……… 20
Figure 2.11: Metal working process model suggested by Arbegast , (a) Material flow map. (b) Suggested zones formed during FSW process……… 25
Figure 2.12: Strain aging temperature vs. strain rate for DH36 steel..……… 37
Figure 2.13: CCT diagram shows the effects of deformation on ferrite and bainite start temperatures of HSLA-65 steel grade………. 40
Figure 2.14: Volume percent microstructure constituents vs cooling rate in thermally cycled……….. 40
Figure 2.15: The effect of austenite grain size on the development of microstructure in steel containing inclusions. ………. 42
Figure 2.16: The effect of Ti element on the formation of acicular ferrite, more acicular ferrite with increasing Ti content……… 42
Figure 2.17: The effects of V, Ti, Nb and Al on the austenite grain size, titanium is the most effective element in preventing austenite grain growth when heating to high temperatures………. 43
Figure 2.18: Equilibrium solubility products of carbides and nitrides in austenite ……… 43
Figure 2.19: The effects of micro-alloying content on the recrystallization stop temperature of austenite in a 0.07 C, 1.4 Mn, 0.25 Si steel (in wt pct). ……… 44
Figure 2.20: Macrograph of polished and etched FSW region of 6mm DH36 steel grade……….. 46
Figure 2.21: Micro-hardness data for microstructure constituents in steel……….. 47
Figure 2.22: Fatigue testing of FSW samples compared to SAW samples………. 48
Figure 2.23: DH36 8mm thickness a-FSW single side, b-SAW double side……….. 48
Figure 2.24: Void formation estimated from ALE model……… 57
Figure 2.25: Defects found in FSW of 6mm DH36 steel……… 57
Figure 26: Residual stresses associated with FSW process, Longitudinal (red colour), transversal (blue colour) ……… 59
Figure 2.27: The location of ψ angle and the in-plane stresses……… 62
Figure 2.28: The effect of sectioning on RS relaxation in 7449Al alloy………. 65
Figure 2.29: Variation of longitudinal RS at weld centreline as a function of fractional length of the 7449Al-welded plate………. 65
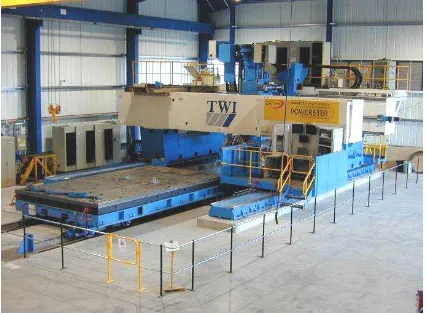
Figure 3.1: TWI’s PowerStir™ FSW machine.( Courtesy of TWI, Image No. SYF001357)…... 70
XIII
Figure 3.3: Micro-hardness profiles (horizontal and vertical in red colour) across the traverse
direction of the FSW weld joint. ……… 75
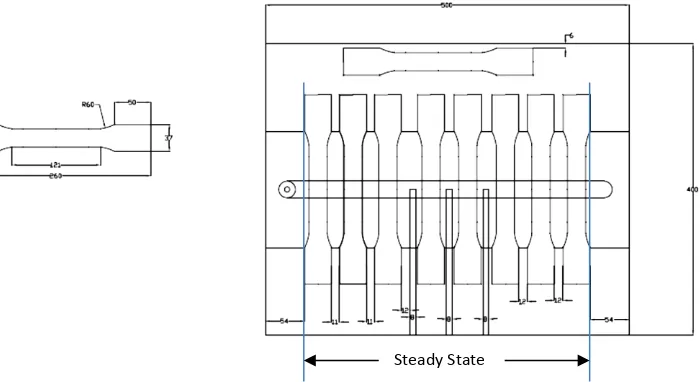
Figure 3.4: An AutoCAD designing for the samples of the 1000mm plate before the water jet cutting process. ……….. 77
Figure 3.5: An AutoCAD designing for the samples of the 500mm plate before the water jet cutting process. ……….. 77
Figure 3.6: The dimensions of Tensile and Fatigue sample (in mm) conducted based on EN-BS 895:1995 and BS 7270 standards………. 77
Figure 3.7: A photograph of the 1000mm plate after water-jet cutting……….. 78
Figure 3.8: A photograph of the 500mm plate after water-jet cutting……… 78
Figure 3.9: Tensile and fatigue testing device. ……….. 78
Figure 3.10: Thermocouples locations at the bottom of 6mm DH36 plate……….. 79
Figure 3.11: EH46 thermocouples location W1 to W7 (plunge/dwell period) at the top of plate surface. ……… 79
Figure 3.12: EH46 W8 to W10 showing the thermocouples location at the top of plate surface… 80 Figure 3.13: EH46 steel, 14.8mm plate thick with different plunge and welds conditions. six Thermocouples set up are around each weld. ………. 80
Figure 3.14: The variation of yield stress with temperature for mild steel……….. 91
Figure 3.15: Variation of sticking/slipping parameter with the tool radius. The values calculated from eq. 3.35. ……….. 93
Figure 3.16: Variation of coefficient of friction with the tool radius. The value of friction coefficient decrease significantly at the tool periphery when the tool rotational speed increases. ………... 94
Figure 3.17: The three dimensional image for the PCBN tool using IFM shows shoulder, probe side and probe end. ………. 97 Figure 3.18: 2 dimensional cross section produced by IFM showing the dimensions of the tool….. 98
Figure 3.19: The PCBN Tool .a-Real Image. b- CAD model. ……… 98
Figure 3.20: Geometry of 6mm DH36 and PCBN tool. ………. 99
Figure 3.21: Geometry of 14.8mm EH46 and PCBN tool. ………. 99
Figure 3.22: Mesh metric of the 6mm plate thick -a- Aspect Ratio, -b- Skewness. and -c-Orthogonal Quality mesh. ………... 102
Figure 3.23: Mesh metric of the 14.8mm plate thick -a- Aspect Ratio, -b- Skewness. and -c-Orthogonal Quality mesh. ……….. 103
Figure 3.24: The material flow around the tool in FSW (steady state), material is moved from point 1 to point 2. ……… 104
Figure 3.25: Boundary Conditions applied on the workpiece and FSW tool……….. 109
Figure 3.26: Convergence in FLUENT analysis, -a- Residual convergence, -b-Torque convergence. ………... 112
Figure 3.27: Traverse section showing the mesh of a-6mm plate with PCBN FSW tool of 5.5mm probe length and b- 14.8 mm plate with PCBN FSW tool of 12mm probe length. ……… 112
Figure 4.1 Welding parameters with time of 6mm FSW DH36 steel (W3) recorded on the PowerStir FSW machine. ……… 115
Figure 4.2: Welding parameters with travelled distance of 6mm FSW DH36 steel (W3) recorded by PowerStir FSW machine. ……… 115 Figure 4.3 : Welding parameters with time of 6mm FSW DH36 steel (W4) recorded by PowerStir FSW machine. ……… 116
Figure 4.4: Welding parameters with travelled distance of 6mm FSW DH36 steel (W4) recorded by PowerStir FSW machine. ……….. 116
XIV
Figure 4.6: Welding parameters with travelled distance of 6mm FSW DH36 steel (W5) recorded
by PowerStir FSW machine. ……… 117
Figure 4.7: Welding parameters with time of 6mm FSW DH36 steel (W6) recorded by PowerStir FSW machine. ……… 118
Figure 4.8: Welding parameters with travelled distance of 6mm FSW DH36 steel (W6) recorded by PowerStir FSW machine. ………. 118
Figure 4.9: Welding parameters with time of 6mm FSW DH36 steel (W7) recorded by PowerStir FSW machine. ……… 119
Figure 4.10: Welding parameters with travelled distance of 6mm FSW DH36 steel (W7) recorded by PowerStir FSW machine. ……… 119
Figure 4.11: Welding parameters with time distance of 6mm FSW DH36 steel (W8) recorded by PowerStir FSW machine. ……… 120
Figure 4.12: Welding parameters with travelled distance of 6mm FSW DH36 steel (W8) recorded by PowerStir FSW machine. ……….. 120
Figure 4.13: Welding parameters with time of 8mm FSW DH36 steel (W9) recorded on the PowerStir FSW machine. ……… 121
Figure 4.14: Welding parameters with distance travelled of 8mm FSW DH36 steel (W9) recorded by PowerStir FSW machine. ……… 122
Figure 4.15: Welding parameters with time (W1 the 14.8mm EH46 steel, plunge experiment), recorded by PowerStir FSW machine. ……… 123
Figure 4.16: Welding parameters with time (W2 the 14.8mm EH46 steel plunge, experiment), recorded by PowerStir FSW machine. ……… 123
Figure 4.17: Welding parameters with time (W3 the 14.8mm EH46 steel plunge, experiment), recorded by PowerStir FSW machine. ……… 124
Figure 4.18: Welding parameters with time (W4 the 14.8mm EH46 steel, plunge experiment), recorded by PowerStir FSW machine. ……… 124
Figure 4.19: Welding parameters with time (W5 the 14.8mm EH46 steel, plunge experiment), recorded by PowerStir FSW machine. ……… 125
Figure 4.20: Welding parameters with time (W6 the 14.8mm EH46 steel, plunge experiment), recorded by PowerStir FSW machine. ……… 125
Figure 4.21: Welding parameters with time (W7 the 14.8mm EH46 steel, plunge experiment), recorded by PowerStir FSW machine. ……… 126
Figure 4.22: Welding parameters with time recorded on the PowerStir FSW machine, 14.8mm FSW EH46 steel (W8). ………... 129
Figure 4.23: Welding parameters with travelled distance recorded by PwerStir FSW machine, 14.8mm FSW EH46 steel (W8). ………. 129
Figure 4.24: Welding parameters with time recorded by PwerStir FSW machine, 14.8mm FSW EH46 steel (W9). ……… ……… 130
Figure 4.25: Welding parameters with travelled distance recorded by PwerStir FSW machine, 14.8mm FSW EH46 steel (W9). ……… 130
Figure 4.26: Welding parameters with time recorded by PwerStir FSW machine, 14.8mm FSW EH46 steel (W10). ……….. 131
Figure 4.27: Welding parameters with travelled distance recorded by PowerStir FSW machine, 14.8mm FSW EH46 steel (W10). ……….. 131
Figure 4.28: IFM 3D image and surface profile for W1 EH46 steel grade………. 138
Figure 4.29: IFM 3D image and surface profile for W2 EH46 steel grade. ……… 138
Figure 4.30: IFM 3D image and surface profile for W3 EH46 steel grade. ……… 138
Figure 4.31: IFM 3D image and surface profile for W4 EH46 steel grade. ……… 139
Figure 4.32: IFM 3D image and surface profile for W5 EH46 steel grade. ……… 139
Figure 4.33: IFM 3D image and surface profile for W6 EH46 steel grade. ……… 139
XV
Figure 4.35: Micrographs of longitudinal cross section taken from samples of EH46 W1-W7,
polished and etched by 2%Nital. ………
141
Figure 4.36: IFM 3D image of 8mm FSW DH36, keyhole plunge depth 7.7mm……… 142
Figure 4.37: IFM 3D image of 6mm FSW DH36, keyhole plunge depth 5.8mm……… 142
Figure 4.38: W1 DH36 macrograph adapted from [61 p596] ………. 143
Figure 4.39: Macrograph of FSW of DH36 6mm measured by IFM, -a- W6 , -b-W8……… 143
Figure 4.40: DH36 8mm macrograph measured by IFM, 200RPM, 100mm/min………... 143
Figure 4.41: IFM 3D image and surface profile for keyhole of W8 EH46 steel grade, 11.67mm 144 Figure 4.42: IFM 3D image and surface profile for keyhole of W9 EH46 steel grade,11.43mm… 144 Figure 4.43: IFM 3D image and surface profile for keyhole of W10 EH46 steel grade, 11.67mm depth. ………... 144
Figure 4.44: EH46, W8 macrograph at plunge stage measured by IFM……….. 145
Figure 4.45: W10 macrograph at plunge stage measured by IFM………... 145
Figure 4.46: EH46, W8 FSW macrograph at steady state……… 145
Figure 4.47: EH46 W10, FSW macrograph at steady state measured by IFM……… 146
Figure 4.48: IFM 3D image and surface profile for PCBN FSW tool (24mm diameter, 5.5mm probe length which used to produce the 6mm weld joints). ……… 147
Figure 4.49: IFM 3D image and surface profile for DH36 W9 (section through the transverse welding direction), 8mm plate, FSW 200RPM, 100mm/min showing distortion angle = 1.25o. ……… 147
Figure 4.50: IFM 3D image and surface profile for DH36 (section through the transverse direction), DH36, 8mm plate, MIG welding technique, distortion angle=2.5o……. 147
Figure 4.51: XRD scan of the Galvanised DH36 top surface, Ferrite peaks are in red, Zn peaks are in blue. ……….. 150
Figure 4.52: XRD scanning of DH36 grade as received shows that microstructure is mainly ferrite phase, Co target (Kα 1.79 (Å)) was used. ……… 151
Figure 4.53: XRD scanning of EH46 grade as received shows that the microstructure is ferritic (BCC), Cu-target Kα 1.54 (Å) was used. ………. 151
Figure 4.54: XRD scanning of FSW of DH36 grade (200RPM, 100mm/min), microstructure is ferritic phase without any change after FSW process, Cu-target Kα 1.54 (Å) was used. ……… 152
Figure 4.55: XRD scan of FSW of DH36 grade (550RPM, 400mm/min), microstructure is mainly ferrite phase; BN peaks are also present. Co target (Kα 1.79 (Å)) was used. ……… 152
Figure 4.56: XRD scan of FSW of EH46 grade (Plunge experiments from W1-W7 at region 1 under shoulder), microstructure is mainly ferritic BCC phase; BN peaks are also existed, Cu-target (Kα 1.54 (Å)) was used. ……… 153
Figure 4.57: XRD scan of FSW of EH46 grade (W2 Plunge under shoulder), microstructure is mainly ferritic BCC phase,BN peaks are present, Co target (Kα 1.79 Å) was used. 154 Figure 4.58: XRD scan of FSW of EH46 grade -a- W10 top of SZ, -b- W10 probe end, -c- W8 top of SZ and -d-W8 at the and probe., Microstructure is ferritic phase, BN peaks are present , Cu-target Kα 1.54 (Å) was used.. ………... 154
Figure 4.59: XRD scan of FSW of EH46 grade (comparison between W8 and W10 at the top of SZ), W10 shows stronger peak of BN than W8, Cu-target Kα 1.54 (Å) was used…. 155 Figure 4.60: XRD scan of FSW of EH46 grade (comparison of the first peaks of W8 and W10 at the probe end), W10 shows stronger peak for BN than W8, Cu-target Kα 1.54 (Å) was used. ……… 155
Figure 4.61: Combination of (Ω − 2𝛳) curves Taken directly from the XRD-machine and as explained in Table 17. ……… 156
XVI
stresses and free lattice space (do) ………. 157
Figure 4.63: Longitudinal residual stresses distribution along the W9 and W6 DH36 FSW joints. 157
Figure 4.64: 8mm DH36 FSW and PM samples after Tensile test……….. 159
Figure 4.65: The Engineering Stress Strain curves of the tensile test of 8mm DH36 FSW and PM
samples. ……… 159
Figure 4.66 : Photographs of tensile testing samples, the broken FSW sample and also a sample
for parent metal. ……… 160
Figure 4.67: The load/displacement graph of the tensile test of welded and unwelded 6mm DH36
steel plate samples. ……….. 160
Figure 4.68: Fatigue test of a- DH36 8mm thickness W9 (200RPM, 100mm/min) and b-Dh36 W6
(6mm 550RPM, 400mm/min). ……… 161
Figure 4.69: HV micro-hardness distribution between AS and RS of DH36 8mm plate (200RPM,
100mm/min). ………. 164
Figure 4.70: HV micro-hardness distribution between AS and RS of W6 DH36 6mm plate
(550RPM, 400mm/min). ………. 164
Figure 4.71: HV micro-hardness distribution from the top of SZ towards the plate bottom of
DH36 8mm plate (200RPM, 100mm/min)……….. 165
Figure 4.72: HV micro-hardness distribution from the top of SZ towards the plate bottom of W6
DH36 6mm plate (550RPM, 400mm/min)……….. 165
Figure 4.73: Micro-hardness distribution (300HV) between AS and RS of EH46 W8 (150RPM,
50mm/min) and EH46 W10 (150RPM, 50mm/min) 14.8mm plate……… 166
Figure 4.74: Micro-hardness distribution (300HV) from the top of SZ towards the plate bottom of
FSW W8 and W10 EH46 steel. ………. 166
Figure 4.75: DH36 steel in the as received condition, a- low magnification shows 15µm ferrite
grains and bands of pearlite. ………. 168
Figure4.76: Higher magnification SEM image showing Ti rich particles………. 168
Figure 4.77: DH36 as received steel samples, high magnification showing Nb, Ti and
combination of Ti-Nb particles. ……….. 169
Figure 4.78: SEM-EDS of DH36 as received steel sample polished but in the un etched condition
showing a MnS stringer. ……….. 169
Figure 4.79: SEM-EDS of DH36 as received steel showing a MnS-CaS particle………. 169
Figure 4.80: SEM-EDS of DH36 steel as received showing MnS-Al stringer like particle……... 170
Figure 4.81: EH46 as-received steel polished and etched in 2% Nital showing -a- 20 µm ferrite
grains and bands of pearlite, -a-low magnification. -b-higher magnification………. 170
Figure 4.82: Ti and Ti-Nb alloying elements in the as received EH46……… 171
Figure 4.83: SEM-EDS of EH46 steel as received showing Nb rich particles……… 171
Figure 4.84: SEM-EDS of EH46 steel as received showing a Nb-Ti rich particle elements……... 171
Figure 4.85: SEM-EDS of EH46 steel as received showing an alumina-calcium sulphide particle. 172
Figure 4.86: SEM-EDS of EH46 steel as received showing a MnS-CaS particles………. 172
Figure 4.87: An SEM micrograph of the middle of the SZ of the low tool rotational/traverse
speeds (200RPM, 100mm/min) FSW. The SZ shows a mixture of Bainite and
acicular ferrite. ……… 175
Figure 4.88: SEM micrograph of low FSW tool rotational/traverse speeds (200RPM,
100mm/min) at the weld root, showing 2µm average ferrite grain size……….. 175
Figure 4.89: An SEM micrograph of the HAZ of low FSW tool rotational/traverse speeds W9
(200RPM, 100mm/min), 5µm ferrite grains (dark phase) with nodular cementite
(bright phase). ……… 176
Figure 4.90: SEM micrograph of the high FSW tool rotational/traverse speeds (W9) (550RPM,
XVII
Figure 4.91: SEM micrograph of the high tool rotational/traverse speeds FSW (W6) (550RPM,
400mm/min) ……… 177
Figure 4.92: SEM micrograph of the high tool rotational/traverse speeds (550RPM, 400mm/min) FSW (W6). ……….. 177
Figure 4.93: SEM micrograph of the high tool rotational/traverse speeds FSW (W6) (550RPM, 400mm/min). ……….. 178
Figure 4.94: Affected regions identified following the weld tool plunge trials……….. 182
Figure 4.95: SEM micrographs of EH46 W1 for all regions of interest……… 183
Figure 4.96: SEM micrographs of EH46 W2 for all regions of interest.……… 184
Figure 4.97: SEM Micrographs of EH46 W5 for all regions of interest.……… 185
Figure 4.98: SEM micrographs of EH46 W6 for all regions of interest.……… 186
Figure 4.99: SEM Micrographs of EH46 W7, Region 1 under shoulder, the microstructure is mainly αa and probe end, coarser ferrite grains. ………. 188
Figure 4.100: -a-FSW EH46 W8 top-middle SZ ferrite matrix with a mixture of short plated and granulated cementite. -b- FSW EH46 W10 middle SZ showing a ferrite matrix with short plated cementite and some bainite phase. ……….. 191
Figure 4.101: -a- FSW EH46 W8 SZ, RS showing acicular ferrite with some B inside 150 micron prior austenite and some 20µm ferrite grains. -b- FSW EH46 W8 SZ, AS showing acicular ferrite with some nodular ferrite of 20 µm. Allotriomorphic (αall) ferrite also appears in both SZ of AS and RS. ………... 191
Figure 4.102: -a-FSW EH46 W8 SZ, RS showing higher magnification, acicular ferrite with some B inside 150 micron prior austenite and some 20µm ferrite grains. -b- FSW EH46 W8 SZ, AS showing higher magnification, acicular ferrite with some nodular ferrite of 20 µm. Allotriomorphic (αall) ferrite is also present in both SZ of AS and RS…… 192
Figure 4.103: -a-FSW EH46 W10 SZ, RS shows a mixture of acicular ferrite with B phase. -b- FSW EH46 W10 SZ, AS shows a mixture of acicular ferrite with B phase………… 192
Figure 4.104: -a-FSW EH46 W10 SZ, RS shows at higher magnification, a mixture of acicular ferrite with B phase, -b- FSW EH46 W10 SZ, AS shows, at higher magnification, a mixture of acicular ferrite with B phase. ……… 193
Figure 4.105: -a-FSW EH46 W8 Probe end shows the weld nugget and TMAZ. The weld nugget has a 4 µm fine ferrite grains due to the effects of high strain rate and slower cooling rate (dynamic RX), the region affected by tool rotation TMAZ shows larger ferrite grains. -b- FSW EH46 W10 probe end shows 10µm ferrite grains with a mixture of nodular ferrite (dark phase) and short plate cementite (bright phase)………. 193
Figure 4.106: -a- FSW EH46 W8 HAZ, RS shows 15µm ferrite grains with nodular and short plated cementite and some island of pearlite. -b- FSW EH46 W10 HAZ, RS shows 12 µm ferrite grains (dark phase) with nodular and short plated cementite (bright phase) and some island of pearlite. ……… 194
Figure 4.107: -a-FSW EH46 W8 IHAZ, AS shows 20µm ferrite grains (dark phase) with short plated cementite (bright phase) and some B. -b- FSW EH46 W8 OHAZ, AS 10 µm shows ferrite grains (dark phase) with nodular and short plated cementite (bright phase). ……… 194
Figure 4.108: -a-FSW EH46 W10 IHAZ, AS shows ferrite matrix with plates of cementite. -b- FSW EH46 W10 OHAZ, AS shows 10µm ferrite grains with nodular cementite….. 195
Figure 4.109: SEM images show prior austenite grain size of DH36 Grade when heat treated with different peak temperatures. ……… 197
Figure 4.110: SEM images show prior austenite grain size of EH46 when heat treated with different peak temperatures and 10min holding time. ……… 198
XVIII
Figure 4.112: Prior austenite grain size with temperature for heat treated samples of DH36 and
EH46 in temperature range 1000oC-1500 oC with holding time of 10min………….. 200
Figure 4.113: SEM image for the EH46 as received shows -a-interstitial elements of Ti and other
elements and -b- Ti-Nb combination. ………. 205
Figure 4.114: SEM-EDS high magnification of as received EH46 shows Ti spectra……… 206
Figure 4.115: EH46, heated to 1130 o C for 1min, hot Oil Q, a-SEM image, -b-EDS spectra…….. 206
Figure 4.116: EH46 heated to 1240C for 1min, hot oil Q, a-SEM image, -b-EDS spectra………... 206
Figure 4.117: EH46, heated to 1400oC for 1min, oil Q, a-SEM image, -b-EDS spectra…………... 207
Figure 4.118: EH46 heated to 1240 oC for 1min followed by oil quenching. TiN particles sizes
90-300nm. ………... 207
Figure 4.119: SEM images of a heat treated samples of EH46 at 1673K (1400oC) for 30 sec and a
different cooling rate. -a- oil Q, -b-hot oil Q, -c- air cooling, -d- cooling inside
furnace. ……… 208
Figure 4.120: -a-The relation between TiN precipitates size µm and the cooling rate oC (holding
time is 10 sec), the precipitates size increase with decreasing the cooling rate……... 209
Figure 4.120: -b-The relation between TiN precipitates size µm and the cooling rate oC/s (holding
time is 30 sec), the precipitates size increase with decreasing the cooling rate……... 209
Figure 4.121: Frequency Distribution (%) of the TiN particle size (µm) observed in the heat treated
samples with hot oil quenching -a-1250oC for 10 sec, -b-1400oC for 10 sec,
-c-1250oC for 30 sec and -d-1400oC for 30 sec. ……… 210
Figure 4.122: -a- and -b- TiN particles in FSW EH46 W8 (150RPM, 50mm/min), average size is
600nm, -c- and -d- TiN particles in FSW EH46 W10 (150RPM, 50mm/min), average
size is 500nm. ……….. 211
Figure 4.123: EH46 W10 (plunge/dwell period) probe-end, -a-low and -b- high Magnifications,
showing many TiN precipitates (size is 0.7-1.5µm). ……… 212
Figure 4.124: EH46 (plunge/dwell period) region 1 under shoulder -a-W2 average of 0.7µm TiN
particles, -b- W3, average of 0.5µm TiN particles……… 212
Figure 4.125: EH46 W6 (plunge/dwell period) under shoulder, average of 0.5µm TiN particles…. 213
Figure 4.126: The Frequency Distribution (%) of the TiN particle size (µm) observed in -a- FSW
EH46 W8 and W10, -b- FSW EH46 (Plunge/Dwell) W1-W7. ………. 213
Figure 4.127: EH46 W2 (plunge/dwell period) under probe average of 0.35µm TiN particles…… 214
Figure 4.128: SEM-EDS mapping of DH36 heat treated for 1 min at 1400oC with oil quenching
showing precipitation/segregation of Mn, S and Nb at prior austenite grain boundary
(PAGB). ……… 221
Figure 4.129: SEM-EDS mapping of DH36 heat treated at 1400oC for 1 min with oil quenching
showing precipitation/segregation of Mn, S and Nb at prior austenite grain boundary
(PAGB). ………. 222
Figure 130: SEM-EDS Point and ID of DH36 heat treated at 1400oC for 10 min with oil
quenching showing precipitation/segregation of different types of elements -a- Mn,
S, Ca and O. -b- Mn, S and P. -c- Mn, Ca, Al and O. ……… 223
Figure 4.131: SEM-EDS Point and ID of DH36 heat treated at 1400oC for 10 min with oil
quenching showing precipitation/segregation of elements mainly Mn, S and Al….. 224
Figure 4.132: SEM-EDS Point and ID of EH46 heat treated at 1400oC for 1 min with oil quenching
showing precipitation/segregation of alumina-S and P elements………. 225
Figure 133: Alumina-CaS precipitation in the EH46 heat treated at 1400 oC for 10min………… 226
Figure 4.134: Ti, Nb and Al precipitation in the EH46 heat treated at 1400 oC for 10min………… 226
Figure 4.135: SEM-EDS shows Ti, S and Al precipitation in the EH46 heat treated at 1400 oC for
10min. ……….. 226
Figure 4.136: SEM image of DH36 heat treated at 1450oC for 1 min with oil quenching showing
precipitation/segregation of Mn, Al, S and O elements as identified by EDS……… 227
XIX
4 min with hot oil quenching showing precipitation/segregation of Mn, Al, Si and O
elements as identified by EDS. ……… 227
Figure 4.138: SEM-EDS mapping of DH36 heat treated at 1450oC for 4 min with oil quenching
showing Mn, Si, Al and O segregation. ……… 228
Figure 4.139: SEM-EDS of DH36 heat treated samples for 10min at 1450oC and oil quenching
shows elements segregation mainly Mn, Si, Al and O. Ca and S are also present in
some regions. ………. 229
Figure 4.140: SEM images of EH46 heat treated for 1min at 1450oC and oil quenched, Mn,S,Al,Nb
segregation as identified by EDS. ………. 230
Figure 4.141: SEM images low and high magnification of EH46 heat treated for 1min at 1450oC
and oil quenched shows Nb, P and S segregation at prior austenite grain boundary as
identified by EDS test. ……….. 230
Figure 4.142: Different types of elemental segregation/precipitation as identified by EDS including
(Mn, P, V, S, Al, O, Si, Ti and Ca), samples are EH46 heated to 4min at 1450oC
followed by oil quenching. ……… 233
Figure 4.143: SEM-EDS of EH46 heat treated samples for 10min at 1450oC and oil quenching
shows elements segregation of Mn, V, Ti and Nb. ……….. 234
Figure 4.144: SEM-EDS of EH46 heat treated samples for 10min at 1450oC and oil quenching
shows elements segregation of Mn, Ti, Al, Si and O. ………. 234
Figure 4.145: EDS mapping EH46 1450oC 15min OIL Q shows the segregation of Mn, Si, Al and
O. ………. 235
Figure 4.146: SEM of EH46 heat treated samples for 15min at 1450oC and oil quenching, Mn, Si,
Al and O segregation as identified by EDS. ………... 236
Figure 4.147: SEM high magnification of EH46 heat treated samples for 15min at 1450oC and oil
quenching, Mn, Si, Al and O segregation as identified by EDS. ……… 236
Figure 4.148: SEM (-a- low and -b- high magnification) of DH36 sample heat treated for 1min at
1500oC with oil quenching, Mn, Si, Al and O segregation as identified by EDS…... 237
Figure 4.149: SEM-EDS of DH36 sample heat treated for 1min at 1500oC with oil quenching, Mn,
Si, Al and O segregation. Region is 1mm away from the outer sample surface... 237
Figure 4.150: DH36 sample heat treated for 1min at 1500oC with oil quenching,-a- SEM (high
magnification) shows Mn, Si, Al and O spinel segregation, -b- PS segregation as
identified by EDS. ………. 238
Figure 4.151: SEM-EDS of EH46 sample heat treated for 1min at 1500oC with oil quenching, Mn,
Si, Al and O segregation. ……….. 238
Figure 4.152: EDS mapping of EH46 sample heat treated for 1min at 1500oC with oil quenching,
Mn, Si, Al and O segregation. ……… 239
Figure 4.153: SEM images low and high magnification of FSW of DH36 (W6) shows elemental
segregation (Mn, Si, Al, O and Zn) as identified by EDS. ……… 242
Figure 4.154: SEM images high magnification of FSW of DH36 (W8) shows elemental
segregation (Mn, Si, Al, O and Zn) as identified by EDS. ……… 242
Figure 4.155: SEM-EDS at high magnification of FSW of DH36 (W6) shows elemental
segregation (Mn, Si, Al, O and Ca) as identified by EDS. ……… 224
Figure 4.156: SEM-EDS shows elements segregation of Mn, O, Si, Al and Zn in the SZ of high
tool speeds (W6). ……… 243
Figure 4.157: EDS mapping of Zn in the elemental segregation of the SZ of DH36 W6 as
identified by EDS. ……….. 243
Figure 4.158: SEM-EDS shows elemental segregation of Mn, O and Si in the SZ of FSW DH36 at
high tool speeds (W6). ……… 244
Figure 4.159: SEM-EDS shows elemental segregation of Mn, O and Si in the SZ of FSW DH36 at
XX
Figure 4.160: SEM image at the SZ of FSW DH36 at high tool speeds (W8) shows elemental
segregation as identified by EDS. ………. 244
Figure 4.161: SEM-EDS shows big size (300 µm X 20µm) of elements segregation of Mn, O, Si,
Al and Zn in the SZ of high tool speeds weld (W6). ……… 245
Figure 4.162: SEM-EDS shows elements precipitation of Alumina, Ca and S in the SZ of high tool
speeds weld (W8). ………. 245
Figure 4.163: -a- Alumina-CaO-MnS-CaS reaction heating to 1450oC, holding time 1min,oil
quenching. -b- Alumina-CaO-MnS-CaS reaction advance heating to 1450oC, holding
time 2min,oil quenching. ………... 246
Figure 4.164: -a- Alumina-CaO-MnS-CaS reaction advance heating to 1450oC, holding time
3min,oil quenching. -b-Alumina-CaO-MnS-CaS reaction with joining other elements
such as Si, Nb and P when heating to 1450oC, holding time 4min,oil quenching. .….. 246
Figure 4.165: -a- Formation of Nb Sulphide and Ti sulphide heating to 1450oC, holding time
4min,oil quenching., -b- Forming Nb, P Sulphide and Nb, P, Ti and V sulphide,
heating to 1450oC, holding time 4min,oil quenching. ……….. 247
Figure 4.166: -a- Formation of Nb, P and V sulphides heating to 1450oC, holding time 4min,oil
quenching., -b- formation of pure Calcium sulphide heating to 1450oC, holding time
5min,oil quenching. ……….. 247
Figure 4.167: Mn, Si, Al and O start to form with few percentage of other elements such as Ti and
Nb -a- low and -b- high magnifications. heating to 1450oC, holding time 10min,oil
quenching. ……… 248
Figure 4.168: Formation of Pure Mn, Si, Al and O as identified by EDS, heating to 1450oC,
holding time 15min and oil quenching. ………. 248
Figure 4.169: 12-8µm BN particles in SZ of FSW DH36 joint (W6, 550RPM, 400mm/min)……. 251
Figure 4.170: 10µm BN particles in SZ of FSW DH36 joint (W8, 550RPM, 400mm/min)………. 252
Figure 4.171: SEM image at the top of the SZ of DH36 (W6) which clearly shows the existence of
BN particles. ……… 252
Figure 4.172: SEM images of EH46 (W1) at plunge/dwell case show BN particles (dark spots)
sizes are from 0.5 µm -13µm. -a-low magnification and -b-high magnification…… 252
Figure 4.173: SEM images of EH46 (W2) at plunge/dwell case show BN particles (dark spots)
sizes are from 0.5 µm -13µm. -a-low magnification and -b-high magnification…… 253
Figure 4.174: SEM images of EH46 (W3) at plunge/dwell case show BN particles (dark spots)
sizes are from 0.5 µm -13µm. -a-low magnification and -b-high magnification…… 253
Figure 4.175: SEM images of EH46 (W4) at plunge/dwell case show BN particles (dark spots)
sizes are from 0.5 µm -13µm. -a-low magnification and -b-high magnification……. 254
Figure 4.176: SEM images of EH46 (W5) at plunge/dwell case show BN particles (dark spots)
sizes are from 0.5 µm -13µm. -a-low magnification and -b-high magnification……. 254
Figure 4.177: SEM images of EH46 (W6) at plunge/dwell case show BN particles (dark spots)
sizes are from 0.5 µm -13µm. -a-low magnification and -b-high magnification……. 255
Figure 4.178: SEM images of EH46 (W7) at plunge/dwell case show BN particles (dark spots)
sizes are from 0.5 µm -13µm. -a-low magnification and -b-high magnification……. 255
Figure 4.179: EH46 at Plunge/dwell case, Probe side bottom (region-2 bottom), -a-W2 and -b-W6.. 256
Figure 4.180: SEM higher magnification EH46 W2 at Plunge/dwell case under shoulder……….. 256
Figure 4.181: BN particle in the top of the SZ of FSW EH46 (W8) ………. 257
Figure 4.182: BN particles with different sizes at the top of the SZ of FSW EH46 (W8)…………. 257
Figure 4.183: 0.5 µm BN particle at the probe end of FSW EH46 (W8). ………. 258
Figure 4.184: Top surface of SZ (steady state) full of different sizes of BN particle in the (EH46
W10) ………... 258
Figure 4.185: BN particle in SZ of the probe end region of FSW EH46 (W10). ………. 259
Figure 4.186: Top centre of SZ of EH46 W8 (steady state), showing BN particles, -a- low
XXI
Figure 4.187: EH46 W8 (steady state),-a- The middle of SZ (no BN particles), microstructure is
mainly acicular ferrite, b- Probe end SZ (BN particles are present), microstructure is
mainly granular ferrite and some short plated cementite. ……….. 260
Figure 4.188: Top middle centre of SZ of EH46 W10 (steady state) full of BN, -a- low
magnification (un-etched) and -b- high magnification (etched). ……… 260
Figure 4.189: EH46 W10 (steady state),-a- The middle of SZ (no BN particles), microstructure is
mainly acicular ferrite, b- Probe end (BN particles are present), microstructure is
mainly granular ferrite and cementite. ……… 261
Figure 4.190: High magnification SEM image EH46 W10 (steady state) at probe end shows BN
particles. ……… 261
Figure 4.191: micro crack started from the top surface of FSW DH36 W1 between steady state and
the plunge regions. -a- low magnification, b-high magnification. The sample was cut
in the direction of the weld line. ……….. 265
Figure 4.192: Feed rate and the distance travelled by tool in the plate just before the steady state... 265
Figure 4.193 SEM images of microcracks inside the SZ………. 266
Figure 4.194: Weld root and kissing bond in 6mm FSW DH36 (W8) ……….. 266
Figure 4.195: SEM of the first and second defects of DH36 6mm W8 shown in Fig. 4 -a- Weld
root, -b- kissing bond. ……… 266
Figure 4.196: Non-metallic layer of (Fe, Mn, Si, Al and O) between the SZ and HAZ found in W6,
-a- 10µm at plunge period, -b- 1.3µm at steady state period………... 267
Figure 4.197: A void found in EH46 steel W10 (steady state) in AS. ……….. 267
Figure 4.198: High amount of BN particles found near the void at AS, EH46 steel W10 (steady
state) ………. 268
Figure 4.199: SEM of the SZ of DH36 W6 a- microcrack caused by TiN particle, b-Microcrack
caused by Al P S elemental precipitates. ……… 268
Figure 4.200: SEM images show microcracks caused by TiN precipitates (exceeds 1µm) -a- FSW
EH46 W10 SZ at steady state, -b- DH36 sample heat treated to 1300oC with slow
cooling (cooling inside furnace). ……… 269
Figure 4.201: Non-metallic Elemental segregation of Mn, Si, Al and O found in high FSW tool
speeds of the SZ of W6. ……….. 269
Figure 4.202: Variations in peak temperature results with reference to the number of elements
(mesh refinement) of W2 6mm DH36. ……….. 287
Figure 4.203: Variation in peak temperature results with reference to the number of elements
(mesh refinement) of W2 14.8mm EH46. ……….. 287
Figure 4.204: Thermal conductivity (W/m.oC) contours of tool and plate (W1 at 200RPM,
100mm/min) and (W6 at 550RPM, 400mm/min), thermal conductivity of DH36
plate decrease during FSW process according to equation 3.64……….. 288
Figure 4.205: Specific heat (J/Kg.oC) contours of tool and plate W1 at 200RPM, 100mm/min and
W6 at 550RPM, 400mm/min, thermal conductivity of DH36 plate vary as a function
of temperature during FSW process according to equations 3.65 and 3.66………….. 288
Figure 4.206: Temperature (oC) contour distribution between the advancing and retreating sides
(torque model). a- slow tool speed (W2), b- high tool speeds (W6)………... 289
Figure 4.207: Temperature (oC) contour distribution between the advancing and retreating sides
(sticking/slipping model). a- slow tool speed (W2), b- high tool speeds (W6)……... 289
Figure 4.208: Top view of contours of temperature (°C) for 6 different welding conditions
(samples W1 to W8) ………... 291
Figure 4.209: CFD results show the temperature distribution between the leading-trailing sides at
the top of SZ of welded samples W1 to W6. ……… 292
XXII
SZ of welded samples W1 to W6. ………. 292
Figure 4.211: Temperature-time curve of W2, comparison of thermocouples data and CFD, model.
A distance of 100 mm staring from the plate bottom centre towards the welding line
was divided by the welding velocity in order to represent the time (60 sec). ………. 293
Figure 4.212: Temperature-time curve of W8, comparison of thermocouples data and CFD, model.
A distance of 100 mm staring from the plate bottom centre towards the welding line
was divided by the welding velocity in order to represent the time (15 sec). ……… 293
Figure 4.213: Side view, perpendicular to the welding direction, contours of temperature (°C) for 6
different welding conditions (samples W1 to W6) (ANSYS FLUENT). The cantor
bar has been unified for better comparison. ……… 294
Figure 4.214: CFD results show the temperature distribution between the AS-RS at the top of SZ
of W1-W6. ……….. 295
Figure 4.215: CFD results show the temperature distribution in the tool probe and plate bottom of
W1-W6. ……….. 295
Figure 4.216: Comparing the numerical temperature contours (K) and the experimental steady state
welding conditions for sample W1 DH36 ………. 296
Figure 4.217: Comparing the numerical temperature contours (K) and the experimental steady state
welding conditions macrograph (IFM) of sample W6. ………. 296
Figure 4.218: The temperature (oC) contours around the PCBN tool surfaces for six different
welding conditions; (W1 to W6-8) ……….. 297
Figure 4.219: temperature (oC) distribution on the tool surface and shear layer (TMAZ) for samples
W6-8 showing the maximum temperature for high speed welds (550RPM). ……… 298
Figure 4.220: The distribution of strain rate (s-1) in the contact surface of the tool/workpiece for the
6 different studied conditions W1 through W6-8. ……… 298
Figure 4.221: The distribution of relative velocity (m/s) between the tool/workpiece interfaces for
the 6 different studied conditions W1 through W6. ……….. 299
Figure 4.222: The distribution of local pressure (Pa) between advancing and retreating sides……… 300
Figure 4.223: The CFD modelled local pressure (Pa) distribution between the leading and trailing
side of the tool surface for sample W5……… 300
Figure 4.224: Material flow path lines in and around the tool/workpiece contact region aW2 and
-b-W5 (3D top view). ……….. 301
Figure 4.225: The material flow coloured by local velocity (m/s) (3D Advancing-Retreating sides)
for -a-low tool speeds sample W2 and -b-high tool speeds for sample W6………….. 301
Figure 4.226: CFD model results showing the Viscosity (Pa.s) distribution around the
tool/workpiece for data taken form 6 of the experimental welds W1 - W6 -W8…… 302
Figure 4.227: Comparison of CFD viscosity contours with IFM macrograph of W2………... 302
Figure 4.228: Comparison of CFD viscosity contours with IFM macrograph of W6………... 302
Fig. 4.229: Local values of viscosity (Pa.s) on the top surface of the SZ for -a-low tool speeds
W2 and -b-high tool speeds W6. ……… 303
Figure 4.230: Predicted shear stress (Pa) contours on the tool surface (W1-W6)………. 304
Figure 4.231: Stationary shoulder with probe speeds of 950RPM, 400mm/min………... 305
Figure 4.232: The results of CFD modelling for temperature oC, strain rate s-1, velocity m/s and
viscosity Pa.s at probe/workpiece interface after optimisation study on the FSW tool, Tool speeds 550RPM/400mm/min. Material is 304 stainless steel. The shoulder of
the tool is stationary……… 306
Figure 4.233: Temperature (oC) contours at the top surface of EH46 plates during the dwell case…. 312
XXIII
plate during the dwell case for two tool rotational speeds, 120RPM and 200RPM… 312
Figure 4.235: CFD results show the temperature distribution along the top centre of the FSW for
grade EH46 steel during the dwell case. ……… 313
Figure 4.236: Transverse section shows the velocity contours (m/s) in the tool/workpiece contact
region at the dwell case for a tool rotational speed of 120 RPM and 200 RPM……. 314
Figure 4.237: Transverse section shows the strain rate contours (1/s) in the tool/workpiece contact
region at the dwell case for a tool rotational speed of 120RPM and 200RPM. ……… 314
Figure 4.238: Transverse section shows the viscosity contours (Pa.s) in the tool/workpiece contact
region at the dwell case for a tool rotational speed of 120RPM and 200RPM. ……… 314
Figure 4.239: FSW tool surface temperature at 120 RPM and 200 RPM (dwell case)………. 315
Figure 4.240: Tool surface shear stress (Pa) for tool rotational speeds of 120 RPM and 200 RPM
(during dwell case) ……… 315
Figure 4.241: CFD modelled temperature (oC) contours at the top surface of EH46 plates for
samples W8 and W10 under steady state welding conditions. ……….. 316
Figure 4.242: The CFD modelled temperature distribution between the leading and trailing sides
for samples W8 and W10 FSW of 14.8mm EH46 steel. ……… 316
Figure 4.243: The CFD modelled cooling rate for samples W8 and W10 FSW of 14.8mm EH46
steel at the weld centre. ……….. 317
Figure 4.244: Transverse view shows the CFD modelled temperature (oC) contour of the PCBN
tool and the EH46 steel plate for samples W8 and W10. ……….. 317
Figure 4.245: The thermo-coupled measured temperature distribution between AS and RS of
samples W8 and W10 FSW of 14.8mm EH46 steel. ………. 318
Figure 4.246: CFD modelled transverse views show the strain rate contour (1/s) of the plate of
EH46 W8 and W10 at the contact region with the tool. ……… 319
Figure 4.247: Transverse view shows the CFD modelled viscosity contour (Pa.s) of the plate of
EH46 W8 and W10 at the contact region with the tool. ………. 319
XXIV
List of Tables
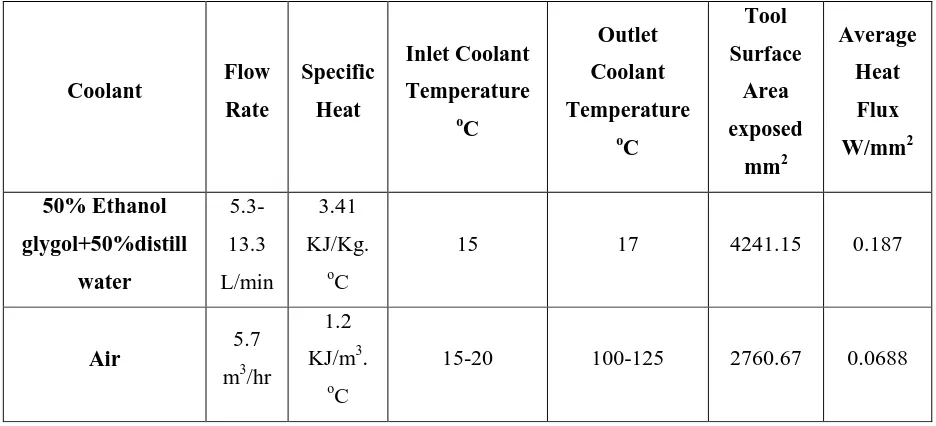
Table 2.1: The physical properties of PCBN compared with few other materials……… 15 Table 2.2: PCBN tool geometry provided by TWI………... 16 Table 2.3: The various coolants types for shank and collar parts of the tool with associated
characteristics………..……… 16 Table 2.4: Materials welded by PCBN tool………. 18 Table 2.5: Chemical Composition of as-Received DH36 Steel (wt%)……… 37 Table 2.6: Chemical composition of EH46 Steel Grade (wt%)………... 37 Table 2.7: Materials properties at room temperature……….. 37 Table 2.8: Heat Treatment and Transformation Data for Continuously Cooled 0.17 wt %C
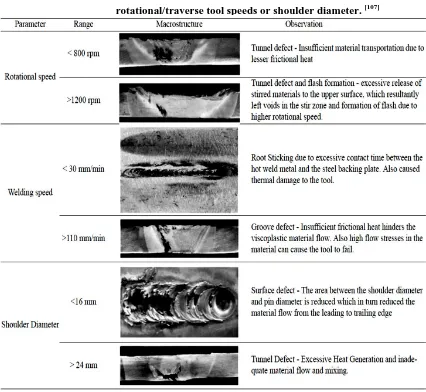
1.46 wt %Mn steels table adopted from ………. 41 Table 2.9: The difference between acicular ferrite and bainite formation………... 42 Table 2.10: Defects in FSW ferritic stainless steel caused by unsuitable rotational/traverse
tool speeds or shoulder diameter. ……… 55 Table 3.1: TWI’s PowerStir™ FSW machine Specifications……….. 71 Table 3.2: Heat treatments of DH36 and EH46 in the temperature range 1000 oC to 1500 oC.
Note: Maximum holding time for DH36 at 1450 oC is 10min………. 82 Table 3.3: The standard of mesh metric and the "very good" accepted range……….. 101 Table 3.4: The various coolants types for shank and collar parts of the tool with associated
characteristics………..………. 107 Table 3.5: Thermal properties of the PCBN tool ………. 110 Table 4.1: Eight welding conditions provided by TWI and used in the CFD analysis………. 114 Table 4.2 : The maximum, minimum and average of axial force (Z-force) and longitudinal
force (X-force) and torque of FSW 8mm DH36 (W9) ……… 122 Table 4.3: The welding conditions of FSW EH46 plunge/dwell period (W1-W7)………….. 127 Table 4.4: Thermocouples measurements for the seven plunge trials……….. 127 Table 4.5: Welding conditions of FSW EH46 steel at steady state (W8-W10)……… 132 Table 4.6: The welding conditions, the IFM measurements of plunge depth and area of
affected zones W1-W7 EH46 steel. ……… 141 Table 4.7: Welding conditions and IFM measurements of DH36 steel 6mm and 8mm plate
thickness. ………..………. 143
Table 4.8: Welding conditions (Steady state) and IFM measurements of FSW EH46 W8
and W10. ………..……….. 146
Table 4.9: The data required in order to estimate residual stresses. ……… 156 Table 4.10: A comparison of the results of uniaxial tensile testing 8mm thick DH36 plate
which has been FSW at 200RPM/ 100mm/min, and compared with un-welded
PM samples. ………..……….. 159
Table 4.11: The results of the tensile test (6mm plate thickness with FSW 550 RPM/
400mm/min). ………..………. 160
Table 4.12: Fatigue test results of DH36 8mm thickness (200RPM, 100mm/min)……… 161 Table 4.13: Fatigue test results of DH36 6mm thickness (550RPM, 400mm/min)……… 162 Table 4.14: Microstructure of the different affected regions of EH46 W3, W4, W5 and W7… 187 Table 4.15: TiN average particle size of EH46 W1 to W7 at the shoulder-probe region……... 213 Table 4.16: Heat treatments of DH36 steel grade from 1400 oC-1500 oC………... 240 Table 4.17: Heat treatments of EH46 steel grade from 1400 oC-1500 oC……… 241 Table 4.18: BN percentage (%) in EH46 plunge case at shoulder/probe side region, the
scanned area is 1mm2………..………. 257 Table 4.19: BN percentage (%) in EH46 steady state of W8 and W10 at middle top of SZ and
at the probe end. The scanned area is 1mm2……… 261 Table 4.20: Predicted values for the maximum temperature and torque obtained by the
proposed numerical model for 8 welded samples with different rotational and
1 1. Introduction
Welding, brazing and soldering can be defined as processes for joining materials together
which includes a heat source. The Sumerians, during the Bronze age (3000BC) in Ur (Iraq),
made swords which were joined by hard soldering [1].
The first recorded welding or solid-phase welding was carried out by Egyptian people when
iron ore had converted to sponge iron by heating in a charcoal fire; the particles were then
forge welded together by hammering, figure 1.1 is an example for Egyptian ancient soldering.
The first US patent granted was to Coffin in 1892 for arc welding using a metal electrode [1].
Welding processes have evolved over time with much innovation occurring during the Second
World War due to the need for weapons production. Friction welding has been classified as a
solid state welding process because the workpiece to be joined is heated to about 0.8 of the
melting point [2]. Heat generated in Friction welding comes from the mechanical action
between one moving surface and another stationary thus producing heat mainly by friction.
The main advantages of friction welding is that no filler material is added and also the welded
joint is produced with lower heat input; thus reduced metallurgical degradation, distortion and
residual stresses are expected [3].
Figure 1.1: Golden Mask of Tut-Ench-Amun as example of Egyptian soldering in 1330 B.C.[1]
Friction Stir Welding (FSW) can be classified as a modified version of traditional friction
2
originally employed primarily for welding aluminium grades which had been classified as
un-weldable alloys by using existing fusion techniques. [4]
The high demands on obtaining sound welds especially in the marine industry has encouraged
companies like TWI to extend the FSW technique to include the joining of steel alloys.
However, the process to date is still under developmen
![Figure 2.5: Panel joined by the FSW technique for marine applications [3].](https://thumb-us.123doks.com/thumbv2/123dok_us/678017.570534/36.595.240.373.92.278/figure-panel-joined-fsw-technique-marine-applications.webp)
![Figure 2.8: The Cooling system for a PCBN tool for FS welding ferrous alloys [21].](https://thumb-us.123doks.com/thumbv2/123dok_us/678017.570534/41.595.154.453.439.747/figure-cooling-pcbn-tool-fs-welding-ferrous-alloys.webp)
![Table 2.4: Materials welded by PCBN tool [6 P116]](https://thumb-us.123doks.com/thumbv2/123dok_us/678017.570534/44.595.100.503.353.644/table-materials-welded-pcbn-tool-p.webp)
![Figure 2.18: Equilibrium solubility products of carbides and nitrides in austenite [85]](https://thumb-us.123doks.com/thumbv2/123dok_us/678017.570534/69.595.213.418.278.497/figure-equilibrium-solubility-products-carbides-nitrides-austenite.webp)
![Figure 2.21: Micro-hardness data for microstructure constituents in steel. [77 P586]](https://thumb-us.123doks.com/thumbv2/123dok_us/678017.570534/73.595.202.397.91.228/figure-micro-hardness-data-microstructure-constituents-steel-p.webp)
![Figure 2.27: The location of ψ angle and the in-plane stresses .[128 P1404]](https://thumb-us.123doks.com/thumbv2/123dok_us/678017.570534/88.595.223.404.616.739/figure-location-ps-angle-plane-stresses-p.webp)