Running to
stand still?
a CPRE report
Acknowledgement
The advice and very helpful comments of DETR officials on earlier drafts and versions of this report are gratefully acknowledged, and in particular their provision of important data, documents and explanations of the forecasts. Any remaining mistakes, and all policy inferences, are the sole responsibility of the author.
Phil Goodwin is Professor of Transport Policy, Head of the Centre for Transport Studies, and Director of the ESRC Transport Studies Unit, at University College London. He was co-author of SACTRA reports on environmental appraisal (1992), induced traffic (1994) and transport and the economy (1999), and chair of the panel of advisors appointed to help write the 1998 White PaperA New Deal for Transport.
The picture above is thought to be the formula for overall average ‘percentage change in congestion’ as used for Transport 2010: the Ten Year Transport Plan, where
q
art is forecast traffic volume,v˜
artis assumed free speed,v
artis ‘actual’ (modelled) speed, for each area type a, road type rand time period t, for years 2000 and 2010 respectively.
Contents
Foreword 2
Summary 4
Key findings on policy consistency
Key findings on implications of the congestion forecasts 5 Key findings on reliability of the forecasts 5
Conclusions 6
Section 1: Background 8
Introduction 8
Policy Overview 8
Policy development after publication of the White Paper 9
Section 2: Transport 2010: The 10-Year Plan 11
Overview 11
Outcomes and targets 12
Commentary on feasibility and consistency: traffic and congestion 13
Environmental impacts 14
Rail use 15
Bus use 16
Walking 17
Cycling 17
Summary
Section 3: Understanding the Forecasts: Traffic, Congestion
and Speed 18
Conclusion 23
Section 4: Assessing the Accuracy and Reliability of the Forecasts 24
Sensitivity of the traffic forecasts to various policies 25
Overall effect 30
Other methodological questions 30
Conclusions 31
Endnotes 33
Foreword
When the Government’s Transport White Paper was published in 1998 there was general support for its underlying aims of reducing our reliance on the car and the need to travel. Two years on, the Ten Year Transport Plan was hailed as a further step forward, providing the substantial investment needed to deliver the White Paper’s objectives. While there is much to welcome in the Ten Year Transport Plan, it is also clear that it represents a major shift in the policy focus. The emphasis now is on reducing the congestion on our roads, rather than the more general intrusion of traffic in town and country. The solutions favoured tend towards big, expensive schemes, such as new roads, trams and rail improvements, over smaller-scale local solutions. And while there is no doubt that some will benefit from these improvements, there are others who will not share in the gains, who will regret the resulting
environmental damage, and who will question the end result which is to encourage a nation to travel ever greater distances.
In view of these concerns, CPRE invited transport expert, Professor Phil Goodwin, to undertake an analysis of the Ten Year Transport Plan. We asked him to examine the policy framework of the Plan and its technical underpinnings. Our aim was to discover whether the approach set out in the Plan was consistent with the Transport White Paper, and when judged on these terms, whether the Plan is likely to deliver the outcomes
predicted, such as reducing congestion, CO2and traffic growth. Professor Goodwin’s findings are revealing and raise serious questions about the future direction of transport policy and investment decisions. His work shows that the Government’s approach to measuring congestion is likely to raise undue expectations in the travelling public of positive change ahead. When looked at closely, it appears that the forecast reductions in congestion are likely to be so small over any given period, as to be almost undetectable. The reality is that travelling by car is not likely to be any less frustrating in 2010, and on motorways and in rural areas it is likely to be worse. With this knowledge, we now need to question whether the £60 billion planned spending on roads, with serious potential environmental consequences, is the right direction for investment.
managing demand and small scale solutions, travel conditions could substantially improve in future, rather than barely maintaining current conditions as forecast. DETR has already said that it is undertaking further work on the model used in the Ten Year Transport Plan and that it will be reviewing the Plan overall in the coming year. CPRE believes that the issues identified here should be central to this work.
In our view, a revised Plan should give greater weight to the potential for managing the demand for travel and to delivering solutions which benefit everyone, whether they own a car or not. This will require a shift in investment towards smaller-scale solutions, aimed at making rural and urban neighbourhoods easier to get about in by foot and bike and with opportunities for using high quality using public transport. This does not mean that investment is not urgently needed in some major
infrastructure improvements, particularly in the rail network. This should not dominate, however, nor lead to a result where it is more comfortable to travel by train from London to Edinburgh, than it is to catch a local bus or walk to work.
We believe the benefits of such an approach will be clear: in delivering a protected and healthier environment, in offering everyone the chance to share in the gains from new transport investment, and in ensuring that the money spent delivers long term advances towards a more sustainable nation.
Lilli Matson
Head of Transport & Natural Resources
CPRE
Summary
Transport 2010, the Government’s Ten Year Transport Plan, gives the following picture of the year 2010:
motoring fuel costs will be 20% cheaper than in 2000;
a very substantial programme of both road and rail infrastructure expansion will have been completed;
there will be growth in traffic volumes everywhere, made of greater movement by virtually all means of transport – car, rail, bus,
walking, cycling, road freight, rail freight;
emissions of nitrogen oxides, particulates, and carbon dioxide will be lower;
congestion will also be lower – time lost overall will decrease by 6% (and by 15% in London).
This report examines these suggested outcomes, paying special attention to their consistency with the objectives of the 1998 White Paper A New Deal for Transport, and the implications and technical reliability of the DETR’s forecasts of traffic, congestion and emissions.
Key findings on policy consistency
the targets for rail passenger and rail freight growth are achievable in terms of market potential, though recent rail disruption may have longer lasting effects than hoped, and the feasibility of swift major improvements is still undemonstrated;
the targets for bus use are not yet internally consistent, and significantly underestimate the potential for growing use in towns and countryside;
walking and cycling are not yet accorded the same importance in forecasts, analysis and investment detail that they have won in policy intent;
reductions of pollution and carbon dioxide emissions are heavily dependent on the success of voluntary agreements with motor manufacturers on fuel efficiency – they will be partially offset by increases in traffic (encouraged by the reduction in cost brought about by the fuel efficiency improvements) and potentially by consumer trends to buy larger vehicle;
Key findings on implications of the
congestion forecasts
The important indicator described as ‘change in congestion’ used in the Plan is difficult to understand, and really only measures the forecast change in speed, saying nothing about other important aspects of congestion such as reliability or instability of traffic flow. However, it is possible to re-express the congestion forecasts in terms of the speed changes they imply:
overall: road travel times are forecast to reduce by less than one quarter of one second per mile each year, over the ten years adding up to about two seconds per mile;
interurban trunk roads: travel times are forecast to reduce by about one twelfth of a second per mile each year, giving a total of nearly one second per mile over the decade;
London: the forecast timesavings are just over one second per mile each year, giving nearly 12 seconds per mile in the decade;
big cities: timesavings of about one third of a second per mile each year, adding up to just over 3 seconds per mile in the decade;
motorways, small towns and rural areaswould have the opposite experience, with deteriorating speeds and increases in journey time over the decade as a whole – though only by up to a second or two per mile;
if these targets are fully achieved, a motorist who travelled the same 10,000 miles a year in 2000 and 2010 would save nearly a minute a day, though in practice much of this saving would actually be spent on slightly longer average journey distances. A journey by road from Oxford to London would take a few seconds longer, and from Sheffield to Manchester a few seconds less;
for allclasses of roads, the traveller’s experience of improvement or deterioration in average speeds from any one year to the next will be invisibly small compared with the normal unpredictable variations in the conditions of daily travel.
Key findings on reliability of the forecasts
The sensitivity of traffic to changes in travel cost is probably underestimated, and this gets more serious over time so that the 2010 forecasts may be significantly affected.
The same may be true (though, pending further tests, this is not yet so clear) for the sensitivity of traffic to changes in journey times, especially in the most congested conditions which are averaged out of the figures above.
There is an overoptimistic estimate of the effect of transfer away from car as a result of public transport improvements (unless accompanied by stricter traffic reduction measures). However, the consequent effect on public transport, by contrast, is
underestimated.
Not enough allowance is made for the localised effects of increased
traffic resulting from improved infrastructure.
Conversely, not enough allowance is given to the potential for
reducedtraffic due to demand management measures.
Conclusions
Methodology and Objectives
Congestion is only one of many important considerations, and success in any sustainable transport policy will depend on determined and
continued focus on the wider issues of car dependence, land-use,
education and understanding, for which clear signals are necessary. That said, the report agrees with the Government in according prominence to the reduction of congestion among the objectives of transport policy. However, the report argues that it is in the interest of the policy concerns of the Government, and clarity of understanding of transport users, to devise a different measure of congestion as rapidly as is feasible to do so. The current measure is difficult to interpret, revealing nothing about important aspects of congestion (such as queue length, unpredictable conditions, gridlock, day-to-day variability, instability) other than the average of all speeds on the average of all days. It is exceedingly difficult to monitor, likely to lead to unrealistic public expectations in advance, unlikely to correspond with public experience when success is reported, has some perverse policy implications (such as implying that congestion is always reduced by reductions in speed limits, even if they are
ineffective), and is not suitable as a cornerstone indicator of the
transport strategy. Its continued use can only lead to embarrassment and confusion.
Policy
logically result in some rebalancing of the policy package.
The work carried out for this report does not specify exactly how the package should be improved, but the direction implied would give rather more emphasis to: demand management; intervention in traffic volumes to prevent the erosion of both road and public transport benefits due to induced traffic; greater attention to the interaction with walking; rapid and urgent consideration to the actual scheduling of rail improvements; a re-examination of both the induced and suppressed traffic effects of changes in road capacity; and a renewed caution about unintended effects which come between intention and outcome. One of the
components of the Plan which has received most public attention is the suggested expansion of the road programme: this would be particularly vulnerable to the effects of induced traffic in the most congested locations, and to revised sensitivity of traffic to price changes. A rebalancing along these lines could actually provide a more
Section 1: Background
Introduction
This report gives an assessment of the background and technical
underpinning of the Government’s Ten Year Transport Plan, carried out for CPRE, and with the helpful advice of officials of the DETR. The objectives are to:
examine the policy framework, especially the consistency of the Ten Year Transport Plan and the 1998 Transport White Paper;
assess the technical adequacy of the modelling developed for the Plan, with reference to the policies tested;
assess the likelihood of intended outcomes on congestion, behaviour and emissions being realised.
Policy overview
The 1998 White Paper A New Deal for Transport: Better for Everyoneis a lengthy document with some treatment (at more or less detail) of nearly all significant questions of transport policy. As always in such documents, it is possible to find sentences which are not absolutely consistent with each other, and which give the possibility of interpretations which differ somewhat in emphasis.
Therefore it is useful to start with a re-statement of the central line of argument of the White Paper. This was unambiguous, firm, recognised the unsustainability of previous trends, and was based on an explicit rejection of the ‘predict-and-provide’ assumption that construction of additional road capacity should – or indeed could – keep pace with unrestrained traffic growth. This recognition created the basis for a new form of professional and popular consensus, involving radical change. The key features of this change were:
a co-ordinated approach to public transport, walking and cycling, which would be called upon to perform a newly important role in providing mobility, and therefore had to be substantially improved in quality and attractiveness, and would need to be treated as the major, central transport priorities, rather than as the Cinderellas of policy at local and national level;
policies aimed at reducing less-necessary travel wherever possible, by a combination of land-use planning, technological innovation, incentives and education;
ensuring that the price of travel was – as far as practically possible – aligned with the real (though sometimes indirect) costs of
charges on road use and parking, and existing powers, this being at the discretion of local authorities and with provision that
hypothecation of the resulting revenues would be used for transport improvements by those authorities;
an emphasis on better maintenance and management of the road network, with a predisposition against new road construction wherever alternative policies or measures could be found; consideration of the effects on transport of other policies, for example in land-use, health, education or employment, which were the responsibility of other Ministries or local government
departments with other objectives than transport.
This approach, though spelled out completely for the first time in the White Paper, nevertheless had been at the heart of policy re-thinking by previous (Conservative) administrations, and many professional and representative bodies, in a process which was most rapidly accelerated between the launch of the 1989 road programme Roads for Prosperity, and the publication of two influential reports in 1994: the Royal Commission on Environmental Pollution’s Transport and the Environmentand
SACTRA’s Trunk Roads and the Generation of Traffic. These provided a research underpinning to the new thinking, to the extent that even if there had not been a change in political power in 1997, movements of transport policy in the same direction were clearly indicated.
Policy development after publication of the
White Paper
Following publication of the Transport White Paper, there were a number of important ‘daughter documents’, revised guidelines, and detailed plans for specific modes or sectors, which spelled out specific policies in more detail. Some of these are considered further below. At the same time, there was preparation for primary legislation to give effect to those aspects needing this, of which the most important was probably legislation to give enabling powers to local authorities to implement road user charges, or workplace parking charges, with provision for
hypothecation of the revenues under their control, for transport improvements. The Parliamentary timetable resulted in a longer-than-expected delay in this, during which the glow of support for the
principles was overlaid by irritation and impatience about delivery. Some important organisations shifted their position to some extent, in response to events such as fuel taxation protests, railway accidents and disruption, and the evolution of road pricing discussions in London.
During this period, it became apparent that the Government was concerned that its transport policies should not be interpreted, or misinterpreted, as ‘anti-car’, and the opportunity was taken of various speeches and statements to present policies in a way which would be seen positively by users of both private and commercial vehicles.
Pollution(January 2000), the Government’s first report under the Road Traffic Reduction (National Targets) Act 1998. The Act had required local authorities to make plans for traffic reduction, and the Government to report on whether it wanted such targets at national level or not. The Government decided that it was nothelpful to define a specific target for national traffic reduction, but would instead focus on the negative effects
of traffic growth, namely congestion and pollution. The Commission for Integrated Transport, CfIT, supported the emphasis on effects, but with two important reservations: they argued that the growth in traffic levels should still have a direct importance in policy, in two ways.
First, CfIT proposed a rather different type of traffic target, namely ‘trajectories’ of traffic growth or decline, different for each type of area, which would be used as benchmarks for success. Secondly, CfIT proposed that with the aid of such benchmarks, it would be reasonable to aim for significant reductions in the volume of traffic levels, in some types of area (particularly big cities) and a future levelling off, resulting in zero growth of traffic at a national level. These recommendations have not yet been taken on board as Government policy, though discussions continue. The Tackling Congestion and Pollutionreport used an early, provisional, version of a new forecasting method developed by the DETR and its consultants, which explored the rate of traffic growth under different policy assumptions, and the resulting levels of congestion and pollution, of which more later.
Section 2:
Transport 2010: The
Ten Year Plan
Overview
The Ten Year Transport Plan, published in July 2000, continued the same approach, albeit with a somewhat modified set of models and
assumptions. The general language and qualitative comments in the Plan broadly follow the approach and principles of the 1998 White Paper. However, the focus of attention is rather different, because the sections in which most details, specific forecasts, expenditure figures etc are given are mainly about infrastructure investment. The press notices, speeches and press briefings – and the media attention which followed –
concentrated on the investment programmes proposed for road and rail, with a combination of national, local and private funding, and their effects on congestion and pollution.
Headlines about the road proposals were particularly prominent, along the lines of ‘100 new bypasses’, ‘360 miles of motorway widening’, ‘80 trunk road and 130 local schemes’ etc. A subsequent announcement concerning possible ‘fast track’ schemes was reported (Local Transport Today7.12.2000) under the headline ‘Critics attack dusting down of road schemes as shift from sustainable transport agenda’. It is fair to say that the perception of a shift in Government policy has been fairly widespread both by commentators who would support, or reject, such a shift.
It is also fair to say that Ministers have rebutted this interpretation, arguing that there has been no shift in underlying principles. It is true that proposed public expenditure on roads for the decade is greater than was actually delivered during the 1980s and 1990s. But 25 new light rail lines were also suggested, and major investment in much of the rail network. Over the ten years, the proposed expenditure is almost exactly equal, in total, for road and rail (£59.1b and £60.4b respectively – and virtually the same figure again, £60.2b, on other transport expenditure). The identity may be a bit misleading, as a substantially higher proportion of the rail investment is expected from private funds, than is proposed for roads, with implications which are considered below.
Outcomes and targets
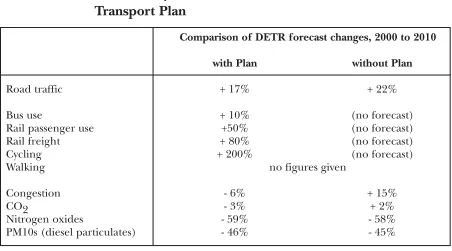
Table 1: Key indicators of effects of the Ten Year
Transport Plan
Table 2: DETR traffic and congestion forecasts, 2000 to
2010, with Plan
1
Commentary on feasibility and consistency:
traffic and congestion
Overall, tables 1 and 2 indicate that the DETR expects congestion to reduce in London, other cities, and interurban trunk roads, but to
increasein other towns, motorways and rural roads, even with the Plan. Thus compared with 2000:
overall, traffic will increase by 17%, and the time lost in congestion will actually fall by 6%;
Comparison of DETR forecast changes, 2000 to 2010 with Plan without Plan
Road traffic + 17% + 22%
Bus use + 10% (no forecast)
Rail passenger use +50% (no forecast) Rail freight + 80% (no forecast)
Cycling + 200% (no forecast)
Walking no figures given
Congestion - 6% + 15%
CO2 - 3% + 2%
Nitrogen oxides - 59% - 58%
PM10s (diesel particulates) - 46% - 45%
All roads in area Road type
Total London Conurb Other Rural Motor- Inter Rural and urban ways urban B and large Trunk Minor urban
Forecast change
in traffic + 17% + 5% + 10% + 17% + 21% + 29% + 26% + 12% Forecast
change in
[image:14.595.93.545.380.571.2]for London, there will be a 5% increase in traffic but a 15% reduction in congestion,
for interurban trunk roads, a 26% increase in traffic but a 5% reduction in congestion.
When these figures are compared with the forecasts of what would happen, by 2010, without the planned investment programme etc, the scale of the achievement seems even greater. The DETR analysis suggests that from 2000 to 2010, if the measures in the plan are not implemented, traffic will grow by 22%, and the time lost in congestion will grow by 15%, most of the increase in congestion being on rural roads and interurban trunk roads. Thus implementation of the Plan is expected to reduce the overall 2010 congestion level to 18% less than it would otherwise be (94 compared with 122). The biggest congestion benefits would be in London (-15% instead of +13%) and on interurban trunk roads (-5% instead of +28%) – ie in both cases, time losses due to
congestion in 2010 would be 25% less as a result of the Plan, than would otherwise occur in that year.
To achieve sizeable reductions in congestion at the same time as substantial increases in traffic requires explanation. It should be remembered that one of the important traffic reasons for the cautious approach that the 1998 White Paper took to road construction was not an objection in principle, but that experience and technical work had suggested that increases in highway capacity tended to produce less ‘relief’ from congestion in practice, than had been hoped.
So the headline achievement of the plan – to reduce congestion by 6% overall at the same time as a 17% increase in traffic – would be very impressive, but deserves closer examination, and this is done in sections 3 and 4 below.
Environmental impacts
Assessments of the local environmental impacts on land-take, sites of special importance, ecological systems, noise, community severance and aesthetic considerations rely on detailed study of specific locations, and these have yet to be carried out. It must be considered certain that such problems will be matters of concern in discussion of many of the
proposed road schemes, with outcomes which will depend on a combination of scientific work which has not yet been done, and the prevailing public mood which can only be assessed in specific contexts. There is less recent experience of environmental problems of rail expansion schemes, but what there is suggests that these, too, will be controversial in some cases.
Forecast changes in carbon dioxide emissions are, by contrast, small in the period, but slightly more sensitive to the Plan. There is expected to be a substantial reduction in the CO2output per vehicle kilometre due to the EU ‘voluntary agreement’ with motoring manufacturers. This is expected to increase fuel efficiency, and therefore reduce fuel
consumption per kilometre. The scale of this is such as to produce a 20% reduction in the fuel expenditure per kilometre, which in turn would generate some additional traffic, on top of a continued traffic growth generally. Taken together, the expected reduction in fuel consumption is expected to be mostly, but not entirely, offset by increased traffic, hence the small net change. Other factors, not included in this calculation, are recent suggestions by the Government for a strong use of MOT vehicle tests to police and enforce emissions limits, and changes to market preferences for vehicle size resulting from changes in costs, taxes, and other factors.
Also, among the unknown but possibly counter-productive effects, is the possibility that consumers may use the reduced fuel cost to trade-up their vehicle size – buying more 4-wheel drive vehicles, for example. This would slow, or conceivably even reverse, the modest carbon dioxide reduction.
Rail use
The figures seem consistent with the intentions of the Transport White Paper, and with the proposed improvement in service. Rail freight growth, it should be noticed, is from a very small base, and has already shown rapid recent growth rates. Those in the industry expect to be able to grow significantly more than this, given a favourable context, for example a more generous (or, as they argue, realistic) acknowledgement of the congestion effects of transferring freight from road to rail for specific road types and contexts. On the other hand, any changes which made road freight more attractive or cheaper to its users – extension of weight limits to allow 44 tonne lorries, fuel tax concessions, etc - must have a negative effect on rail freight.
The four main problems are
It does not need to be spelled out that the current difficulties of the rail industry are having a devastating effect on patronage – hopefully with only short term results, but conceivably lasting – and on confidence in the ability of rail to deliver the promised
improvements in time to contribute to the Plan as proposed. This is now a matter of common understanding in the transport policy debate, and does not depend on any complicated reassessment of the figures. If service levels are swiftly restored, and also materially and rapidly improved, it may be that the market will be forgiving. But there is already discussion of possible structural effects on, for example, property prices in the London commuter region, and it cannot be taken for granted that the scale of the problem will leave no long-lasting scars.
required private funds actually materialising (or, materialising but only at a greater cost of capital), because of changes in investors’ perception of the risk involved in railway investment.
The experience of checking and replacing track following Hatfield has shown the enormous logistic and scheduling difficulties of carrying out major works at the same time as maintenance of efficient operations, on parts of a rail network operating near capacity. It seems at least possible that provision would need to be made for deliberate ‘off-loading’ of some passengers or freight from parts of the network undergoing the largest works – with implications for traffic and market development which until now have not been confronted. (There is no provision at all for
‘disruption due to works’ in any of the forecasting procedures that have been used for the Ten Year Transport Plan).
Questions of structure, organisation, management, regulation and ownership – including reconsideration of the basic privatisation model – are proving to be important issues in ensuring delivery. These are outside the scope of this note, but an important issue for further work.
Bus use
At present, the discussion of bus use in the Plan is inadequate and
inconsistent. For London, it is suggested that there will be a 50% increase in the number of bus passengers entering central London and across the network as a whole. This seems achievable, given success in the proposed 10% reduction in bus journey times, many other improvements to reliability and service levels, in the context of road pricing (or similarly intense alternatives to it), and the delay before feasible London rail improvements could take many passengers away from bus. But it is suggested that the national growth of bus use, including London, will be only 10%. Taking these two figures at face value would imply a reduction
in bus use outside London. It is not possible to infer directly from the figures what pattern of bus use change is implied outside London, since one would expect other big cities, at least, to show increases: this in turn would imply even greater decreases in small towns and rural areas, perhaps of devastating scale.
Such a picture of decline of bus use outside London and the big cities would fit in with historic trends, and with withdrawal of bus services in rural areas. So a possible inference would be that the Plan does indeed presume (though not say explicitly) a reduction in bus use outside major conurbations.
However, although this is implied by taking the figures at face value, it
cannotbe the underlying expectation in the Plan. Evidence for this interpretation is as follows:
very substantial improvements are listed in the Plan for bus services
all the qualitative language is of improvement and growth; the Plan encourages bus quality partnerships which produce
‘passenger growth of typically 10%-20% on partnership routes’, this figure being based on quite short-term experiences, and hence would be expected to be even greater over the decade as a whole; there are indirect hints in some sensitivity tests, discussed in section 4 below, that very large increases in bus use would follow from changes in some policy assumptions.
So at present, there seem to be two quite different signals about the future of bus use. The most likely explanation for this is that the discrepancy is not the result of the model forecasts themselves, but a ‘cautious’ judgement, based on advice from bus operators, manually inserted into the forecasts, without deliberate intention to imply a
reduction in bus use, and without cross-checking for consistency with the London figure.
Other discussion (eg IPPR, forthcoming) envisages growth in bus use being feasible – and essential for the Transport White Paper’s objectives – of much greater figures than a national 10% over a decade. (The
author’s suggestion has been in the order of 5% a year, at national level, sustained for 30 years, with substantially higher and faster figures for urban areas). It must be said that although the policyobjectives stated for buses in the Plan are ambitious and consistent with the Transport White Paper, the figures and analysis attached to these do not come anywhere near to reflecting their importance.
Walking
One of the most important policy developments in recent years is to recognise the importance of walking as a method of transport in its own right – providing for a very large proportion of the total number of journeys (figures of 10% to 30% are not uncommon), and interacting especially with the short car trips which are growing most rapidly. The Ten Year Transport Plan has not sought to make significance advance in spelling out details of walking policy, or putting figures to its effects, or treating the investment, design and maintenance programme which provide for it in a comparable way to the heavy engineering of infrastructure for vehicles. Until walking is included, as a mode of transport in its own right, in traffic and transport forecasts, they will continue to be prone to partiality and unreliability in all discussion of short journeys (and, therefore, in changes to destination choice and average trip length affecting longer journeys also).
Cycling
Summary
The targets for rail passenger and rail freight growth are achievable in terms of market potential, though recent rail disruption may have longer lasting effects than hoped, and the feasibility of swift major improvements is still undemonstrated;
the targets for bus use are not yet internally consistent, and significantly underestimate the potential for growing use in towns and countryside;
walking and cycling are not yet accorded the same importance in forecasts, analysis and investment detail that they have won in policy intent;
Section 3: Understanding the
Forecasts: Traffic, Congestion,
and Speed
We now return to the central – and at first sight puzzling – feature of the Ten Year Transport Plan, namely that it forecasts increases in traffic on all roads, at the same time as reductions in congestion on some of them. Before judging whether these forecasts are reliable (in section 4), it is necessary to understand what they actually mean, so in this section we take all the figures at face value – with no challenge at all to their validity – and make calculations to convert them into more easily understandable quantities.
It emerges that the crucial quantity is the calculation of ‘congestion’ – which everybody experiences, and therefore intuitively understands, but is defined for the forecasts in a specific, and problematic, way.
The quantity used by the Government as the focus for the Ten Year Plan is called the ‘percentage change in time lost due to congestion’, which relies on comparing an average ‘actual’ speed with the average ‘free’ speed2, ie, if all vehicles were able to travel at whatever (legal) speed they liked, given the basic nature of the road network.
This is calculated as follows:
first: calculate the average free-flow speed of traffic in the current year, 2000, ie, if all existing vehicles, with their current distribution among road types, could travel without any delay caused by
interaction among vehicles;
second: calculate the real average speed in 2000, given the volume of traffic that actually exists;
third: calculate the difference in average journey time per kilometre between these two. This is the amount of congestion now;
fourth: recalculate the same quantities for a future year, say 2010, given the traffic forecasts from the model. This gives the amount of congestion in 2010;
1. free flow speed would be 109 k/hr, so it would take 33 seconds to travel 1 km3;
2. Actual speed, due to congestion, is 60 k/hr, so it takes 60 seconds to travel 1 km.
3. So ‘lost time due to congestion’ is 60 - 33 = 27 seconds.
4. As a result of actions in the Plan, estimated actual speed will go up from 60k/hr to 90 k/hr, so actual journey time will be 40 seconds to drive one km, and lost time due to congestion will be 40 - 33 = 7 seconds.
5. So the Plan will reduce congestion by 74% (ie from 27 seconds lost time per km, to 7 seconds).
In these calculations, the change in congestion, or the change in speed, or the change in journey time per kilometre, carry exactly the same information – each derives arithmetically from the other. So this measure of congestion does not say anything about other aspects of congestion as normally experienced (eg length of queues, or time spent not moving, or frequency of gridlock, or day-to-day unpredictability). But even though congestion, speed and time are all variants of the same quantity, the numbers describing them are always different for arithmetical reasons. In the above example, there are three ways we could describe the same result:
congestionreduces from 27 seconds to 7 seconds, ie 74%, or
speedincreases from 60k/hr to 90k/hr, ie 50%, or,
travel timereduces from 60 seconds to 40 seconds, ie 33%. Thus 33% reduction in travel time, 50% increase in speed, 74% reduction in congestion are different, more-or-less helpful, ways of expressing the same change.
Now the Plan report itself only ever quotes the percentage change in congestion: not the actual level of congestion, not the speed, and not the journey time. However, all these other quantities – speeds, journey times etc – are actually stored by the model as part of the process of calculating the congestion as defined, and DETR officials have kindly provided these figures.
Table 3: Changes in road speeds and journey times, 2000
to 2010, as a result of the Ten Year Plan, underlying the
forecast congestion changes
So the average forecast change in speed is slightly less than half a kilometre per hour (about a quarter of a mile per hour), giving a time saving, at average speeds, of 1.6 seconds per kilometre travelled.
As noted above, the Plan’s ‘percentage change in congestion’ cannot be interpreted directly as a percentage change in journey time. Table 4 shows the two different ways of expressing the same changes.
Table 4: Changes in forecast road congestion and travel
times 2000 to 2010, assuming complete implementation
of the Ten Year Transport Plan
All roads in area Road type
Total London Conurb Other Rural Motor- Inter Rural & urban ways urban B and large Trunk Minor urban
Average speed,
2000 k/hr 55.2 28.9 38.8 44.6 77.6 90.4 80.6 64.0 Average speed,
2010 k/hr 55.6 30.7 39.7 43.9 77.1 89.2 81.6 63.7 Change in
speed k/hr + 0.4 + 1.8 + 1.1 - 0.7 - 0.5 - 1.2 + 1.0 -0.3
Change in
time per km - 1.6 - 7.3 - 2.0 + 1.2 + 0.3 + 0.5 - 0.5 + 0.2
seconds seconds seconds seconds seconds seconds seconds seconds
Change in ‘congestion’ as Expressed as change in forecast in 10-year plan travel time per journey
London - 15% - 6%
Conurbation and large urban - 8% - 2 %
Other urban + 7% + 1%
Rural + 16% + 1%
Motorways + 13% + 1%
Interurban Trunk - 5% - 1%
Rural B and Minor + 20% + 0.4%
[image:22.595.95.543.583.763.2]This calculation rather shifts the question which should be asked about the forecast changes. The forecast changes in congestion were not huge, but they did seem to be appreciable – ‘6%’ and ‘15%’ reduction in congestion sounds worth having, and ‘congestion 25% less than it would be otherwise’ even more so, even if one is not quite sure what it really means.
But the underlying changes in travel times turn out to be extremely small – invisibly so for some classes of road. Even in London, where the biggest reductions in congestion are forecast, a reduction in average journey time of about 1 minute for a 6 mile journey, though clearly worthwhile, is not quite what ‘15% reduction in congestion’ might lead one to expect. Now it is true that there are often reasons why travel time changes can still be important even if small. Two quite different reasons may be suggested in this case:
(i) all the available reporting produced by the DETR gives an average of peak and off-peak conditions, as is therefore followed for the above analysis. However, the calculations are actually done separately for peak and off-peak, and we may assume with confidence that the peak periods must show larger than average time savings. Conversely, off-peak time changes would be smaller than average, or change in the opposite direction. This is
important, because if the peak time changes are larger, then so will the amount of extra traffic which results;
(ii) small time savings often follow from transport projects, and it is normally assumed (correctly, in my view, though I accept that this is controversial) that these may be aggregated together to give a useful result, at least in the longer run.
The tentative conclusion at this stage is notthat reducing congestion is unimportant, but that this measure, though called ‘congestion’, may not give useful signals about the success in doing so. By focusing on the wrong measure, it may lead to policies or schemes which are not the best which could be devised.
This conclusion is reinforced by four further problems – some of which are quite difficult to solve – which arise when using such a measure. 1. This definition of congestion, discussed in the literature for many
circumstances it is almost impossible to explain the behaviour of this measure of congestion, in language accessible to informed public comment.
2. There is a peculiarly embarrassing problem, when using this sort of measure, of how to handle changes in the speed limit. For
example, suppose there is a substantial increase in the number of urban areas implementing 20mph home zones. If these are effective, they will certainly result in a reduction in speed which, unless the ‘free flow’ speed base is changed, will be interpreted as an increase in congestion, which is intuitively wrong. Therefore it would be normal to exclude speeds travelled at over the speed limit in calculating changes in this measure of congestion. So the ‘free flow’ speed from which time losses are calculated would be
lowered, by definition, as a result of these schemes. But then there will be a reduction in measured congestion notmainly arising from any change in actual speeds, but solely from the redefinition of target speed – which is tantamount to saying that ‘congestion is now less because you should not be travelling that fast anyway’. This is also intuitively wrong4. There is an even more extreme example: imagine a policy which reduced the speed limit without enforcement, engineering back up or any effect whatsoever. This would by definition reduce congestion as calculated – probably by a greater proportion than could be achieved by any real world change. It is difficult to imagine public opinion accepting such advice.
3. Estimated percentage changes in this measure of congestion cannot ever be observed directly: they can onlybe seen as the output of a model. But the actual process of monitoring mustrely on actual observable quantities that have been delivered, ie speeds or travel times. So these would be measured by surveys, and then converted, in the model, into changes in congestion to be compared with the Plan. But the model used for calculations will quite certainly change, possibly many times, between 2000 and 2010 – indeed it is unlikely that the version of the model used for the Ten Year Transport Plan itself will ever be used again, except for comparative purposes. So annual statements about the change in congestion achieved since the previous year are likely to derive more from changes in the model than from changes on the roads. It is difficult to imagine that this would usefully inform public understanding.
4. In any case, it is not quite so straightforward even to measure the real speed and time changes in a way which compares with the forecast ones. This is because the forecasts are all based on a change in averagespeed conditions for two dates ten years apart, while monitoring will be done on a year by year basis: a 10 second travel time change in ten years has to be converted into an
order of 20%: this means that a journey of an average 20 minutes duration might vary, on 95% of days, between 12 minutes and 32 minutes (and on the other 5% of days even more so). The greater the congestion, the greater this day-to-day variability. So the task of saying with confidence that the average journey time has gone down by say ten seconds, over a ten year period canbe done, but it is very data-hungry and it is veryunlikely to resonate with the personal experiences of travellers, few of whom make enough journeys to detect an improvement of a second per year in the average duration of their journey – and none could conceivably notice one tenth of a second per year. Therefore public experience of congestion will depend on other quantities – reinforced by media treatment using ‘monitoring’ techniques, based on
anecdote, surveys of road users and the like, which are certain not to involve the level of scrupulous care and enormous budgets necessary for calculating true average journey times, correct to one tenth of a second, separately for each of the classes of road type, area type and time of day used in the model.
An indication of this problem is given in a study published by the DETR in 1999. This showed measuredchanges in traffic speed on trunk roads in the three years from 1995 to 1998. Average change in speeds was nearly 6 miles per hour for the a.m. peak, 4.5 miles per hour for the evening peak, and 1.5 miles per hour off-peak – ie a measured rate of change around ten times greater than the forecasts for 2000-2010 expect. A research programme involved driving test cars on 3500 links for 100 days: for any particular category of road it was only when the observed change was greater than about 1 mile per hour that statistically significant answers were obtained.
Conclusion
Section 4: Assessing the
Accuracy and Reliability of the
Forecasts
All the discussion above has been based on taking the forecasts at face value, and investigating their implications. The more important question is whether they are likely to be right.
The DETR has been open and explicit in recognising caveats about the reliability of the modelling. Some of these caveats are carried forward from the CfIT ‘Targets’ exercise, when a previous version of the model was found to have some weaknesses in inadequate treatment of
sensitivities to qualitative and some quantitative policy initiatives, and omissions. Some further work was done on these for the Ten Year Transport Plan, but it was not the DETR’s view that they had been (or, perhaps, could be) completely solved in the time, or with this method5. The central issue is whether the forecasts give an unbiased assessment of the sensitivity of traffic, congestion etc to changesin the speeds, costs, regulation and conditions of travel that are subject to policy influence. This is much more important than calculation of the ‘base’ case from which the effects of the changes are calculated, since the sensitivities it embodies to changes in costs or speeds, brought about by different policies, will determine which policies are judged more or less effective. A powerful test of a model is therefore to compare the sensitivities it uses with other evidence, or a priori expectations. At first sight, the
[image:26.595.108.542.550.772.2]sensitivities in the model seem to be rather low, as shown in Table 5.
Table 5: Sensitivity of the traffic forecasts to various
policies
Traffic growth Forecast difference in 2000-2010 2010 traffic, compared
with Plan
Without Plan + 22%
With Plan + 17%
Taking these in turn, there are a number of features, some counter-intuitive, which need to be addressed.
Sensitivity of the traffic forecasts to various
policies
a) Unexplained traffic reduction in context of more road
capacity and lower car costs
Application of the Plan is forecast to reduce traffic growth from +22% to +17%, ie if we discount all other effects and look at 2010 alone, the Plan reduces its estimated traffic level from 122 to 117, or just over 4%. The question here is what mechanism can have produced such a reduction? Some road pricing is included in the Plan’s assumptions, and some traffic-reducing changes in parking charges, and free parking. But these mainly apply to city centres, and to a relatively small proportion of the total number of journeys: they would not explain why traffic is forecast less with the Plan, than without, even for motorways, interurban trunk roads and rural roads – especially when some of these are provided, as part of the Plan, with a number of widening schemes, bypasses etc. Such extra capacity would normally be expected to induce more traffic, not less.
We know that the model forecasts do make some allowance for induced traffic due to extra capacity: additional figures supplied by DETR forecast additional total traffic in 2010 of 0.34% due to the extra road capacity in the Plan (over and above the ‘targeted programme of improvements’ which had already been scheduled). Just looking at interurban trunk roads, there is an induced traffic of 0.7%. At the average level for the interurban network as a whole this does not seem out of line with an achieved travel time change (after allowing for the induced traffic itself) of 1.2%. The picture here may be summarised as: road building is very expensive, so there is not much extra capacity really added, so there is not much travel time change, so there is not much induced traffic. The problem arises because these are average figures for the whole network: in practice, this small amount of induced traffic would largely appear on or close to the new capacity itself, and therefore have a disproportionately larger effect6. Nothing can be said about this crucial
localised impact using the aggregate forecasting methods of the Plan – the key, as yet unresolved, issue is still to come, when the individual schemes are assessed with reference to local conditions. Then, induced traffic must logically become more important. (A similar argument applies to journeys which, as a result of new capacity, shifted towards the peak period – not strictly induced traffic, but with a similar effect of reducing any time savings resulting from the added capacity).
traffic is due to the calculation of people attracted from road to public transport – a calculation which is made partly in the model, and partly by external judgement and assumption. The problem therefore is rather different. General practical experience on this is that improvements to public transport can, if well done, certainly attract car users, but this is
notautomatically followed by a proportionate reduction in traffic unless restrictive measures are put into effect, because the transferring car users are replaced by others. This is turn has even bigger implications for the public transport figures, as discussed in the next section.
(b) Implications for bus use with constant motoring costs and
greater bus improvements
The published ‘constant motoring costs’ calculation estimates what would happen if, in effect, some other motoring costs were increased enough to offset the fuel cost reductions due to efficiency, and in that case this assumption is accompanied by unspecified (but appreciable) expenditure on improving the attractiveness of bus services. Forecast traffic would then be 3.4% less than the Plan. We can put this together with a separate calculation, carried out by the DETR at the request of CfIT, which
estimated what would happen if there was a 20% real reduction in fuel price, but without the accompanying bus changes. This showed a 1.7% increase in traffic, which to a first order of magnitude we may assume is the same percentage change as that caused by reversing this cost change. Thus half the reduction in traffic in the ‘constant costs’ scenario is due to the price increase and half to the bus improvements.
With this information, we can look at the implications for bus use of the policies embodied in the ‘constant costs’ scenario. Bus use would be boosted by four separate effects:
(i) the 10% already calculated/assumed for the Plan;
(ii) some proportion of the car users put off by the higher fuel price; (iii) all the car users attracted to bus by the extra bus improvements
(this amounts to 1.5%-2% of road traffic levels);
(iv) a further growth in bus use, not from car users, attracted by the same improvements.
These figures are not explicit in the Plan (and not included in the model), but as a rule of thumb based on experience, when we see extra bus users resulting from bus improvements, it is rare that more than about a quarter of them have switched from car – ie for every one switcher from car we would expect three or more additional passengers from other sources. If we apply this ratio, then we can roughly estimate the implied increase in bus demand overall in this scenario.
and 5%-15% from the increase in car costs.
Even on the most conservative assumptions, this adds up to more than a doubling of bus use over the decade, which is so far outside previous discussion that it must either call the calculations into question – or, if the figures are at all credible, merit detailed investigation as an
interesting policy option in its own right. In either case, it reinforces the argument for looking again at the scope for substantially larger increases in bus use than have been considered so far.
Meanwhile, on balance, it seems likely that the model implies a higher cross elasticity between bus and car, and a lower tendency for induced traffic to take up the slack left by some car users transferring to public transport, than would be warranted.
(c) Sensitivity of traffic to motoring cost changes
The application of ‘wider’ local charging is forecast to have no detectable effect on the national traffic level, as is interurban charging – each having a modest effect on its own road class, but not enough to influence the national figure substantially. When these small effects are added together we have a picture where a 20% increase in fuel costs, and widespread local and trunk charging, produces only a 4% reduction in traffic levels compared with the Plan. On the face of it, this indicates a possible underestimate of the sensitivity of traffic to cost changes. This may be checked against the results of the test on fuel price
reduction, which may be interpreted as a ‘pure’ elasticity since everything else is held constant: 20% price reduction for a 1.3%7demand increase
gives a fuel price elasticity of -0.065. This is much lower than given by most current research, and is lower than the intended elasticity for the model, which is given in the DETR technical report as -0.23.
Taking long run values only, table 6 shows an important discrepancy.
Table 6: Comparison of elasticity of traffic levels with
respect to fuel price
The Goodwin and Glaister results are derived from reviews of published literature, UK and overseas, spanning some 30 years of research findings (which of course themselves show a wide range of results). The DETR ‘intended’ figure is briefly reported in Annex C of the Technical Report, as the results of an internal investigation leading them to revise earlier,
Source Long term elasticity of traffic volume with respect to fuel price
Goodwin (1992) - 0.3
Glaister (2000) - 0.3
lower assumptions: this is the figure they wanted the model to show. But when used, the model ‘output’ figure is different from the ‘intended’ figure because of complex interactions within the model, which have a damping effect8.
DETR officials explain that the mechanism which produces such a low ‘output’ demand elasticity is mainly related to the mathematical form of the demand relationship used, interacting with a long-standing
assumption in DETR practice that the ‘value of time’ increases over time in proportion to income. As a result, by 2010 people are assumed to be sufficiently rich that their behaviour is only influenced much by
consideration of time, the money becoming very much less significant to their choices. This is apparent in the fuel price calculations, and must influence (though is less apparent) all assessment of other money changes, such as fuel efficiency, road pricing, parking charges and fares. If this is true, it means that by 2010 any price differences will have little noticeable effect. It must be emphasised that this feature of the model is an assumption, not a forecast, with little direct evidence either for or against, though it in turn then has a great effect on all other forecasts. However there are two sorts of indirect evidence which tend to cast doubt on the assumption:
(a) if such a strong trend – sufficient to cut the elasticity value by over 70% – is going to happen over the next ten years, it should already have been very visible for the last thirty, during which incomes have increased substantially. But during that period there has been no observed tendency at all for research projects to find lower and lower price elasticities, either for car use or public transport use; (b) two major research projects commissioned by the DETR, by five
institutions expert in the field (MVA, ITS and TSU 1987, Hague Consulting Group and Accent 1999) have both advised that the value of time does not grow proportionally to income, but significantly less so.
The overall conclusion of this is that, at present, the model forecasts certainly show a substantially lower sensitivity of traffic to price changes than is suggested by the research literature in general, and possibly lower than was actually intended by the DETR.
This appears to be a fundamentally important result in assessing the forecasts overall. If the long term price elasticity is too low – possibly by a factor of 4 or 5 – then all calculations of the impact of price changes will underestimate the growth of traffic due to price reductions, and
underestimate the reduction in traffic due to price increases – ie future traffic levels would be higher than forecast for the low price scenarios, and lower than forecast for the higher price scenarios. Correcting for this, the ‘baseline’ and ‘Plan’ traffic growth would be higher, but the potential for reducing traffic, and its negative effects, by price, would also be greater.
is therefore a logical possibility that the underestimate of sensitivity to price is carried through to a comparable undersensitivity to changes in speed. This cannot be asserted with confidence in advance of doing similar tests as was carried out for price, since the ‘output elasticity’, following model interactions with the speed-flow relationships, and possibly damping, cannot be discerned purely by logic, and indeed it is even possible that the opposite applies. If it is the case that the sensitivity to changes in speeds, brought about by the planned investment or by traffic growth itself, is underestimated for this reason, there are
important consequences for the reliability of the congestion calculations. There has been a long-standing problem of modelling by MOT, DoT and DETR of using models whose implied elasticities that are too low
-recognised by DETR – and it is possible that this has not yet been completely remedied.
(d) Speed Flow Relationships
At the heart of the model is a set of relationships, separately for each road type, between traffic speed and the volume of traffic – the more traffic, the lower the speed. It is these relationships which result in traffic growth being damped by the congestion it experiences, and induced by extra capacity.
There are some differences in the way the model treats speed-flow relationships, compared either with the traffic engineering textbooks (see a summary in May et al, 200), or the real world observations (eg Banks, 1989).
First, both the model and the textbooks typically treat well-defined average conditions, whereas the real world is variable and less well-behaved. Such a distinction often does not matter, but in the case of the subjective experience of congestion it does, as discussed above: variability is of the essence of the human experience of congestion.
Secondly, both the textbook and real world cases show that the higher the level of traffic, the steeper the curve. The model relationship
replicates this for most (but not all) high speeds, but not at low speeds – perversely, as congestion gets worse in the model, additional vehicles have proportionally less effect, not more.
Thirdly, the text book and real world experience both allow for ‘grinding to a halt’ – traffic volumes which are so much in excess of capacity that nothing moves at all. The model (because its forecasts are intended to relate to averages of many days, not the experience of a particular journey or day) does not have this property: speeds never come lower than 5 kilometres per hour, and for some classes of road are presumed never to fall below 10 or even 20 kilometres per hour, no matter how heavy the traffic.
The second and third of these seem likely to imply a weakness in treating those parts of the network and times of the day that experience
are some further features of the model, as reported in DETR (2000d), which are not yet understood.
Overall effect
The evidence available is consistent with the proposition that the model’s forecasts are less sensitive to cost changes, and may be less sensitive to time changes, than they should be. If this is so, then it would have the following results:
(a) in the case of new infrastructure, to underestimate the impact of induced traffic – either globally or at the localised level where it is more important, and therefore potentially to overestimate the reduction in congestion due to these projects;
(b) in the case of pricing and other traffic management, to underestimate the scope for achieving desired objectives by changing volumes of traffic;
(c) in relation to tax revenue, a potential issue of calculated yield from changes in taxation which might (although it does not feature large in the Plan) prove to be important.
Other methodological questions
A key feature emerging from these issues is that the ‘ten year’ time scale is not firmly attached to a timetable for delivery and a calculated
trajectory of year-by-year impacts. This is crucial as the modelling used is particularly weak on predicting the time scale of effects as they evolve year by year.
There are two other modelling issues, which will require further attention, but have not been a large feature of the project. These are: a) The model used for the Plan is not at all suitable for assessing any
particularproject: it cannot, for example, test the relative merits of each of the ‘100 bypasses’ in addressing local problems. (This is vital, as it is known, for example, that a bypass accompanied by strong local traffic management has quite different effects than one without such control). For all projects which need assessment, there will have to be a separate forecasting exercise based on the specific geography and network concerned. This is planned under a series of ‘multi-modal’ studies, on the presumption, at the heart of the White Paper strategy, that any particular road proposal must still rigorously prove its case as compared with other policies, management, public transport etc. The same also applies to Local Transport Plans.
the suitability of the models used to test them.
b) DETR plans a new modelling approach at national level, based more on individual journeys and less (though still to some extent) on aggregate relationships. It is not at the moment clear to me that the time scale for this work, and its specific features, will swiftly resolve the most important problems identified above.
Conclusions
It is understood that the Government did not choose to use the Ten Year Transport Plan as its vehicle for making important statements about the need to reduce car dependence or the methods of doing so; the role and impacts of land-use planning; the contribution of education and public understanding; the process of consensus formation for sustainable transport strategies; and a number of other such issues. This does not imply that they are unimportant, and indeed it is difficult to imagine how there could be success in any transport strategy without progress on these issues. The report also has not focused on such matters, and simply asserts here that they remain crucial. Concerning the questions which are at the heart of the Ten Year Transport Plan as written, the following conclusions are suggested.
Methodology and objectives
The report agrees with the Government in according great prominence to the reduction of congestion among the objectives of transport policy, always remembering that it is only one of many important considerations. However, the report argues that it is in the interest of the policy concerns of the Government, and clarity of understanding of transport users, to devise a different measure of congestion as rapidly as is feasible to do so. The current measure is difficult to interpret, revealing nothing about important aspects of congestion (such as queue length, unpredictable conditions, gridlock, day-to-day variability, instability) other than the average of all speeds on the average of all days. It is exceedingly difficult to monitor, likely to lead to unrealistic public expectations in advance, unlikely to correspond with public experience when success is reported, has some perverse policy implications (such as implying that congestion is always reduced by reductions in speed limits, even if they are
ineffective), and is not suitable as a cornerstone indicator of the
transport strategy. Its continued use can only lead to embarrassment and confusion.
Policy
Even if the present package of measures suggested in the Ten Year
Transport Plan is broadly the best that could be devised on the basis of these forecasts and technical assumptions, then revising the forecasts to take fuller account of research and experience and omitted factors would logically result in some rebalancing of the policy package. The work carried out for this report does not specify exactly how the package should be
erosion of both road and public transport benefits due to induced traffic; greater attention to the interaction with walking; rapid and urgent consideration to the actual scheduling of rail improvements; a re-examination of both the induced and suppressed traffic effects of changes in road capacity; and a renewed caution about unintended effects which come between intention and outcome. One of the
components of the Plan which has received most public attention is the suggested expansion of the road programme: this would be particularly vulnerable to the effects of induced traffic in the most congested locations.
A rebalancing along these lines could actually provide a more
encouraging picture of the scope for actually improvingtravel, in contrast to the bare maintenance of present traffic conditions which – even if the forecasts are completely correct – is currently implied.
The above points are manifestly very important for the whole transport strategy outlined. At present we are in a position where the policy
Endnotes
1 Note: the table shows that traffic is expected to grow in all
categories of roads and areas, with or without the Plan, though not necessarily in the same way as previous trends - for example, rural traffic growth has historically grown much faster than the average, which is hardly reflected in these figures. The reason for this appears to be mainly a change in the definition of ‘rural’, not an expected real change in the underlying trend, but until now this remains somewhat uncertain as national statistics, and model outputs, are not available in a form which allows exact comparisons. Further analysis on this is planned.
2 As might apply, for example, for a vehicle travelling entirely on its own on empty roads at 3am. An adjustment is made, or intended, to discount vehicles breaking the speed limit.
3 In the Summary section of this report, speeds and times were expressed per mile, and rounded, for ease of understanding. However, in these calculations I follow the usual DETR practice of using kilometres, and giving an extra decimal place of precision. 4 Another example of judgements which give intuitive problems
whatever one decides to do is how to handle traffic speed changes due to bus lanes for example: are the faster bus journeys included, or excluded, from the measured change in congestion? Both have odd results. By contrast, there is simply no issue about what to do when considering speed and journey times: of course they must be included.
5 By the time the technical report on the 10 Year Plan model became available in December 2000, work for an amended model was near to completion.
6 By coincidence, this is almost exactly the same figure as the 0.77% induced traffic suggested by a report for the British Road
Federation (CEBR 1994) as arising from a 7% increase in trunk road capacity, thereby leading them to discount the importance of induced traffic. In that case also, if the extra traffic mainly
appeared on the new capacity, it would have a significant effect on speeds.
7 The reported figure of 1.7% is sensitive to rounding, and 1.3% is more precise.
requirements. This means that conventional tests using economic theory, statistical goodness of fit, or internal consistency, though important, cannot reveal the overallcredibility of the forecasts. These have to be judged by treating the forecasting system as a black box, and running diagnostic tests calculated to reveal what the model as a whole actually does. A programme of test has been devised for this purpose, and suggested to DETR.
References
Banks J H (1989) Freeway speed-flow-concentration relationships: more evidence and interpretations, Transportation Research Record 1225, Transportation Research Board, Washington USA
Cairns S, Hass-Klau C & Goodwin P (1998) Traffic effects of highway capacity reduction, Landor, London
CEBR (1994) Roads and jobs, British Road Federation, London
Dargay J & P Goodwin (1999) The growth of congestion in Europe, Round Table Report 110, European Conference of Ministers of Transport, Paris DETR (1998a) National road traffic forecasts (Great Britain) 1997, Working Paper 4, DETR, London
DETR (1998b) A New Deal for Transport: Better for Everyone, (White Paper), DETR London
DETR (1999)Traffic speeds on English Roads: 1998, DETR, London DETR (2000a) Tackling congestion and pollution: the Government’s first report under the Road Traffic Reduction (National Targets) Act 1998, DETR London DETR (2000b) Transport 2010: the Ten Year Transport Plan, DETR , London DETR (2000c) Transport 2010 the background analysis, DETR London DETR (2000d) Modelling using the National Road Traffic Forecasting
framework for Tackling Congestion and Pollution and Transport 2010: The Ten Year Transport Plan, Technical Report, DETR London
Glaister S & D Graham (2000) The effect of fuel prices on motorists, AA Motoring Policy Unit & UK Petroleum Industry Association, Hampshire Glanville W H & R J Smeed (1958) The basic requirements for the roads of Great Britain, Inst of Civil Engineers, London
Goodwin P B (1992)