1813
Diffusion Tensor MR Imaging of the Brain: Effect of
Diffusion Weighting on Trace and
Anisotropy Measurements
Elias R. Melhem, Ryuta Itoh, Lisa Jones, and Peter B. Barker
BACKGROUND AND PURPOSE: In human brain, the relationship between MR signal and b value is complicated by cerebral perfusion, restricted diffusion, anisotropy, cellular mem-brane permeability, and active cellular transport of water molecules. Our purpose was to eval-uate the effect of the number and strength of diffusion-sensitizing gradients on measured iso-tropic apparent diffusion coefficients (ADCi), fractional anisotropy (FA), and their respective SD in different anatomic locations of the brain.
METHODS: Quantitative apparent diffusion coefficients and diffusion anisotropy brain maps were obtained from 10 healthy volunteers by using six different levels of diffusion weighting (b050, b15160, b25320, b35480, b45 640, and b55800 s/mm2), applied sequentially in six different directions (Gxx, Gyy, Gzz, Gxy, Gxz, Gyz) and coupled to a single-shot spin-echo echo-planar (2045/115 [TR/TE]) MR imaging technique. ADCi, FA, eigenvalues (l1, l2, l3)1 of the principal eigenvectors, and their respective SD were measured from seven different anatomic locations in the brain. Repeated measures analysis of variance was used to evaluate for the existence of significant differences in the average and SD of the calculated ADCi and FA as a function of the number and strength of b values. When a difference existed, the Bonferroni t method was used for paired comparisons of the groups.
RESULTS: The measured ADCiwas affected by the number and strength of b values (P , .05). The SD of the ADCiwas affected by the strength (P,.05) but not the number of b values (P..05). The measured FA was unaffected by the number and strength of b values (P..05). The SD was affected by the number and strength of b values (P, .05).
CONCLUSION: The number and strength of b values do influence measures of diffusion and anisotropy. Attention to the choice of diffusion sensitization parameters is important in deci-sions regarding clinical feasibility (acquisition time) and normative measures.
The role of diffusion-weighted MR imaging in the early detection of hyperacute cerebral infarcts has been established in animal models and clinical practice (1–12). Recently, investigators have used the diffusion anisotropy characteristics of white matter to study normal myelination patterns and pathologic conditions that alter microstructure such as axonal integrity (13–22).
Diffusion-weighted images are influenced by T2 decay and the orientation of the
diffusion-sensitiz-Received February 29, 2000; accepted after revision May 10. From the Department of Radiology and Radiological Sci-ences (E.R.M., R.I., P.B.B.), The Johns Hopkins Medical In-stitutions, and the School of Medicine (L.J.), The Johns Hop-kins University, Baltimore, MD.
The work was conducted at the F.M. Kirby Functional MRI Research Center, Kennedy-Krieger Institute.
Address reprint requests to Elias R. Melhem, the Depart-ment of Radiology, The Johns Hopkins Hospital, 600 North Wolfe Street, Baltimore, MD 21287–2182.
qAmerican Society of Neuroradiology
ing gradients (the latter is particularly true for tis-sues in which the diffusivity of water is anisotrop-ic) (23, 24). For quantification of diffusion in normal and abnormal tissues, apparent diffusion coefficient (ADC) maps become necessary. These maps are devoid of T2 contamination but remain affected by the orientation of the diffusion-sensitiz-ing gradients (anisotropy). Additionally, the uncer-tainty in the ADC measurements is affected by T2 decay. The generation of the ADC maps requires at least two levels of diffusion weighting (two b values) (25).
To eliminate the effects of anisotropy, isotropic ADC (ADCi) maps are generated by taking the
Methods
MR Imaging
MR studies were performed on a 1.5-T superconducting MR system (ACS NT Power Trak 6000, software release 6.1.2; Philips Medical Systems, Best, The Netherlands), with a max-imum gradient capability of 23 mT.m21and a slew rate of 103
mT.m21.ms21. Brain MR imaging was performed using a
quad-rature head coil operating in receive mode.
Assuming gaussian diffusion (matrix symmetry), diffusion tensor MR imaging of the brain was performed using six dif-ferent levels of diffusion weighting (b050, b15160, b25 320, b3 5 480, b4 5 640, and b5 5 800 s/mm2), applied
sequentially in six different directions (Gxx, Gyy, Gzz, Gxy, Gxz, Gyz) and coupled to a single-shot spin-echo echo-planar
read-out (2045/115/8 [TR/TE/excitations]; flip angle, 90 degrees). The different b values were achieved by varying the gradient strength from 0 to a maximum of 19 mT/m while keeping the duration (d) and the time between the diffusion gradients (D) fixed at 31.0 and 40.0 ms, respectively. The imaging gradients in the echo-planar readout contributed negligibly (,1%) to the b value. The field-of-view was 23 cm (80% rectangular), with a 1283128 matrix (1.7931.79 mm in-plane resolution). A total of 10 10-mm-thick sections with an intersection gap of 1 mm were acquired in 8.5 min.
Phantom Experiment
A distilled water phantom (4093/1593 [T1/T2]) was imaged in the axial plane by using the above-described technique. This was done to assess the effects of experimental and systemic errors resulting from hardware and diffusion-sensitized pulse sequence imperfections (ie, gradient cross terms and eddy cur-rents) on the behavior of the MR signal.
Participants
Ten consenting healthy adult volunteers (average age, 36 years; male:female ratio, 8:2) underwent imaging in the axial plane using the above-described technique. Participants with neurologic or psychiatric illnesses, claustrophobia, pacemak-ers, or surgical implants were excluded from the study. Internal review board approval was obtained before initiation of the study.
Data Processing and Analysis
The six independent elements of the diffusion tensor (Dxx,
Dyy, Dzz, Dxy, Dxz, Dyz) were statistically estimated
(multivar-iate linear regression) in each voxel by using on-line research software (Philips Medical Systems). From the diffusion tensor data, voxel-by-voxel water phantom and brain maps of the ADCi, FA, and eigenvalues (l1, l2, l3) were calculated
on-line according to equations 1 through 4 (see Appendix) and
standard matrix procedures. Sorting of the eigenvalue accord-ing to size was not necessary for calculataccord-ing the FA.
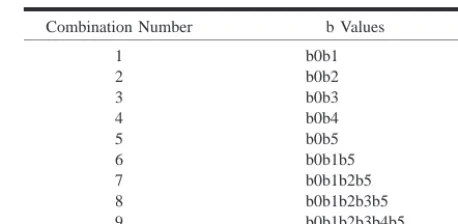
The brain maps were calculated using nine combinations of the six different b values (Table 1). All calculated brain maps (450 maps: 10 volunteers3nine b-value combinations3five different parameters) and water phantom maps (45 maps: nine b-value combinations3five different parameters) were trans-ferred to an UltraSPARC II workstation (EasyVision, software release 4.1; Philips Medical Systems) for further analysis. Us-ing commercially available software, measurements of ADCi, FA,l1,l2, andl3were made from variably sized oval-shaped
regions of interest (ROI) placed in the water phantom, centrum semiovale (white matter), and putamina (deep gray matter) bi-laterally, in the genu and splenium of the corpus callosum, and in the pons (Fig 1). In the brain, placement of the ROI in the different anatomic locations was based on the T2-weighted ref-erence images (b value50). The identical placement of ROI in the various maps calculated for water phantom and for each volunteer was achieved by using a copy/paste tool and was checked visually to ascertain if they lay over the corresponding anatomic regions.
Statistical Analysis
The average and the SD of the measured ADCiand FA were
calculated for 10 volunteers from maps generated using all six b values (b0, b1, b2, b3, b4, b5). For both the water phantom and brain, repeated measures analysis of variance (ANOVA) was used to evaluate for the existence of significant differences in the average and SD of the calculated ADCiand FA, based
on the number and strength of b values. When a difference existed, the Bonferroni t method was used for paired compar-isons of the groups. P values less than .05 were considered significant for the repeated measures ANOVA, and P values less than .005 were considered significant for the Bonferroni t method.
Results
Phantom Experiment
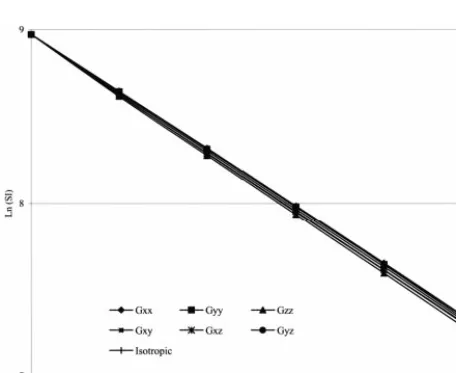
The MR signal intensity from the phantom de-cayed in a monoexponential manner as a function of b values (Fig 2). The measured ADCi and FA
from the water phantom maps generated using all six b values (b0, b1, b2, b3, b4, b5) were 21203 1026mm2/s and 0.03, respectively.
There were no differences in the measured ADCi
and FA with changes in the number and strength of b values (P 5.94 and .88, respectively). There were no significant differences in the SD of the measured ADCi and FA with changes in the
[image:2.612.299.528.87.199.2]FIG1. Axial ADCi, FA, and eigenvalue maps.
A, ROI used in data analysis are superimposed on axial ADCimap and FA map calculated at the level of the basal ganglia.1, left
putamen;2, right putamen; 3, genu of corpus callosum; 4, splenium of the corpus callosum. ROI were also placed in the pons and centrum semiovale (not shown). The location and size of the ROI varied across participants and hemispheres but was kept fixed across the different maps.
B, Axial calculated eigenvalue maps (l1,l2,l3) at the level of the basal ganglia.
[image:3.612.60.288.307.493.2]FIG 2. Signal decay versus b value obtained from diffusion-weighted (six directions) MR images of a water phantom. The monoexponential decay indicates minimal influence of experi-mental/systemic errors on measurements.
TABLE 2: Measured values of average ADCiand FA obtained
from maps generated using all 6 b values
ADCi
(31026mm2/sec)
Average SD
FA
Aver-age SD
Genu of corpus callosum Splenium of corpus callosum Pons
Left putamen Right putamen Left centrum semiovale Right centrum semiovale
863.00 905.80 1276.00 1000.00 967.00 830.00 887.00
161.70 137.00 172.70 145.10 183.60 135.90 110.60
0.61 0.61 0.63 0.10 0.10 0.52 0.51
0.038 0.033 0.021 0.046 0.037 0.028 0.024
ADCi and FA was significantly different with changes in the strength of b values (P,.05). The largest SD in the measured ADCi and FA was for the b0b1 group (14 3 1026mm2/s and 0.07,
respectively).
Participants
The average and SD of the measured ADCiand FA from all seven distinct anatomic locations were comparable with those of published results (21, 27, 29) (Table 2).
ADCi versus Number of b Values
ANOVA did not reveal significant differences in the measured ADCiwith changes in the number of
b values from the genu and splenium of the corpus callosum (Table 3). A statistically significant dif-ference was reached, however, for the pons, puta-men, and centrum semiovale.
Paired comparisons of the five groups for the pons, putamen, and centrum semiovale showed a significant difference in the ADCi between the
b0b5 group and the remaining four groups (b0b1b5, b0b1b2b5, b0b1b2b3b5, b0b1b2b3b4b5) (Fig 3). There were no significant differences in the SD of the measured ADCi with changes in the
number of b values from all anatomic locations.
ADCi versus b Value
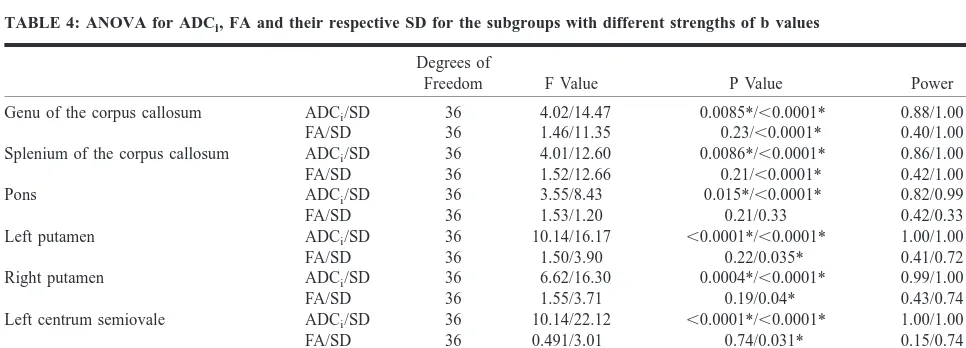
ANOVA revealed significant differences in the measured ADCiwith changes in the strength of dif-fusion sensitization (b values) from all anatomic locations (Table 4). In the genu and splenium of the corpus callosum, there was a significant differ-ence in the ADCi between the following groups: b0b1 and b0b2, b0b1 and b0b3, b0b1 and b0b4, and b0b1 and b0b5. In the pons, there was a sig-nificant difference in the ADCi between b0b1 and
FA/SD 36 0.14/2.18 0.96/0.091 0.076/0.58 Right centrum semiovale ADCi/SD
FA/SD
36 36
12.89/1.09 0.60/1.47
,0.0001*/0.38 0.66/0.23
1.00/0.30 0.18/0.41
* Reached statistical significance.
FIG3. Graph of the average ADCifor the different number of b values, obtained from the right centrum semiovale, shows a significant
difference between the b0b1 group and the remaining four groups.
FIG4. Graph of the average ADCifor the different strengths of b values, obtained from the right centrum semiovale, shows a significant
[image:4.612.47.528.77.250.2]difference between all the groups except b0b4 and b0b5.
TABLE 4: ANOVA for ADCi, FA and their respective SD for the subgroups with different strengths of b values
Degrees of
Freedom F Value P Value Power
Genu of the corpus callosum ADCi/SD
FA/SD
36 36
4.02/14.47 1.46/11.35
0.0085*/,0.0001* 0.23/,0.0001*
0.88/1.00 0.40/1.00 Splenium of the corpus callosum ADCi/SD
FA/SD
36 36
4.01/12.60 1.52/12.66
0.0086*/,0.0001* 0.21/,0.0001*
0.86/1.00 0.42/1.00
Pons ADCi/SD
FA/SD
36 36
3.55/8.43 1.53/1.20
0.015*/,0.0001* 0.21/0.33
0.82/0.99 0.42/0.33 Left putamen ADCi/SD
FA/SD
36 36
10.14/16.17 1.50/3.90
,0.0001*/,0.0001* 0.22/0.035*
1.00/1.00 0.41/0.72 Right putamen ADCi/SD
FA/SD
36 36
6.62/16.30 1.55/3.71
0.0004*/,0.0001* 0.19/0.04*
0.99/1.00 0.43/0.74 Left centrum semiovale ADCi/SD
FA/SD
36 36
10.14/22.12 0.491/3.01
,0.0001*/,0.0001* 0.74/0.031*
1.00/1.00 0.15/0.74 Right centrum semiovale ADCi/SD
FA/SD
36 36
23.36/18.91 0.67/2.70
,0.0001*/,0.0001* 0.62/0.046*
1.00/1.00 0.19/0.69
[image:4.612.53.528.293.467.2] [image:4.612.47.530.558.732.2]FIG5. Graph of the average SD of ADCifor the different strengths of b values, obtained from the splenium of the corpus callosum,
shows a significant difference between the b0b1 group and the remaining four groups.
FIG 6. Graph of the average SD of FA for the different strengths of b values, obtained from the splenium of the corpus callosum, shows a significant difference between the b0b1 group and the remaining four groups.
there was a significant difference in the ADCi be-tween the b0b1 group and the remaining four groups. In the left centrum semiovale there was a significant difference in the ADCi between the
b0b1 group and the remaining four groups and be-tween the b0b2 group and the remaining four groups. Finally, in the right centrum semiovale, there was a significant difference in the ADCi
be-tween all the groups except b0b4 and b0b5 (Fig 4). Also, there were significant differences in the SD of the measured ADCi with changes in the strength of diffusion sensitization (b values) from all ana-tomic locations. In all locations, there were signif-icant differences between the following groups: b0b1 and b0b2, b0b1 and b0b3, b0b1 and b0b4, and b0b1 and b0b5. In addition, there were signif-icant differences between b0b2 and b0b4 and be-tween b0b2 and b0b5 in the genu of the corpus callosum and both putamina. In all locations, the SD was greatest for the weakest diffusion sensiti-zation (b0b1), with a gradual decrease to a mini-mum for the strongest diffusion sensitization (b0b5) (Fig 5).
FA versus Number of b Values
ANOVA did not reveal significant differences in the measured FA with changes in the number of b values from all anatomic locations (Table 3). On the other hand, there was a statistically significant difference in the SD of the measured FA between the b0b5 and the remaining four groups (b0b1b5, b0b1b2b5, b0b1b2b3b5, b0b1b2b3b4b5) in both putamina.
FA versus b Value
ANOVA did not reveal significant differences in the measured FA with changes in the strength of diffusion sensitization from all anatomic locations (Table 4). A significant difference did exist,
how-ever, in the SD of the measured FA with changes in the strength of diffusion sensitization from all anatomic locations except for the pons. In these locations, there were significant differences be-tween the following groups: b0b1 and b0b2, b0b1 and b0b3, b0b1 and b0b4, and b0b1 and b0b5. The SD was greatest for the weakest diffusion sensiti-zation (b0b1), with a gradual decrease to a mini-mum for the strongest diffusion sensitization (b0b5) (Fig 6). Interestingly, for the tested b values over 160 s/mm2, there was no difference in the
measured FA and SD.
Discussion
The ability to determine a narrow range of nor-mative ADCiand FA measures in different
anatom-ic locations of the brain is critanatom-ical for identifying subtle abnormalities (ie, early demyelination) in pa-tients and defining thresholds for disease burden quantification (ie, volume of infarcts). With this goal in mind, it becomes important to study factors that may influence the normative values and their SD. Random (Brownian) motion of water molecules along the direction of a strong magnetic field gra-dient results in MR signal loss from spin dephasing (22). The MR signal loss is governed by the dif-fusivity of water at a specific temperature and pres-sure and the degree of the diffusion sensitizing (b value), which is determined by the timing and strength of the diffusion gradients (23).
on measures of water diffusivity at low b values (30, 31). We also found significant differences in ADCi values, in all the examined anatomic
loca-tions of the brain except for the corpus callosum, as a function of the number of b values. These dif-ferences corroborate the multiexponential nature of diffusion-related MR signal decay, which explains the influence of the number of b values on the lin-ear fit and should caution investigators interested in measures of diffusion quantification to consider the strength and number of b values used in the generation of normative data (5). The monoexpo-nential decay of the MR signal from the water phantom decreases the chance that experimental or systemic errors will be responsible for multiexpo-nential decay of brain MR signal.
Regarding the SD of the measured ADCi, we
noted a dependency on the strength but not on the number of b values (Tables 3 and 4). Within the tested range of b values, we noted a decrease in the SD with the use of stronger b values (Fig 5). These findings emphasize the importance of avoid-ing low-b-value diffusion-weighted MR imagavoid-ing when the objective is to establish a narrow range of normative ADCi values.
Diffusion anisotropy in biological media such as white matter may be characterized by a symmetri-cal 333 diffusion tensor (34). In the case of gaus-sian diffusion, the application of sensitizing gradi-ents in at least six independent directions and measuring the resultant echo attenuation allows the determination of the diagonal and off-diagonal el-ements of the diffusion tensor (35).
It has been suggested by some investigators that measuring the off-diagonal elements of the diffu-sion tensor is important for accurate determination of white matter fiber orientation, degree of diffu-sion anisotropy, and the trace of the diffudiffu-sion ten-sor (29). Using the diagonal and off-diagonal ele-ments of the diffusion tensor, a new local orthogonal coordinate system (the principle coor-dinate axes: eigenvectors) is constructed and de-fines the orientation of the diffusion ellipsoid rel-ative to the laboratory coordinate system. The size and shape of diffusion ellipsoid are characterized, independently of orientation, by the lengths of the eigenvectors (eigenvalues). Some measures of an-isotropy (FA, relative anan-isotropy, volume ratio) and
ment, the number and strength of b values, and the number of signal averages all affect the imaging efficiency of these extremely motion-sensitive im-aging techniques and can cause severe degrading artifacts in the clinical setting.
Recently, it has been shown, using a Monte Car-lo computer simulation program, that of all the measures of anisotropy mentioned above, the FA has the highest contrast-to-noise ratio in gray and white matter (27). In this study, we have shown that the measured FA in gray and white matter is independent of the number of b values (Table 3). Within the range of b values tested, the implication is that only two b values may be necessary for de-termination of anisotropy. The effects of these find-ings on imaging efficiency are explicit.
On the other hand, the SD of the measured FA is affected by the strength of b values in all ana-tomic locations (Table 4). Within the tested range of b values, we noted a decrease in the SD with the use of stronger b values (Fig 6). Again, these findings serve to emphasize the importance of avoiding low b-value diffusion-weighted MR im-aging when the objective is to establish a narrow range of normative FA values.
Because of very low anisotropy in gray matter structures (putamina) and in the water phantom, the SD of the measured FA is significantly affected not only by the strength of diffusion sensitization but by the number of b values as well (Table 3) (22). Similar effects are shown in the SD of the mea-sured eigenvalues (not shown).
The measures of FA in the putamina (isotropic medium) are the lowest but are still greater than zero (Table 2). Volume averaging with adjacent white matter structures and noise contamination in-trinsic to the computation of eigenvalues are prob-ably responsible for the mild apparent anisotropy (22, 24).
with the corpus callosum, may cause an apparent reduction in anisotropy.
The assumptions and technical limitations of this study include the following: 1) gaussian diffusion of water in the brain and resultant tensor matrix symmetry (this assumption helps improve the ef-ficiency of diffusion tensor MR imaging for clinical purposes by allowing the complete characterization of the diffusion tensor using only six of the nine scalar elements; 2) suboptimal spatial separation of the diffusion-sensitizing gradients, which can neg-atively influence noise levels of the calculated ADCi, eigenvalues, and FA (36); 3) inability to
evaluate the effects of very high b values (.1500 s/mm2) on ADC
i, eignenvalues, and FA
measure-ments because of restrictions in peak diffusion-sen-sitizing gradient strength; and 4) diffusion tensor MR imaging of the entire brain with relatively thick sections (10 mm), which does increase the effects of volume averaging and phase shifts on the mea-surements from the different anatomic locations.
Conclusion
In the tested range, the number and strength of diffusion-sensitizing gradients does influence the measures and SD of the ADCiand FA for different anatomic locations of the brain. Attention to the choice of diffusion sensitization parameters is im-portant in decisions regarding clinical feasibility (acquisition time) and normative measures.
Appendix
The ADC parameter for each direction is calculated accord-ing to the followaccord-ing equation.
SIlow b-value
ADC5
1
O
ln[
]
SIall high b-values high b-value
4(bhigh lowb )
2
@
number of b-values (1)ADCiis the mean of the ADC values in the phase-encoding,
read, and section directions.
(ADCi5ADCxx1ADCyy1ADC )/3zz (2) Calculation of the eigenvalues is as follows:
detzT2lIz50
(det: determinats, T: tensor matrix,l: eigenvalue, I: identity matrix)
(Dxx2l) Dyx Dzx
) i )
) )
det) Dxy (Dyy2li) Dzy )50
) )
) Dxz Dyz (Dzz2li))
(3)
Different measures of anisotropy are shown below.
2
FA5
1
!
O
(li2ADC )i2
i51,2,3 2
4
1
!
1
O
li2
@
32
(4)i51,2,3
2
RA5
1
!
O
(li2ADC )i2
@
(33ADC )i (5)i51,2,3
(l13l23l3) VR5
3
ADCi
Trace5l11l21l3 (6) In equation 6, trace5 l1 1 l2 1 l3 and lirepresents the
different eigenvalues.
References
1. Moseley ME, Kucharczyk J, Mintorovitch J, et al. Diffusion-weighted MR imaging of acute stroke: correlation with T2-weighted and magnetic susceptibility-enhanced MR imaging in cats. AJNR Am J Neuroradiol 1990;11:423–429
2. Mintorovitch J, Moseley ME, Chileuitt L, Shimizu H, Cohen Y, Weinstein PR. Comparison of diffusion- and T2-weighted MRI for the early detection of cerebral ischemia and reperfusion in rats. Magn Reson Med 1991;18:39–50
3. Minematsu K, Li L, Fisher M. , Sotak CH, Davis MA, Fiandaca MS. Diffusion-weighted magnetic resonance imaging: rapid and quantitative detection of focal brain ischemia. Neurology 1992;42:235–240
4. Warach S, Chien D, Li W, Ronthal M, Edelmann RR. Fast mag-netic resonance diffusion-weighted imaging of acute human stroke. Neurology 1992;42:1717–1723
5. van Gelderen P, de Vleeschouwer MHM, DesPres D, Pekar J, van Zijl PCM, Moonen CTW. Water diffusion and acute stroke. Magn Reson Med 1994;31:154–163
6. Warach S, Gaa J, Siewert B, Wielopolski P, Edelman R. Acute human stroke studied by whole brain echo planar diffusion weighted magnetic resonance imaging. Ann Neurol 1995;37: 231–241
7. Sorensen AG, Buonanno FS, Gonzalez RG, et al. Hyperacute stroke: evaluation with combined multisection diffusion-weighted and hemodynamically diffusion-weighted echo-planar MR im-aging. Radiology 1996;199:391–401
8. Lovblad KO, Baird AE, Schlaug G, et al. Ischemic lesion vol-umes in acute stroke by diffusion-weighted magnetic reso-nance imaging correlate with clinical outcome. Ann Neurol 1997;42:164–170
9. Schlaug G, Siewert B, Benfield A, Edelman RR, Warach S. Time course of the apparent diffusion coefficient (ADC) abnormality in human stroke. Neurology 1997;49:113–119
10. Ulug AM, Beauchamp N, Bryan RN, van Zijl PCM. Absolute quantitation of diffusion constants in human stroke. Stroke 1997;28:483–490
11. Lutsep HL, Albers GW, De Crespigny A, Kamat GN, Marks MP, Moseley ME. Clinical utility of diffusion-weighted magnetic resonance imaging in the assessment of ischemic stroke. Ann Neurol 1997;41:574–580
12. Singer MB, Chong J, Lu D, Schonewille WJ, Tuhrim S, Atlas SW. Diffusion-weighted MRI in acute subcortical infarction. Stroke 1998;29:133–136
13. Chenevert TL, Brunberg JA, Pipe JG. Anisotropic diffusion in human white matter: demonstration with MR techniques in vivo. Radiology 1990;177:401–405
14. Moseley ME, Cohen Y, Kucharczyk J, et al. Diffusion-weighted MR imaging of anisotropic water diffusion in cat central ner-vous system. Radiology 1990;176:439–445
15. Doran M, Hajnal JV, Van Bruggen N, King MD, Youn IR, Bydder GM. Normal and abnormal white matter tracts shown by MR imaging using directional diffusion weighted sequences. J Com-put Assist Tomogr 1990;14:865–873
fusion-tensor anisotropy brain MR imaging: normative human data and anatomic analysis. Radiology 1999;212:770–784 23. Le Bihan D. Diffusion and Perfusion Magnetic Resonance
Im-aging: Applications to Functional MRI. New York: Raven Press; 1995
24. Pierpaoli C, Basser PJ. Toward a quantitative assessment of diffusion anisotropy. Magn Reson Med 1996;36:893–906 25. Stejskal EO, Tanner JE. Spin diffusion measurements: spin
ech-oes in the presence of a time dependent field gradient. J Chem Phys 1965;42:288–292
26. Hsu EW, Mori S. Analytical expressions for the NMR apparent diffusion coefficients in an anisotropic system and a simplified method for determining fiber orientation. Magn Reson Med 1995;34:194–200
water in healthy cat brain and in stroke studies by NMR dif-fusion imaging. Magn Reson Med 1991;19:327–332
33. Niendorf T, Dijkhuizen RM, Norris DG, et al. Biexponential dif-fusion attenuation in various states of brain tissue: implica-tions for diffusion weighted imaging. Magn Reson Med 1996; 36:847–857
34. Basser PJ, Mattiello J, LE Bihan D. Estimation of the effective self-diffusion tensor from the NMR spin echo. J Magn Reson B 1994;103:247–254