922
Abnormal Magnetization Transfer Ratios in
Normal-appearing White Matter on Conventional MR Images of
Patients with Occlusive Cerebrovascular Disease
Hirotsugu Kado, Hirohiko Kimura, Tatsuro Tsuchida, Yoshiharu Yonekura, Tomoo Tokime, Yasuhiko Tokuriki, and Harumi Itoh
BACKGROUND AND PURPOSE: Chronic hypoperfusion may cause ischemic insult in the deep white matter. The magnetization transfer phenomenon is associated with the amount and constitution of myelin. The purpose of this study was to assess the usefulness of the magneti-zation transfer ratio (MTR) for detecting vasculometabolic abnormalities on positron emission tomography (PET) studies in patients with unilateral severe stenosis of the internal carotid artery (ICA).
METHODS: MTR maps and PET data—including regional cerebral blood flow (rCBF), re-gional cerebral metabolic rate of oxygen (rCMRO2), and regional oxygen extraction fraction
(rOEF)—were investigated in 13 patients with unilateral severe stenosis of the ICA. The same regions of interest were selected in the white matter both on MTR maps and PET scans. The areas were classified into three groups based on MTR values (group 0, MTR.47.22%; group 1, MTR5 45.77% to 47.22%; group 2, MTR ,45.77%), and the relationship between MTR and PET data was analyzed by means of both absolute values and asymmetric index (AI).
RESULTS: Abnormal values could not be detected in the areas classified as group 0. The areas classified as group 1 were characterized by absolutely normal values of rCMRO2and
increased rOEF with AI, which was assessed as viable and reversible on the PET study. The areas classified as group 2 showed decreased rCMRO2 with absolute values, which was
con-sidered irreversible in PET. A significant overall linear correlation was found between MTR and rCMRO2values.
CONCLUSION: Using the MTR technique to classify ischemic damage into three groups (normal, reversible, and irreversible), we found a significant correlation between the reduction of MTR and that of rCMRO2in white matter with ICA stenosis. We believe that the MTR
technique may partly replace PET data in the assessment of ischemic injury.
The magnetization transfer (MT) technique has been used as a means of changing image contrast. MT is related to relaxation properties associated with immobile protons of neighboring macromol-ecules in tissue membranes and bulk free water. An off-resonance radio-frequency pulse is applied to saturate immobile protons. Any exchange of this saturated pool of protons with the protons in the surrounding bulk free water will change the signal intensity seen on subsequent MR images (1–5). In
Received July 13, 2000; accepted after revision November 15. From the Department of Radiology (H.Ka., H.ki., T.Tsu., H.I.) and Biomedical Imaging Research Center (Y.Yo.), Fukui Medical University, Fukui; and Department of Neurosurgery (T.To., Y.To.), Fukui Red Cross Hospital, Fukui, Japan
Address reprint requests to Hirotsugu Kado, MD, Depart-ment of Radiology, Fukui Medical University, 23 Shimoaizuki, Matsuoka, Yoshida-gun, Fukui 910–1193, Japan.
qAmerican Society of Neuroradiology
brain tissue, the cholesterol-containing lipid bilayer of myelin is regarded as the major macromolecule responsible for the MT phenomenon (6). Once the constitutional changes of the macromolecule in my-elin occur, the exchanges between bound and bulk free water protons might occur less frequently than in normal brain tissue, thus causing the reduction of magnetization transfer ratios (MTRs). Therefore, the MTRs are thought to reflect changes in the amount and constitution of myelin present in white matter. The measurement of MTRs has proved to be useful for characterizing some types of brain disease, such as multiple sclerosis (7, 8), wallerian degeneration (9), and diffuse axonal injury (10).
to-TABLE 1: Demographic and clinical data for 13 patient with uni-lateral severe stenosis of the internal carotid artery (ICA)
Patient
No. Age (y)/Sex
ICA Stenosis (Right/Left) Percentage of Stenosis (%) 1 2 3 4 5 56/M 60/F 65/F 68/M 66/M R R R R R 99 75 75 90 80 6 7 8 9 10 64/M 74/F 84/M 75/M 72/F R L L R R 95 90 90 90 80 11 12 13 54/M 63/M 55/M L L R 99 90 80
mography (PET) and proton MR spectroscopy (13, 14). The sensitivity of MTR measurement is su-perior to that of conventional MR images in de-tecting abnormalities in white matter in some dis-eases (7, 8). Therefore, we hypothesized that abnormal MTRs would be closely related to the compromised metabolic state in noninfarcted white matter with severe stenosis of the ICA.
In the current study, we measured MTRs and correlated them with vasculometabolic parameters obtained by PET in patients with chronic occlusive cerebrovascular disease. Our goal was to evaluate the usefulness of the MTR technique for detecting vasculometabolic abnormalities in PET data in pa-tients with unilateral severe stenosis of the ICA.
Methods
Subjects
Thirteen patients with unilateral severe stenosis of the ICA participated in this study. Ages ranged from 54 to 84 years old, with a mean age of 65.86 8.8 years. The patients were selected on the basis of the following criteria: 1) no cortical infarction other than minimal subcortical abnormality as re-vealed by MR images, and angiographic evidence of more than 75% stenosis in caliber or occlusion of the common carotid artery; and 2) collateral vessel circulation through the anterior portion of the circle of Willis (cross-flow) in the presence of unilateral severe stenosis of the ICA. The demographic and clinical data for all subjects are summarized in Table 1. All subjects gave written informed consent to a protocol approved by the committee for clinical research of this institute.
MR Measurement
Conventional MR images were obtained in all subjects on a 1.5-T scanner. Anatomic MR images were obtained with a T1-weighted sagittal spin-echo sequence using parameters of 350/ 14 (TR/TE). Fast spin-echo (FSE) T2-weighted images were acquired before calculation of the MTR maps. Parameters for the T2-weighted images were 3500/84, a section thickness of 5 mm with a 2-mm gap, a field of view (FOV) of 22 cm, and an acquisition matrix of 2563192.
Using the gradient-recalled acquisition in the steady state (GRASS) technique with (Ms) and without (M0) an MT
satu-ration pulse, MTR maps were calculated on a pixel-by-pixel basis using the following equation:
MTR5(M02M ) / Ms 03100 (%).
Parameters for the GRASS sequence were 600/4, a flip angle of 20 8, a section thickness of 5 mm with a 2-mm gap, an FOV of 22 cm, and an acquisition matrix of 2563128. Mag-netization transfer (Ms) was performed with a single
sinc-shaped pulse irradiating 1.5 kHz off-resonance from water. The duration and peak were 17 milliseconds and 1.4 times higher than that of the 908 pulse, respectively. Although the pulses were used in every 50 milliseconds under 12 multislice TR5 600 acquisition, the power deposition was well within the lim-itation of the signal absorption rate. The patient’s head was carefully positioned for the comparison with PET scans. The acquired tomographic slices were parallel to the orbitomeatal line on the MR images.
PET Measurement
Within 3 hours after the MR study, cerebral blood flow (CBF), cerebral metabolic rate of oxygen (CMRO2), and
ox-ygen extraction fraction (OEF) were measured using a PET scanner equipped with an 18-ring detector arrangement. The physical characteristics of this PET scanner have been de-scribed in detail by DeGrado et al (15). With axial continuous gantry motion, this scanner provides 35 transaxial images si-multaneously with an interval space of 4.25 mm. Axial and transaxial resolutions were 4.2 mm, allowing multidirectional reconstruction of the images without loss of resolution. The spatial resolution of the reconstructed PET scans was 6 mm in full width at half-maximum intensity (FWHM) at the center of the FOV. The FOV and pixel size of the reconstructed images were 256 and 2 mm, respectively. The patient’s head was care-fully positioned such that the midsagittal plane of the head was parallel to the camera’s sagittal plane using a laser-beam point-er for comparison with the MR images. A 10-minute trans-mission scan was acquired with a 68-Ge/68-Ga source for at-tenuation correction.
The steady-state method and [15O]-labeled CO
2were used
for regional CBF (rCBF) measurements. After patients contin-uously inhaled [15O]-labeled CO
2, their PET data continued to
be recorded under the steady-state condition for 10 minutes. Three arterial blood samples were obtained from the radial artery, and their radioactivity concentrations were counted us-ing a well counter cross-calibrated to the PET scanner. After the rCBF study, regional OEF (rOEF) was measured by means of the continuous inhalation of [15O]-labeled O
2 and by the
method described by Lammertsma and coworkers (16, 17). Us-ing the rCBF and rOEF values, regional cerebral metabolic rate of oxygen (rCMRO2) was calculated pixel by pixel. The ac-quired tomographic slices were parallel to the orbitomeatal line on PET studies.
Data Analyses
Region of Interest (ROI) Selection.—CBF, CMRO2, and
OEF images obtained by PET were registered with the MR images of each subject by means of statistical parametric map-ping using software (from the Welcome Department of Cog-nitive Neurology, London, UK) implemented in Matlab (Math-works, Inc, Sherborn, MA).
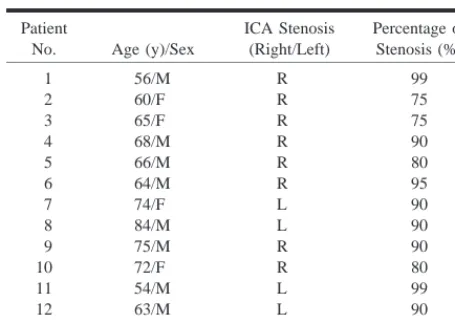
After registration, we selected seven ROIs on the lesional side in each subject and the same ROIs at the level of the ventricular body both on the MTR maps and the PET scans (CBF, CMRO2, and OEF). The circular, 21-mm-diameter ROIs
[image:2.612.60.288.85.247.2]FIG 1. The location of selected ROIs. Four ROIs were selected in the lesional deep white matter and three in the lesional centrum semiovale. Although this figure shows that ROIs were placed only on MTR maps and CBF images, actually the same ROIs were selected on T2-weighted im-ages and other PET scans (CMRO2and
[image:3.612.210.528.56.315.2]OEF images). PET scans were registered to the MR images of each subject. Circular ROIs were placed in right and left sym-metrical locations, so that the AI could be calculated.
TABLE 2: Mean values of absolute regional cerebral blood flow (rCBF), absolute regional cerebral metabolic rate of oxygen (rCMRO2), absolute regional oxygen extraction fraction (rOEF), normalized T2-weighted images, and rOEF asymmetric index (AI) from the lesional side in 13 patients with unilateral severe stenosis of the internal carotid artery by group*
Absolute rCBF (mL/100 g per min)
Absolute rCMRO2
(mg/100 g per min) Absolute rOEF
Normalized
T2 intensity rOEF-AI
Group 0 Group 1 Group 2 Infarction
24.4364.21 21.0664.75 17.7265.93 10.1364.37
2.1860.12 2.0060.23 1.5160.29 0.5860.37
0.5060.08 0.5760.11 0.5660.09 0.2560.06
0.4560.03 0.4760.02 0.5860.11 0.8560.13
1.2563.22 13.2366.06 12.3565.17 268.48618.18
* Group 0, MTR.47.22%; group 1, MTR545.77% to 47.22%; group 2, MTR,45.77%.
Note.—Absolute values of rCBF gradually decreased from group 0 to group 2. Absolute values of rCMRO2were maintained within the normal
range in groups 0 and 1, but those in group 2 decreased significantly (P5.0003). Although no definite difference in rOEF between group 0 and 1 were recognized quantitatively, increased rOEF-AI was seen in group 1 (P 5 .0003). The normalized T2-weighted value in group 2 were significantly higher than those in group 1 (P5.0002).
Asymmetric Index (AI).—To compare the values of rCMRO2,
rOEF, and MTR on the ipsilateral side of severe ICA stenosis, we also measured the values with the same parameters used in the contralateral position and calculated the AI to find latent abnormalities that could not be detected with absolute values. The AI was calculated in each ROI using the following equation (18):
AI5(Ri2R ) / (Rc i1R )c 323100 (%)
where Riand Rcare the ROI values in the ipsilateral and
con-tralateral white matter, respectively.
Normalized Values on T2-Weighted Images.—All values
ob-tained on T2-weighted images were normalized by CSF inten-sity to compare the same ROIs in all subjects. We located the ROI in the lateral ventricle to obtain the CSF intensity on T2-weighted images.
Group Classification.—To analyze the relationship between
MTRs and vasculometabolic rates obtained from PET, we clas-sified ROIs into three groups on the basis of MTR values. Since the average value of MTR obtained from normal white matter on the contralateral side was 50.1261.45%, we clas-sified the areas with MTR values of more than 47.22% as group 0, those with MTR values from 45.77% to 47.22% as group 1, and those with MTR values of less than 45.77% as
group 2. A value of 47.22% was defined as less than22 SD of normal MTR ranges, and a value of 45.77% was defined as less than 23 SD. Student’s t-test was performed among the three groups in regard to each parameter obtained from PET. A P value of less than .05 was considered significant.
Results
Demographic and clinical information for the 13 subjects are summarized in Table 1, and the loca-tions of selected ROIs are shown in Figure 1.
A total of 91 ROIs were classified into three groups: group 0, 34 areas from nine patients; group 1, 28 areas from seven patients; and group 2, 29 areas from eight patients. The patients were over-lapped among the three groups.
Table 2 shows the mean values of quantitative rCBF, quantitative rCMRO2, quantitative rOEF,
grad-FIG 2. 2D plot of MTR and rCMRO2 values with an AI from
groups 0, 1, and 2. The correlation coefficient was .85 (P5.001).
ually decreased from group 0 to group 2. Absolute values of rCMRO2were maintained within the
nor-mal range in groups 0 and 1, but those in group 2 decreased significantly (P 5 .0003). Although no significant differences were found in regard to the absolute values of rOEF between groups 0 and 1, the rOEF-AI in group 1 was statistically higher than that in group 0 (P 5 .0003). The normalized T2-weighted values in group 2 were significantly higher than those in group 1 (P 5.0002).
Figure 2 is a 2D plot of MTR with AI (MTR-AI) and rCMRO2values with AI (rCMRO2-AI) for
all groups. The overall linear correlation between MTR-AI and rCMRO2-AI (r5.85; P5.001) was
significant.
Discussion
The MT effect is induced by applying an off-resonance radio-frequency pulse, as has been dem-onstrated previously (1–5). The radiation generated by the pulse causes protons bound to macromole-cules to become selectively saturated and to ex-change spins with free water protons. The exex-change of partially saturated spins into the water proton pool decreases the observed magnetization of water protons, leading to hypointensity on the MT image as compared with an equivalent image obtained without radio-frequency saturation pulses. The re-duction of intensity on the image with radiation is expressed as decreased MTRs.
In cerebral white matter, the cholesterol-contain-ing lipid bilayer of myelin is postulated to be the major macromolecule responsible for the MT phe-nomenon (6). The amount of the lipid bilayer is controlled by membrane synthesis and degenera-tion (19). The balance between membrane synthe-sis and degeneration is often affected by the con-dition of the brain tissue; for example, in tissue associated with multiple sclerosis or metabolic dis-ease, or that in an ischemic state (20–24).
According to previous studies using PET (25– 31), changes of rCBF, rCMRO2, and rOEF in the brain tissue have been analyzed in relation to ce-rebral perfusion pressure (CPP). Although
autoreg-ulation maintains the constancy of rCBF over a wide range of CPP (25, 26), the rCBF is decreased when CPP has been lowered about 50 mm Hg by decreasing the arterial pressure. Despite the de-crease in rCBF when the CPP is reduced by ap-proximately 30 mm Hg, the rCMRO2is still main-tained or slightly decreased (25), because the oxygen demand of the brain tissue is compensated by the increased rOEF. In areas of increased rOEF, autoregulation and CO2 responsiveness are poor (30), but brain tissue has viability and reversibility. If rCBF is decreased further by the reduction of CPP, the rCMRO2 decreases significantly, because
the oxygen demand of the brain tissue cannot be compensated by rOEF. This brain tissue state is considered irreversible (25).
It is important to understand the differences be-tween deep white matter and the cortical region in regard to the nature of blood supply. The deep white matter is supplied mainly by many final mi-croarteriole of lenticulostriate arteries, which are variable and independent of one another and that play separate autoregulatory roles; on the other hand, the cortex is supplied directly by large pri-mary vessels and cortical collaterals. An infarction in deep white matter tends to be spotty, multiple, and heterogeneous, whereas an infarction in the cortex is a large lesion. Therefore, ischemic deep white matter is also considered to be heterogeneous tissue. In the present analysis, we considered each ROI from each patient as a separate piece of data, since each ROI in deep white matter could have a different blood supply and different ischemic damage.
Since the FWHM of PET data acquisition is known to be 6 mm (15), analysis of nominally smaller ROIs of less than 3 FWHM is meaningless. We could have selected smaller ROIs on the MTR maps, but these would have been less useful for correlation with the PET and MTR data. Thus, in this study, we used ROIs with a 21-mm diameter, based on the requirement of PET data analysis. A small region of CSF contamination might have been included in some cases, but we believe this effect was limited and that selected ROIs were lo-cated primarily in white matter.
The areas classified as group 0 (MTR.47.22%) showed normal signal intensity on T2-weighted im-ages. Regional CBF values ranged from normal to slightly decreased, and rCMRO2 values were nor-mal. Therefore, the metabolic profile described by PET data was normal in this group.
The areas classified as group 1 (MTR values be-tween 45.77% and 47.22%) were characterized by decreased rCBF, normal rCMRO2, and increased
rOEF-AI. In this group, the oxygen demand of brain tissue was partly compensated; and the brain tissue was thought to be viable and reversible, since the rCMRO2 measured by PET was maintained
considered to be in a compromised vasculometa-bolic state and to remain reversible. Perfusion ther-apy, such as extra- or intracranial bypass surgery, is apparently indicated for patients who have le-sions falling within this group.
Although the exact mechanism of the slight re-duction of MTR in group 1 was not fully explained, a subtle constitutional change might occur in cell membranes, and thus the interaction between free water protons and macromolecules may be low-ered. The major source of the MT phenomenon in white matter is thought to be myelin sheets of ol-igodendroglia with embedded protein (33). We could postulate that MTR values from white matter primarily reflect glial viability, since the major cel-lular component of white matter is glial cells. On the other hand, rCMRO2 mostly reflects the
meta-bolic activity of both neurons and glia. However, the activity of neurons is known to be greater than that of glia (34), and therefore we could consider rCMRO2 as the neuronal viability. Hence, the
slightly decreased MTRs and normal rCMRO2 in group 1 might correspond to the subtle glial dam-age and intact neuronal tissue due to the mild is-chemic insult. If the damage means a constitutional change of myelin, in which the interactions be-tween free water and macromolecules are less fre-quent than those in normal tissue, this state may be potentially reversible. Although we cannot deny the possibility that the change involves subtle but ir-reversible microscopic changes, the former state is more reasonable for group 1, since the oligoden-drocyte supports oxygen and metabolic supply to the neuronal cells (34) and this glial function was still retained in this group according to the result of rCMRO2. Some studies have suggested the oc-currence of a constitutional change in myelin and of the intactness of neuronal tissue in a chronic ischemic state (11–13, 24, 35).
The areas classified as group 2 (MTR,45.77%) were characterized by quantitatively decreased rCBF and rCMRO2. The state of the brain tissue in this area was considered irreversible, because the decreased values of rCMRO2 were demonstrated absolutely by PET (25, 30, 32). The signal intensity on normalized T2-weighted images in this area was increased, which meant that a normal constitution had not already existed. An irreversible loss of neu-rons and oligodendrocytes, demyelination, and re-active gliosis were postulated in this area (36–38). Finally, by using the MTR technique, we were able to classify ischemic areas into three groups: nor-mal, reversible, and irreversible.
The increased rOEF on the lesional side was not detected with absolute values in a portion of group 1, but we were able to demonstrate this using the AI technique. Powers et al (18) reported that the wide range of normal values for absolute measure-ments with PET makes detection of abnormalities difficult. Variations of rOEF with absolute values were found to be greater than those of other param-eters (39). The use of the AI technique has the
ad-vantage of improving sensitivity in identifying lo-calized disease (18). Therefore, we think it is possible to isolate localized abnormalities with the AI technique. The AI technique, however, allows the ROI value to be classified only as abnormal and permits no conclusion about the opposite ROI ue. So, it is worth analyzing not only absolute val-ues but also those of AI. These combined tech-niques allow the possibility of demonstrating latent abnormalities.
A comparison between MTR and rCMRO2
val-ues is noteworthy. We found that the correlation between the reduction of MTR-AI and that of r-CMRO2-AI was statistically significant in long-standing ischemic brain tissue. Powers and co-workers (40, 41) found that the rCMRO2 value is a good indicator of brain tissue viability, indicating that the MT phenomenon has a close relation to the viability of ischemic brain tissue and that the re-duction of MTR could serve as a substitute marker of brain tissue viability measured by PET.
Conclusion
Compared with MTR values on the contralateral side, those on the lesional side revealed only a slight reduction in ischemic brain tissue. The areas classified as group 1 (MTR between 45.77% and 47.22%) were characterized by a maintained r-CMRO2 and increased rOEF-AI, which may be considered as viable tissue in a PET study. On the other hand, the areas in group 2 (MTR,45.77%) had absolutely decreased values of rCMRO2, which
may be considered irreversibly damaged. The cor-relation between the reduction of MTR and that of rCMRO2 was statistically significant. MTR mea-surements in chronic cerebrovascular disease are useful for detecting hemodynamic abnormalities in PET.
References
1. Wolff SD, Balaban RS. Magnetization transfer contrast (MTC) and tissue water proton relaxation in vivo. Magn Reson Med 1989;10:135–144
2. Balaban RS, Ceckler TL. Magnetization transfer contrast in magnetic resonance imaging. Magn Reson Q 1992;8:116–137 3. Eng J, Ceckler TL, Balaban RS. Quantitative 1H magnetization
transfer imaging in vivo. Magn Reson Med 1991;17:304–314 4. McGowan JC III, Schnall MD, Leigh JS. Magnetization transfer
imaging with pulsed off-resonance saturation: variation in contrast with saturation duty cycle. J Magn Reson Imaging 1994;4:79–82
5. Gillams AR, Silver MS, Carter AP. Clinical utility of a new con-trast option from magnetization transfer concon-trast. J Magn
Re-son Imaging 1995;5:545–550
6. Fralix TA, Ceckler TL, Wolff SD, Simon SA, Balaban RS. Lipid bilayer and water proton magnetization transfer: effect of cho-lesterol. Magn Reson Med 1991;18:214–223
7. Dousset V, Grossman RI, Ramer KN, et al. Experimental allergic encephalomyelitis and multiple sclerosis: lesion characteriza-tion with magnetizacharacteriza-tion transfer imaging. Radiology 1992;182: 483–491
9. Lexa FJ, Grossman RI, Rosenquist AC. MR of wallerian degen-eration in the feline visual system: characterization by mag-netization transfer rate with histopathologic correlation. AJNR
Am J Neuroradiol 1994;15:201–212
10. Kimura H, Meaney DF, Mc Gowan JC, et al. Magnetization transfer imaging of diffuse axonal injury following experimen-tal brain injury in the pig: characterization by magnetization transfer ratio with histopathologic correlation. J Comput Assist
Tomogr 1996;20:540–546
11. Kurumatani T, Kudo T, Ikura Y, et al. White matter changes in the gerbil brain under chronic cerebral hypoperfusion. Stroke 1998;29:1058–1062
12. Kudo T, Takeda M, Tanimukai S, et al. Neuropathologic changes in the gerbil brain after chronic hypoperfusion. Stroke 1993; 24:259–264
13. Scremin OU, Jenden DJ. Focal ischemia enhances choline out-put and decreases acetylcholine outout-put from rat cerebral cor-tex. Stroke 1989;20:92–95
14. Jope RS, Jenden DJ. Choline and phospholipid metabolism and the synthesis of acetylcholine in rat brain. J Neurosci Res 1979; 4:69–82
15. De Grado TR, Turkington TG, Williams JJ, Stearns CW, Hoffman JM, Coleman RE. Performance characteristics of a whole-body PET scanner. J Nucl Med 1994;35:1398–1406
16. Lammertsma AA, Jones T. Correction for the presence of in-travascular oxygen-15 in the steady-state technique for mea-suring regional oxygen extraction ratio in the brain, 1: de-scription of the method. J Cereb Blood Flow Metab 1983;3: 416–424
17. Lammertsma AA, Jones T, Frackowiak RS, Lenzi GL. A theo-retical study of the steady-state model for measuring regional cerebral blood flow and oxygen utilization using oxygen-15. J
Comput Assist Tomogr 1981;5:544–550
18. Powers WJ, Press GA, Grubb RL Jr, et al. The effect of dynamically significant carotid artery disease on the hemo-dynamic status of the cerebral circulation. Ann Intern Med 1987;106:27–34
19. Miller BL. A review of chemical issues in 1H NMR spectros-copy: N-acetyl-L-aspartate, creatine and choline. NMR Biomed 1991;4:47–52
20. Davie CA, Hawkins CP, Barker GJ, et al. Detection of myelin breakdown products by proton magnetic resonance spectros-copy. Lancet 1993;341:630–631
21. Matthews PM, Francis G, Antel J, Arnold DL. Proton magnetic resonance spectroscopy for metabolic characterization of plaques in multiple sclerosis. Neurology 1991;41:1251–1256 22. Miller DH, Austin SJ, Connelly A, Youl BD, Gadian DG, Mc
Donald WI. Proton magnetic resonance spectroscopy of an acute and chronic lesion in multiple sclerosis. Lancet 1991;337: 58–59
23. Kruse B, Barker PB, van Zijl PC, Duyn JH, Moonen CT, Moser HW. Multislice proton magnetic resonance spectroscopic im-aging in X-linked adrenoleukodystrophy. Ann Neurol 1994;36: 595–608
24. Handa Y, Kaneko M, Matuda T, Kobayashi H, Kubota T. In vivo proton magnetic resonance spectroscopy for metabolic
chang-es in brain during chronic cerebral vasospasm in primatchang-es.
Neurosurgery 1997;40:773–780
25. Mc Pherson RW, Koehler RC, Traystman RJ. Effect of jugular venous pressure on cerebral autoregulation in dogs. Am J
Phy-siol 1988;255:H1516–H1524
26. Miller JD, Stanek AE, Langfitt TW. A comparison of autoreg-ulation to changes in intracranial and arterial pressure in the same preparation. Eur Neurol 1971–72;6:34–38
27. Grubb RL Jr, Raichle ME, Phelps ME, Ratcheson RA. Effects of increased intracranial pressure on cerebral blood volume, blood flow, and oxygen utilization in monkeys. J Neurosurg 1975;43:385–398
28. Sadoshima S, Thames M, Heistad D. Cerebral blood flow during elevation of intracranial pressure: role of sympathetic nerves.
Am J Physiol 1981;241:H78–H84
29. Rapela CE, Green HD, Denison AB Jr. Baroreceptor reflexes and autorregulation of cerebral blood flow in the dog. Circ Res 1967;21:559–5680
30. Kanno I, Uemura K, Higano S, et al. Oxygen extraction fraction at maximally vasodilated tissue in the ischemic brain estimated from the regional CO2 responsiveness measured by positron emission tomography. J Cereb Blood Flow Metab 1988;8: 227–235
31. Hoffman EJ, Huang SC, Phelps ME. Quantitation in positron emission computed tomography, 1: effect of object size. J
Com-put Assist Tomogr 1979;3:299–308
32. Carpenter DA, Grubb RL Jr, Tempel LW, Powers WJ. Cerebral oxygen metabolism after aneurysmal subarachnoid hemor-rhage. J Cereb Blood Flow Metab 1991;11:837–844
33. Angevine JB. The nervous tissue. In: Fawcett DW, Raviola E, eds. Bloom and Fawcett: A Textbook of Histology. 12th ed. New York: Chapman & Hall; 1994:309–364
34. Edvinsson L, Mackenzie ET, Mc Culloch J. Cerebral Blood Flow
and Metabolism. New York: Raven; 1993:142–152
35. Tsuchida C, Kimura H, Sadato N, Tsuchida T, Tokuriki Y, Yonek-ura Y. Evaluation of brain metabolism in steno-occlusive ca-rotid artery disease by proton MR spectroscopy: a correlative study with oxygen metabolism by PET. J Nucl Med 2000;41: 1357–1362
36. Ohta H, Nishikawa H, Kimura H, Anayama H, Miyamoto M. Chronic cerebral hypoperfusion by permanent internal carot-id ligation produces learning impairment without brain dam-age in rats. Neuroscience 1997;79:1039–1050
37. Dubas F, Gray F, Roullet E, Escourolle R. Arteriopathic leuko-encephalopathy (17 anatomo-clinical cases). Rev Neurol (Paris) 1985;141:93–108
38. Sekhon LH, Spence I, Morgan MK, Weber NC. Chronic cerebral hypoperfusion: pathological and behavioral consequences.
Neurosurgery 1997;40:548–556
39. Yamaguchi T, Kanno I, Uemura K, et al. Reduction in regional cerebral metabolic rate of oxygen during human aging. Stroke 1986;17:1220–1228
40. Powers WJ, Grubb RL Jr, Raichle ME. Physiological responses to focal cerebral ischemia in humans. Ann Neurol 1984;16: 546–552
41. Powers WJ, Grubb RL Jr, Darriet D, Raichle ME. Cerebral blood flow and cerebral metabolic rate of oxygen requirements for cerebral function and viability in humans. J Cereb Blood Flow