IN VIVO MUSCLE LENGTH CHANGES IN BUMBLEBEES AND
THE IN VITRO EFFECTS ON WORK AND POWER
K. M. GILMOUR* ANDC. P. ELLINGTON
Department of Zoology, University of Cambridge, Downing Street, Cambridge CB2 3EJ, United Kingdom
Accepted 22 June 1993
Summary
The amplitude and time course of muscle length changes were examined in vivo in tethered, flying bumblebees Bombus lucorum. A ‘window’ was cut in the dorsal cuticle and aluminium particles were placed on the exposed dorsal longitudinal muscle fibres. Muscle oscillations were recorded using high-speed video and a high-magnification lens.
The amplitude of muscle length changes was 1.9% (S.D.=0.5 %, N=7), corresponding to
the commonly quoted strain of 1–3% for asynchronous muscle. Higher harmonics, particularly the second, were found in the muscle oscillations and in the wing movements. The second harmonic for wing movements was damped in comparison to that for muscle length changes, probably as a result of compliance in the thoracic linkage. Inclusion of the second harmonic in the driving signal for in vitro experiments on glycerinated fibres generally resulted in a decrease in the work and power, but a substantial increase was found for some fibres.
Introduction
A variety of muscle preparations have been examined using driven-oscillation experiments, also known as the ‘workloop technique’, which was originally developed for asynchronous insect flight muscle (Machin and Pringle, 1960) and later extended to synchronous muscle (Josephson, 1985). A purely sinusoidal driving signal has been employed in these experiments, but in most cases the corresponding time-course of muscle length changes in vivo is unknown. Fish myotomal muscle provides an important exception to this; length changes have been measured indirectly and range from sinusoidal (Hess and Videler, 1984; van Leeuwen et al. 1990) to noticeably non-sinusoidal (Rome and Sosnicki, 1991; Rome et al. 1992). Nevertheless, only non-sinusoidal oscillations have been investigated for workloop experiments on fish muscle (Altringham and Johnston, 1990a,b; Johnson and Johnston, 1991; Anderson and Johnston, 1992; Rome and Swank, 1992).
Two rationales have been presented for the use of sinusoids in studies of insect
*Present address: Department of Biology, University of Ottawa, 30 Marie Curie, Ottawa, Ontario, Canada, K1N 6N5.
flight muscle. Most work on asynchronous muscle has been concerned with characterizing the mechanics of the contractile system (e.g. Machin and Pringle, 1960; Jewell and Rüegg, 1966; Abbott, 1973). Frequency–response analysis, in which the effects of sinusoidal length changes are measured over a range of frequencies, is a powerful tool that is commonly employed for such studies; however, it requires that the system under investigation is linear (Machin and Pringle, 1960; Kawai and Brandt, 1980), and linearity can be achieved only with very low amplitude (ø0 . 2 % peak-to-peak) oscillations (Cuminetti and Rossmanith, 1980). More recently, experiments on live synchronous muscle (e.g. Josephson, 1985; Mizisin and Josephson, 1987; Stevenson and Josephson, 1990), as well as some on glycerinated asynchronous fib r e s (Pringle and Tregear, 1969; Molloy, 1988; Gilmour and Ellington, 1993), have attempted to relate the in vitro performance to the in vivo muscle operation. The rationale for using sinusoidal signals in this case is based on the assumption that muscle length changes are similar in trajectory to wing movements, which are often approximately sinusoidal (Ellington, 1984; Dudley and Ellington, 1990). However, the articulation which couples the wings to the flight muscles is complex (e.g. Böettiger and Furshpan, 1952; Pringle, 1957), and the time-course of muscle movements could be quite different.
For asynchronous fliers, the amplitude of the muscle length changes which drive wing movements is frequently quoted to be 1–3% of the muscle rest length (e.g. Pringle, 1974; Alexander and Bennet-Clark, 1977; Tregear, 1983; Rüegg, 1988). This value appears to be based on a few observations on flies and bees by Böettiger (Böettiger, 1955, 1957a,b, 1960). For bumblebees, Böettiger and Furshpan (1954) state that ‘Probable shortening during normal flight is 0.1mm’, but they give no description of their methods or details of their results. The muscle length of their bumblebees was 5–6mm, yielding a peak-to-peak amplitude or strain of 1.7–2%. Experiments on muscle preparations, in contrast, have yielded optimal strains of 4–9% (Machin and Pringle, 1959; Pringle and Tregear, 1969; Molloy, 1988; Gilmour and Ellington, 1993), suggesting that the in vivo muscle strain could be higher than 1–3%.
To resolve these questions, the time-course and amplitude of asynchronous flight muscle oscillations were examined in vivo. High-speed video (HSV) techniques were used to make direct measurements of muscle length changes in tethered, flying bumblebees. The effect of driving muscle oscillations with a physiologically realistic waveform was then examined in a glycerinated-fibre preparation.
Materials and methods
High-speed video experiments
camera. The processor was set to give a split-screen image of the muscle with a small inset picture of the wings. (Note that in two trials the screen was divided into four equal quadrants, showing two images each of the muscle and wings.) Filming was at a nominal rate of 1000frames s21, but the split-screen option gave an effective rate of
2000frames s21for the muscle movement. For a typical bumblebee wingbeat frequency
of about 150Hz, this resulted in approximately 13 frames per wingbeat. After filming, the material was downloaded onto U-matic video tapes (Sony KCA-60K) using a JVC CR-6060E recorder.
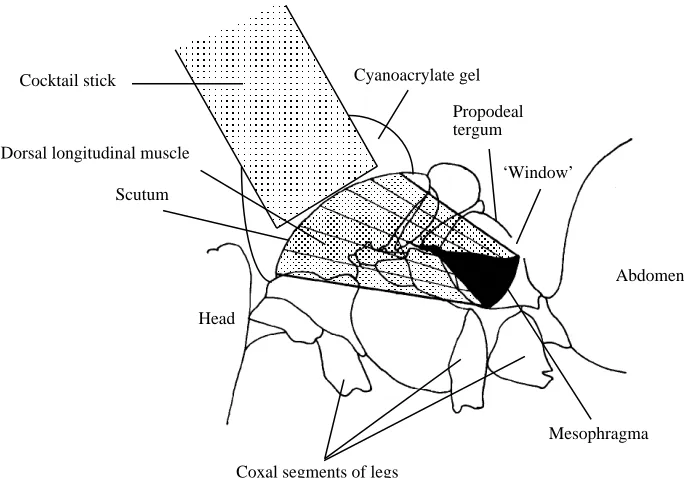
Bumblebees Bombus lucorum were used within 1 day of collection from the Cambridge University Botanic Garden. The insect was anaesthetized by cooling, and a small ‘window’ was cut in the propodeal tergum, exposing the dorsal edge of the mesophragma and a small area of the dorsal longitudinal muscles (DLM) (Fig. 1). Particles of fine aluminium powder (Hopkin and Williams) were placed on the fibres as close as possible to the phragma. Illumination of the particles produced point sources of reflected light, which acted as markers. A cocktail stick was glued to the scutum with cyanoacrylate gel. The adhesive was spread out over the scutum to immobilize the dorsal attachment of the DLMs. This method provided a firm mount while permitting unrestricted movement of the wings, head, abdomen and legs.
The mounted bumblebee was held so that the marked muscle fibres were approximately horizontal. Fibre-optic light sources illuminated the muscle and wings, and the standard camera was positioned perpendicular to the stroke plane of the wingbeat.
Cocktail stick
Dorsal longitudinal muscle
Scutum
Mesophragma Head
Coxal segments of legs
Cyanoacrylate gel
Propodeal tergum
‘Window’
[image:3.612.64.407.374.613.2]Abdomen
The image-intensifying camera was initially focused on the cocktail stick mounting, and a short sequence of flight was taped to confirm that the thorax in this area was immobilized. The magnification was then increased to about 2503and the camera was positioned at right angles to the muscle. Muscle oscillations were recorded for as long as the bumblebee could be induced to fly. Flight was elicited through loss of tarsal contact, by irritation of the insect, and/or by blowing air over the insect’s head. Only 30% of the mounted bees flew, and even in these insects it was unusual to obtain strong, sustained flight with a body position characteristic of free flight (Pringle, 1974). Owing to these difficulties and the limited availability of the HSV system, results were only collected from three queens and four workers.
A picture of a microscope micrometer slide (100 m m30 . 0 1m m = 1 . 0m m ) , positioned to bring it into the same focus as the muscle, was recorded following each bee’s flight for calibrating the muscle movements. The bumblebee was immobilized by cooling and decapitated. A strip of cuticle over the muscle fibres was carefully removed until the insertion on the scutum was exposed. Fibre lengths were measured with calipers and with a calibrated graticule in the eyepiece of a binocular microscope. As no systematic discrepancies were found, the two values were averaged to give the muscle length.
Videotapes were analysed on a U-matic recorder (Sony VO5800PS) connected to a Neotech image grabber and Macintosh IIci; the Neotech software incorporated a cursor measuring system with a screen resolution of 7683512 pixels. Tape sequences showing strong, sustained flight and an identified marker (point light source) in every frame were selected for analysis. The position of the muscle marker was measured in 128 consecutive images (6–10 wingbeats) to satisfy the power-of-2 constraint of the fast Fourier transform (FFT).
The position (x,y) of a selected muscle marker was determined in each frame, and the principal direction of oscillation for the sequence was found by reduced major axis (RMA) analysis. The coordinate system was then transformed so that an x′axis coincided with this direction; movement normal to this was characterized by the standard deviation of the y′variate. The transformed x′coordinates were subjected to an FFT to quantify the time-course of muscle oscillations. Programs for the RMA analysis, coordinate system transformation and FFT were written in MathCAD. The amplitude, in screen units, of muscle oscillations was converted to millimetres, using the calibration slide, and then divided by the muscle length to give strain.
Wingbeat frequency was measured by counting the number of complete wingbeats in a given time on the tapes. Wing kinematics were analysed using an Eltime Image III frame grabber connected to a BBC Master microcomputer with custom software written by C. P. Ellington. For most bees, only the wingbeat amplitude was determined: the angle between wing positions at the top and bottom of the wingbeat. For two queens, recorded at 2000frames s21, the wing angle was also measured in 128 consecutive images (about 8
wingbeats) for FFT analysis.
In vitro muscle experiments
experiments was examined. All of the following were as described in Gilmour and Ellington (1993): the procedures for the glycerol-extraction of B. lucorum DLM; the dissection and preparation of pared fibres; the placement of fibres on the muscle rig; the muscle rig design; data acquisition; the measurement of fibre size; and the compositions of experimental solutions. A second harmonic component f2of variable amplitude (given
as a percentage of the amplitude of the fundamental) and 0˚ phase-shift (with respect to the fundamental) could be included in the driving waveform of the custom-built function generator. The work and power of control workloops with second harmonic amplitude |f2|=0% were compared with experimental workloops with |f2|=10, 20 and 30% for
variable strain (1–5%), frequency (5–30Hz) and temperature (20–40˚C). The control workloops, collected at the beginning and end of each experimental sequence, were also used to monitor the condition of the preparation.
Results
High-speed video experiments
[image:5.612.56.428.418.588.2]Following the coordinate system transformation, deviations from the main axis of muscle movement were small; the mean standard deviation of the y′variate was about 8 % of the main oscillation amplitude. The wingbeat frequency, wingbeat amplitude, muscle length and muscle strain of each bumblebee are shown in Table 1. Queen and worker bumblebees did not differ significantly in wingbeat amplitude or muscle strain. As a result of size-related scaling, the muscles of queen bees were longer than those of workers (one-way ANOVA, F=67.2, P=0.0004) and had a lower wingbeat frequency (F=14.9, P=0.012).
Table 1. Measurements made from the high-speed videotapes
Wingbeat Muscle
Frequency Amplitude |f2| Length Strain |f2| f Bee (Hz) (degrees) (%) (mm) (%) (%) (degrees) Queen 1 140 117 8 3.8 1.5 17 −7 Queen 2 124 94 12 3.5 1.5 23 +12
Queen 3 141 128 3.5 3.0 13 0
Worker 1 157 110 2.7 2.0 29 +2
Worker 2 172 126 2.6 1.4 16 +5
Worker 3 156 94 2.3 1.7 18 −10
Worker 4 156 96 2.5 2.1 13 +16
Overall mean 149* (15) 109 (15) 10 (3) 3.0* (0.6) 1.9 (0.5) 18 (6) +3 (9) Queen mean 135 (10) 113 (17) 3.6 (0.2) 2.0 (0.8) 18 (5) +2 (9) Worker mean 160 (8) 106 (15) 2.5 (0.2) 1.8 (0.3) 19 (7) +3 (11)
The amplitude of the second harmonic component |f2| is given as a percentage of the amplitude of the fundamental; its phase shift f(+ lead, −lag) is with respect to the fundamental.
5 4
3 2
1 0
0.0 0.2 0.4 0.6 0.8 1.0
Worker 1
Worker 2 Worker 3 Worker 4
Frequency/fundamental frequency
Amplitude/maximum amplitude
B
[image:6.612.95.414.68.604.2]0
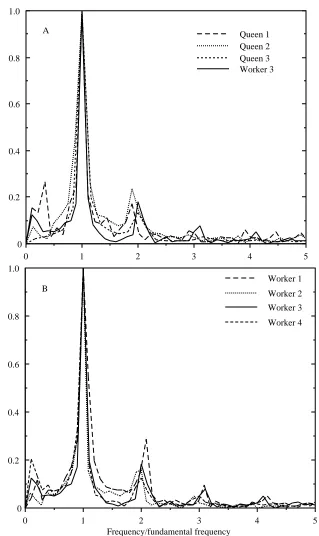
Fig. 2. Normalized Fourier transforms for the muscle movements of the seven bees. The transforms are divided into two plots for clarity; the transform of worker 3 is shown in both for comparison.
5 4
3 2
1 0
0.0 0.2 0.4 0.6 0.8 1.0
Queen 1 Queen 2 Queen 3 Worker 3
Amplitude/maximum amplitude
A
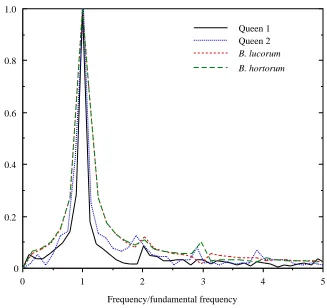
The Fourier transforms of muscle and wing movements were normalized for ease of comparison: amplitudes were divided by the maximum of each transform, and frequencies by the wingbeat frequency of the bee (Fig. 2). The largest peak in each transform occurred at the wingbeat, or fundamental, frequency. A prominent peak in the muscle transform, averaging 18% of the amplitude of the fundamental, was observed at twice this frequency, or the second harmonic (Fig. 2, Table 1). The mean phase shift of the second harmonic with respect to the fundamental was +3˚, where the positive angle denotes a phase lead. The progressively smaller peaks due to higher harmonics were variable in occurrence and of very low amplitude; they were not measured. The low-frequency components were a result of vibrations in the mounting system and may be ignored. The Fourier transforms of the two wing movement sequences indicated that higher harmonic components were also present in the wing kinematics (Fig. 3). The amplitude of the f2peak averaged 10% of the amplitude of the fundamental (Table 1).
This amplitude was significantly lower than that for muscle movements (paired t-test for queens 1 and 2, t=8.57, P=0.037).
5 4
3 2
1 0
0.0 0.2 0.4 0.6 0.8 1.0
Queen 1 Queen 2 B. lucorum
B. hortorum
Frequency/fundamental frequency
Amplitude/maximum amplitude
[image:7.612.85.412.309.617.2]0
Muscle preparation experiments
Work and power values were divided by a correction factor C to compensate for deterioration in the performance of the preparation (Stevenson and Josephson, 1990):
control work at time t
C= —————————— ,
control work at time zero
where the control work at time zero was the initial |f2|=0% work value for a given
variable (strain, frequency or temperature). The control work at the time t of collection of the experimental workloop was derived by linear interpolation between the initial and final |f2|=0% control values for an experimental series.
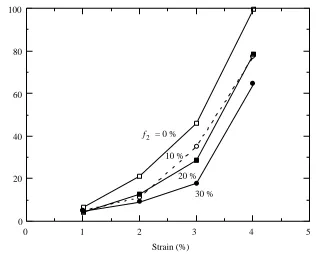
At all strains (1–5%), frequencies (5–30Hz) and temperatures (20–40˚C), inclusion of a second harmonic component caused the work output to decrease (Fig. 4), and the extent of the decline increased with the amplitude of the second harmonic (multiple regression analysis, P<0.01 in all cases).
Discussion
Amplitude of muscle oscillations
There are few reports of in vivo asynchronous muscle shortening. The early measurements of Böettiger (1955, 1957a,b, 1960) were obtained by fastening a small
0 20 40 60 80 100
0 1 2 3 4 5
_ f2 _ = 0 %
10 %
20 %
30 %
Strain (%)
[image:8.612.86.402.337.591.2]Work (% maximum)
mirror to the scutellum of a fly. Length changes in the dorsoventral muscles (DVM) during tethered flight were determined from the reflections of a light beam, and a strain of 30mm (1–2% of the rest length) was found. Molloy (1988) calculated the shortening in the DLM of a crane fly to be 3.5–4%: measurements of thoracic length were made with the wings at the extreme positions of the wingbeat during tethered flight. A recent paper by Surholt et al. (1990), using a magnetoresistive sensor to record movements of the thorax during tethered flight, suggests that the DVMs of the bumblebee Bombus terrestris might shorten by 3.5%. All of these measurements were indirect and used thoracic movements to estimate muscle length changes. However, both the dorsoventral and dorsal longitudinal muscles contribute to thoracic deformation, and if these thoracic movements are coupled, then they may not be an accurate reflection of the independent muscle shortening. The high-speed video technique used here allowed the amplitude of muscle length changes to be determined directly. The extent of in vivo shortening in
Bombus lucorum DLM, at 1.9%, was within the range of commonly accepted strains
(1–3%) for asynchronous muscle (Pringle, 1974). However, we should note a discrepancy with preliminary experiments to develop the present technique (J. M. Gabriel and C. P. Ellington, unpublished results). A normal video system, instead of the high-speed video, was used to record the aluminium marker movements as a blurred image. The resulting amplitude for B. lucorum DLM was 4.8% (S.D.=0.9%, N=13), and the discrepancy has not been resolved.
In vitro studies of asynchronous muscle have also yielded optimal strains that are
higher than 1–3%. The power of glycerinated bumblebee fibres, for example, peaks at strains of 4–5% (Gilmour and Ellington, 1993). It is possible that the pared fibres sheared within the T-clip mounts of the preparation, so the mean strain experienced by the fibre could have been lower than the applied strain of 4–5%. However, Machin and Pringle (1959) observed good workloops at a strain of 4% for live, isolated bumblebee muscle, and this observation is more difficult to explain.
These conflicting results for muscle strain tend to fall into two groups: about 2% and 4 %. Although the difference is relatively small, it may have important implications about the contractile mechanics of asynchronous muscle. The helical repeats of the thick and thin filaments are matched in Lethocerus muscle (Wray, 1979) and nearly matched in
Bombus (Tregear et al. 1993), with a repeat of about 38nm. The sarcomere length in B. terrestris, a species very closely related to B. lucorum, is 2.2mm (J. M. Gabriel, unpublished results). If the strain is indeed about 2% during contractions, then the relative movement between thick and thin filaments is only 22nm. This is well below the helical repeat of myosin heads and actin target sites, and would suggest that each contraction corresponds to a single crossbridge cycle. A strain of 4% would give a movement of about 44nm and could indicate that two cycles are involved. The smaller strain could therefore imply that the operation of asynchronous muscle is tuned to an extraordinarily high degree, involving a single crossbridge cycle, while the larger strain indicates a more adaptable system.
necessarily involve a single crossbridge cycle, and this could explain the invariance of wingbeat amplitude and muscle strain with body size and nectar load in some asynchronous insect fliers (Casey and Ellington, 1989; C. P. Ellington, A. J. Cooper and P. A. Northcott, in preparation). Lethocerus might seem to contradict this prediction;
in vivo strain has never been measured, but optimum strains as high as 6–9% have been
reported for glycerinated fibres (Pringle and Tregear, 1969; Molloy, 1988). However,
Lethocerus is atypical because of its very large size and low wingbeat frequency. To
understand the operating constraints and contractile mechanics of the majority of asynchronous fliers, future experiments are needed to resolve the discrepancy in strain measurements.
Time-course of muscle oscillations
For an independent verification of the time-course data, the wing kinematics of two bumblebees in free, hovering flight (Ellington, 1984) were re-analyzed. Results for the wing positional angle within the stroke plane should be comparable with the kinematic measurements of the present study. FFT analysis of the hovering data confirmed this to be true: the spectrum of the transform and the amplitude of the second harmonic were very similar to those of the bees filmed by high-speed video (HSV) (Fig. 3). Thus, the present study reveals a pattern of wing movements, and probably of muscle oscillations, representative of that in free flight. The f2amplitude of the wingbeat was significantly
lower than that of the muscle (unpaired t-test on muscle and pooled wing data, t=2.47,
P=0.036). A small degree of compliance in any part of the intricate thoracic linkage
between muscle and wing movements could account for the damping.
It seems most likely that the second harmonic in the muscle length changes in vivo is a reflection of non-linear crossbridge kinetics. Contractions of asynchronous muscle preparations must be considered non-linear except at very low (<0.2%) amplitudes (Cuminetti and Rossmanith, 1980), which implies that higher harmonics are intrinsic in the kinetics at physiological strains. Even at strains as small as 0.1%, the amplitude of the second harmonic in the tension response can be about 20% (Cuminetti and Rossmanith, 1980). Non-linear effects are particularly prominent at amplitudes of 2% or more, where they are visible in workloops as deviations from an elliptical shape (Machin and Pringle, 1959; Pringle and Tregear, 1969). Considerable effort has been expended in attempting to incorporate non-linear effects into models of the crossbridge cycle in asynchronous muscle (e.g. Thorson and White, 1969; Abbott, 1972; White, 1972; White and Thorson, 1972, 1973; Chaplain, 1975; Tregear, 1975; Abbott and Steiger, 1977). In recent multiple-state models, differences in the rate constants between the various states ensure that the crossbridge cycle is not a simple harmonic movement (e.g. Abbott, 1977; Thorson and White, 1983; Murase et al. 1986; Marcussen and Kawai, 1990).
Despite the presence of higher harmonics in the muscle oscillations in vivo, inclusion of f2in the driving signal for in vitro experiments generally caused the work and power to
decrease. The reduction in work averaged 20–30% at |f2|=20% – a condition which
oscillated with physiologically realistic waveforms was quite unexpected, and the causes of the reduction remain unclear. The result is additionally baffling because work and power did increase by about 20% in a few preparations upon inclusion of the second harmonic. Furthermore, the highest power ever achieved with glycerinated fibres, about 110 W kg21(muscle), was obtained with |f2|=20% (Gilmour and Ellington, 1993). These
results suggest that the second harmonic is generally detrimental, but that it can increase the work and power under certain conditions.
We wish to thank R. T. Tregear for many useful discussions throughout the course of this work, J. D. Altringham for helpful comments, N. J. Carter, J. E. Molloy and D. C. S. White for the use of their computer programs, and SERC (C.P.E.) and NSERC of Canada (K.M.G.) for financial support.
References
ABBOTT, R. H. (1972). An interpretation of the effects of fiber length and calcium on the mechanical properties of insect flight muscle. Cold Spring Harbor Symp. quant. Biol. 37, 647–654.
ABBOTT, R. H.(1973). The effects of fibre length and calcium ion concentration on the dynamic response of glycerol extracted insect fibrillar muscle. J. Physiol., Lond. 231, 195–208.
ABBOTT, R. H. (1977). The relationship between biochemical kinetics and mechanical properties. In
Insect Flight Muscle (ed. R. T. Tregear), pp. 269–273. Amsterdam: North-Holland.
ABBOTT, R. H. ANDSTEIGER, G. J. (1977). Temperature and amplitude dependence of tension transients in glycerinated skeletal and insect fibrillar muscle. J. Physiol., Lond. 266, 13–42.
ALEXANDER, R. ANDBENNET-CLARK, H. C. (1977). Storage of elastic strain energy in muscle and other tissues. Nature 265, 114–117.
ALTRINGHAM, J. D. ANDJOHNSTON, I. A. (1990a). Modelling muscle power output in a swimming fish.
J. exp. Biol. 148, 395–402.
ALTRINGHAM, J. D. ANDJOHNSTON, I. A. (1990b). Scaling effects on muscle function: power output of isolated fish muscle fibres performing oscillatory work. J. exp. Biol. 151, 453–467.
ANDERSON, M. E. ANDJOHNSTON, I. A. (1992). Scaling of power output in fast muscle fibres of the Atlantic cod during cyclical contractions. J. exp. Biol. 170, 143–154.
BÖETTIGER, E. G. (1955). Triggering the contraction process in insect fibrillar muscle. J. cell. comp.
Physiol. 46, 370–371.
BÖETTIGER, E. G. (1957a). The machinery of insect flight. In Recent Advances in Invertebrate
Physiology (ed. B. T. Scheer), pp. 117–142. Oregon: University Press.
BÖETTIGER, E. G. (1957b). Triggering of the contractile process in insect fibrillar muscle. In
Physiological Triggers (ed. T. H. Bullock), pp. 103–116. Baltimore: Waverley Press.
BÖETTIGER, E. G. (1960). Insect flight muscles and their basic physiology. A. Rev. Ent. 5, 1–16. BÖETTIGER, E. G. ANDFURSHPAN, E. (1952). The mechanics of flight movements in Diptera. Biol. Bull.
mar. biol. Lab., Woods Hole 102, 200–211.
BÖETTIGER, E. G. ANDFURSHPAN, E. (1954). The response of fibrillar flight muscle to rapid release and stretch. Biol. Bull. mar. biol. Lab., Woods Hole 107, 305.
CASEY, T. M. ANDELLINGTON, C. P. (1989). Energetics of insect flight. In Energy Transformations in
Cells and Organisms (ed. W. Wieser and E. Gnaiger), pp. 200–210. Stuttgart: Georg Thieme Verlag.
CHAPLAIN, R. A. (1975). On the contractile mechanism of insect fibrillar flight muscle. IV. A quantitative chemo-mechanical model. Biol. Cybernetics 18, 137–153.
CUMINETTI, R. ANDROSSMANITH, G. (1980). Small amplitude nonlinearities in the mechanical response of an asynchronous flight muscle. J. Muscle Res. Cell Motility 1, 345–356.
DUDLEY, R. ANDELLINGTON, C. P.(1990). Mechanics of forward flight in bumblebees. I. Kinematics and morphology. J. exp. Biol. 148, 19–52.
ELLINGTON, C. P. (1984). The aerodynamics of hovering insect flight. III. Kinematics. Phil. Trans. R.
ELLINGTON, C. P. (1985). Power and efficiency of insect flight muscle. J. exp. Biol. 115, 293–304. GILMOUR, K. M. ANDELLINGTON, C. P. (1993). Power output of glycerinated bumblebee flight muscle.
J. exp. Biol. 183, 77–100.
HESS, F. ANDVIDELER, J. J. (1984). Fast continuous swimming of saithe (Pollachius virens): a dynamic analysis of bending moments and muscle power. J. exp. Biol. 109, 229–251.
JEWELL, B. R. ANDRÜEGG, J. C. (1966). Oscillatory contraction of insect fibrillar muscle after glycerol extraction. Proc. R. Soc. Lond. B 164, 428–459.
JOHNSON, T. P. ANDJOHNSTON, I. A. (1991). Power output of fish muscle fibres performing oscillatory work: effects of acute and seasonal temperature change. J. exp. Biol. 157, 409–423.
JOSEPHSON, R. K. (1985). Mechanical power output from striated muscle during cyclic contraction.
J. exp. Biol. 114, 493–512.
KAWAI, M. ANDBRANDT, P. W. (1980). Sinusoidal analysis: a high resolution method for correlating biochemical reactions with physiological processes in activated skeletal muscles of rabbit, frog and crayfish. J. Muscle Res. Cell Motility 1, 279–303.
MACHIN, K. E. ANDPRINGLE, J. W. S. (1959). The physiology of insect fibrillar muscle. II. Mechanical properties of a beetle flight muscle. Proc. R. Soc. Lond. B 151, 204–225.
MACHIN, K. E. ANDPRINGLE, J. W. S.(1960). The physiology of insect fibrillar muscle. III. The effect of sinusoidal changes of length on a beetle flight muscle. Proc. R. Soc. Lond. B 152, 311–330.
MARCUSSEN, B. L. ANDKAWAI, M.(1990). Role of MgATP and inorganic phosphate ions in cross-bridge kinetics in insect (Lethocerus colossicus) flight muscle. In Frontiers in Smooth Muscle Research (ed. N. Sperelakis and J. D. Wood), pp. 805–813. New York: Wiley-Liss.
MIZISIN, A. P. ANDJOSEPHSON, R. K. (1987). Mechancial power output of locust flight muscle. J. comp.
Physiol. A 160, 413–419.
MOLLOY, J. E. (1988). Active insect fibrillar flight muscle, its mechanical performance and cross-bridge kinetics. PhD thesis, University of York.
MURASE, M., TANAKA, H., NISHIYAMA, K. ANDSHIMIZU, H.(1986). A three-state model for oscillation in muscle: sinusoidal analysis. J. Muscle Res. Cell Motility 7, 2–10.
PRINGLE, J. W. S.(1957). Insect Flight. Cambridge: University Press.
PRINGLE, J. W. S. (1974). Locomotion: Flight. In The Physiology of Insecta, vol. III (ed. M. Rockstein), pp. 433–476. London: Academic Press.
PRINGLE, J. W. S. ANDTREGEAR, R. T. (1969). Mechanical properties of insect fibrillar muscle at large amplitudes of oscillation. Proc. R. Soc. Lond. B 174, 33–50.
ROME, L. C., CHOI, I.-H., LUTZ, G. ANDSOSNICKI, A. (1992). The influence of temperature on muscle function in the fast swimming scup. I. Shortening velocity and muscle recruitment during swimming.
J. exp. Biol. 163, 259–279.
ROME, L. C. ANDSOSNICKI, A. A.(1991). Myofilament overlap in swimming carp. II. Sarcomere length changes during swimming. Am. J. Physiol. 260, C289–C296.
ROME, L. C. ANDSWANK, D. (1992). The influence of temperature on power output of scup red muscle during cyclical length changes. J. exp. Biol. 171, 261–281.
RÜEGG, J. C. (1988) Calcium in Muscle Activation. Heidelberg: Springer-Verlag.
STEVENSON, R. D. ANDJOSEPHSON, R. K. (1990). Effects of operating frequency and temperature on mechanical power output from moth flight muscle. J. exp. Biol. 149, 61–78.
SURHOLT, B., GREIVE, H., BAAL, T. AND BERTSCH, A. (1990). Nonshivering thermogenesis in asynchronous flight muscles of bumblebees? Comparative studies on males of Bombus terrestris,
Xylocopa sulcatipes and Acherontia atropos. Comp. Biochem. Physiol. 97A, 493–499.
THORSON, J. ANDWHITE, D. C. S.(1969). Distributed representations for actin–myosin interaction in the oscillatory contraction of muscle. Biophys. J. 9, 360–391.
THORSON, J. ANDWHITE, D. C. S. (1983). Role of cross-bridge distortion in the small-signal mechanical dynamics of insect and rabbit striated muscle. J. Physiol., Lond. 343, 59–84.
TREGEAR, R. T. (1975). The biophysics of fibrillar flight muscle. In Insect Muscle (ed. P. N. R. Usherwood), pp. 357–403. London: Academic Press.
TREGEAR, R. T. (1983). Physiology of insect flight muscle. In Handbook of Physiology, section 10,
Skeletal Muscle (ed. L. D. Peachey), pp. 487–506. Baltimore: Waverley Press.
TREGEAR, R. T., TOWNES, E., GABRIEL, J. M. AND ELLINGTON, C. P. (1993). Inferences concerning crossbridges from work on insect muscle. In Contractile Mechanisms in Muscle (ed. H. Sugi and G. Pollack). New York: Plenum Press (in press).
axial muscles of carp (Cyprinus carpio): recruitment and normalised power output during swimming in different modes. J. Zool., Lond. 220, 123–145.
WHITE, D. C. S. (1972). Links between mechanical and biochemical kinetics of muscle. Cold Spring
Harbor Symp. quant. Biol. 37, 201–213.
WHITE, D. C. S. ANDTHORSON, J. (1972). Phosphate starvation and the nonlinear dynamics of insect fibrillar flight muscle. J. gen. Physiol. 60, 307–336.
WHITE, D. C. S. ANDTHORSON, J.(1973). The kinetics of muscle contraction. Prog. Biophys. molec. Biol.
27, 173–255.