Imaging
Graeme D. Jackson, 1.3.4 Samuel F. Berkovic,2 JohnS. Duncan, 1 and Alan Connelly3
PURPOSE: To establish the optimal imaging parameters and MR features of hippocampal sclerosis. METHODS. Twenty-five outpatients with intractable temporal lobe epilepsy and 10 control subjects
were studied at 1.5T. Four features of hippocampal abnormality were specifically evaluated: increased hippocampal signal on T2-weighted images, decreased signal on T1-weighted images,
hippocampal atrophy, and disruption of the internal hippocampal structure. RESULTS. Hippocam -pal sclerosis was diagnosed alone in 64% of patients and with ipsilateral pathology in a further 8%. In these 18 cases, increased hippocampal signal on T2-weighted images was seen in 77%,
hippocampal atrophy in 83%, decreases signal on T1-weighted images in 83%, and disruption of the internal hippocampal structure in 89%. No abnormality was reported in any of the 10 control cases. CONCLUSIONS. Four MR features diagnostic of hippocampal sclerosis are reported. Inversion recovery images are very useful for identifying decreased signal in the hippocampus and loss of internal structure within the hippocampus. Based on an appreciation of these four features in optimized images, hippocampal sclerosis can be diagnosed with a high degree of accuracy and sensitivity.
Index terms: Sclerosis, hippocampal; Degenerative brain disease; Brain, magnetic resonance;
Brain, temporal lobe; Seizures
AJNR 14:753-762, May/Jun 1993
Pathologic examination shows hippocampal sclerosis in approximately 65% of epilepsy pa-tients who. undergo temporal lobectomy (1-3). Until recently, many magnetic resonance (MR) studies have failed to detect hippocampal scle-rosis reliably (4-8). Most reports have relied solely on the detection of an increased signal on T2-weighted images in the mesial temporal region. Although this increase is an important feature of hippocampal sclerosis, it can also be caused by small mesial temporal tumors, increased cerebro-spinal fluid (CSF) space, and posttraumatic
dam-Received May 20, 1992; accepted after revision August 20. This work was supported in part by a grant from Action Research (Dr Jackson).
1
Institute of Neurology, Queen Square, London, UK.
2
Department of Neurology, Austin Hospital, Heidelberg, Victoria, Aus-tralia.
3 Radiology and Physics Unit, Institute of Child Health, Guilford Street,
London, UK.
4
Address reprint requests to Dr Graeme Jackson, MRI Unit, The Hospitals for Sick Children, Great Ormond Street, London WC1N 3JH,
England.
AJNR 14:753-762, May/Jun \993 0195-6108/93/1403-0753 © American Society of Neuroradiology
753
age. It may also arise from flow artifacts due to the proximity of blood vessels. Its diagnostic relevance has thus been questioned (9).
· In our experience, increased signal on T2-weighted images is present in most cases of hippocampal sclerosis. However, it may be subtle and restricted to the hippocampal gray matter, and can even be obscured by the windowing process when hard copy film is made for clinical reporting. The degree of abnormality needed to diagnose pathology, and the criteria used for this diagnosis, also varies among the imaging spe-cialists reporting (10, 11). As a result, increased signal on T2-weighted images in the mesial tem-poral region has been reported with variable fre-quency in cases of hippocampal sclerosis. While most studies have reported increased signal on T2-weighted images in 30% of cases or less (4, 5, 7, 8), a few reports have put this figure as high as 70% (10, 11).
diag-754 JACKSON
nosed by MR imaging performed at 0.3T. Of 51 pathologically proved cases of hippocampal
scle-rosis, 93% were detected using the criteria of
visually graded hippocampal atrophy and/or in-creased hippocampal signal on T2-weighted im-ages ( 11 ). To achieve these results, understanding the imaging anatomy of the hippocampus and the pathologic anatomy of hippocampal sclerosis is essential. Images in the appropriate planes with both T1- and T2-weighted sequences enable ac-curate assessment of hippocampal morphology
and the location of any signal abnormality.
Vol-umetric analysis of coronal hippocampal images
has provided quantitative confirmation of the
observation that reduced hippocampal size, when
present, does reliably predict the side of the
epileptogenic temporal lobe (12, 13).
In this paper, we present findings in 25
consec-utive outpatients with intractable temporal lobe
epilepsy and 1 0 healthy control subjects studied
at 1.5T. We have confirmed the previous findings, in an outpatient population, and have allowed the identification of further radiologic signs of hip-pocampal sclerosis.
Materials and Methods
We evaluated 25 consecutive adult patients referred from the National Hospital for Neurology and Neurosurgery with the problem of intractable temporal lobe epilepsy. Mean age was 28 years (range, 15 to 48 years) and the mean age of seizure onset was 10 years (range, 3 months to 24 years). Patients had an average of eight seizures per month (range, three to 48), including simple partial, com -plex partial, and secondarily generalized seizures. Eleven (43%) of these had febrile convulsions in childhood lasting more than 30 minutes.
MR imaging was performed at the Hospitals for Sick Children. Two neurologists independently assessed each patient and reached a consensus diagnosis including late r-alization and localization of the epileptic focus, if possible, after review of all available data apart from the MR. These included clinical interview, multiple surface interictal elec-troencephalograms (EEGs), detailed neuropsychologic evaluation, and when necessary, ictal video EEG. Depth electrode studies were performed in three cases. Both l eft-and right-handed patients were included. Pathology was obtained in all 1 0 patients who subsequently underwent temporal lobe resection and the diagnosis of hippocampal sclerosis was based on visually graded neuronal loss of greater than 50% in Sommer's sector supported by gliosis in the cornu ammonis and end folium.
Ten control subjects of similar age who had no medical problems underwent identical MR imaging. All images were obtained from a Siemens 1 .5-T whole-body system, using a circularly polarized head coil as both transmitter and receiver.
AJNR: 14, May/ June 1993
Imaging Planes
The hippocampus is most completely assessed by im-ages in two orthogonal planes. The optimal planes for diagnosis of hippocampal sclerosis are along the long axis of the body of the hippocampus and at right angles to this (11, 14-16). This orientation avoids oblique images of the hippocampus that can be difficult to interpret because of partial volume effects. The anterior border of the brain stem, extending across the pons as seen in the sagittal view, was the radiographic landmark for orientation of the central section of the coronal sequence (Fig. 1, line A). The central section of the axial images lies along the line drawn from the lowest point of the splenium of the corpus callosum to the inferior frontal lobe margin (Fig. 1, line B). This imaging axis is at approximately 35° to standard axial and coronal images.
Imaging Protocol
Visualization of the hippocampal gray matter is impor-tant for the diagnosis of hippocampal sclerosis, so accurate distinction of gray matter from white matter, and of gray matter from CSF, is essential. Inversion-recovery images (3500/26 (TR/TE); inversion time, 300 ms; section thick-ness, 5 mm) in the tilted axial and coronal planes give optimal anatomical definition of the hippocampal gray matter. The inversion-recovery sequence was chosen be-cause it provides details of the internal structure of the hippocampus and demonstrates decreased signal on T1-weighted images in gliotic areas. We used an asymmetrical field of view with a 256 X 128 matrix to reduce scanning time to 7.5 minutes per sequence. With the acquisition of both axial and coronal images, the whole hippocampus can
[image:2.612.315.556.466.680.2]A
B
Fig. 2. The normal anatomy of the
hippocampus is shown in these tilted coronal and axial T ]-weighted inversion
-recovery images (3500/26; inversion time, 300 ms). In all figures, the patient's left is on the right side of the image.
A, The hippocampus has an oval cross section, as shown in this coronal section angled parallel to the long axis of the brain stem. The hippocampi are
symmetrical, and the signal in the hip-pocampal gray matter on Tl-weighted images appears similar in intensity to normal cortical gray matter. Internal structure can be seen within the hippo-campi (see Fig. 6).
B, In this angled axial section through the long axis of the hippocampus, the entire hippocampal head and body can be seen. The hippocampus appears as a curved sausage-shaped structure with the head forming the most anterior por-tion and the curved body of the hippocampus extending posteriorly with constant thickness (as labeled in Fig. 3). The head of the hippocampus lies directly below the amygdala and in this section none of the amygdala is seen.
TABLE 1: MR imaging diagnosis (outpatient population, n
=
25)%
Hippocampal sclerosis alone 16 64
Foreign-tissue lesions 5 20
Other significant' 2 8
No abnormality 2 8
' One FTL and one dysplasia also showed HS.
be assessed despite a section gap of 2.5 mm. Increased hippocampal signal on T2-weighted images was assessed on the second echo of a coronal double echo short tau inversion-recovery sequence (4000/23 and 85; inversion time, 145 ms) that covered the entire brain (17).
Image Evaluation
The diagnosis of hippocampal sclerosis was based both on the previously pathologically validated criteria of a visually graded unilaterally small hippocampus and/or in-creased signal on T2-weighted images localized to the gray matter of the hippocampus (11), and on the additional criteria of disruption of the internal morphology of the hippocampus and the presence of decreased signal in the gray matter of the hippocampus seen in inversion recovery images.
Three independent observers blinded to other informa-tion evaluated the images and reached a consensus diag
-nosis in cases of disagreement. Control and patient scans were mixed during the assessment procedure. Each ob-server was asked to make an overall diagnosis and to note the Iateralization of the pathology. Each of the four features of hippocampal pathology, namely, decreased signal on T1-weighted images, increased signal on T2-weighted im-ages, atrophy, and loss of internal morphologic structure,
was assessed individually in all cases. The morphology of
the hippocampus was assessed by grading the presence of normal hippocampal internal structure, and the side-to-side symmetry of the hippocampal gray matter.
Results
We (11, 14) and others (15, 18) have previously emphasized the importance of knowing the de-tails of normal and pathologic hippocampal anat-omy for accurate interpretation of MR imaging (Figs. 2 and 3). We assessed hippocampal mor-phology and hippocampal T1 and T2 signal in-tensity in 10 healthy volunteers. In no control case was abnormal internal structure or signifi-cant side-to-side asymmetry reported; this finding is consistent with the findings in controls using hippocampal volume measurements ( 18). The signal on T1- and T2-weighted images within the hippocampus was evaluated in tilted axial and coronal sections by each of the three observers. No abnormality of these features was reported in any control case by any of the three observers.
Hippocampal sclerosis was the sole MR
imag-ing diagnosis in 16 of these 25 outpatients (64% ).
Two further cases of hippocampal sclerosis were found on the same side as other pathology (a
glioma and cortical dysplasia). Foreign-tissue le-sions such as a hamartoma or glioma were found
in 20%, and significant other pathology in 8% (cortical dysplasia and temporal cyst). No detect-able MR imaging pathology was reported in 8% (Table 1 ). The frequency with which each MR
imaging feature of hippocampal sclerosis was
[image:3.612.55.417.78.287.2] [image:3.612.54.297.346.409.2]756 JACKSON
observers as hippocampal sclerosis is shown in Table 2.
Decreased signal on T1-weighted images (Figs. 38, 3C, and 4A) was found in 15 (83%) cases with the MR diagnosis of hippocampal sclerosis, and increased signal on T2-weighted images (Fig. 4B) was reported in 14 (77% ). Signal abnormality on both T1- and T2-weighted images was present in 11 cases. There was variability among the latter cases in the relative degree of signal abnor-mality on Tl- and T2-weighted images. In some, the T1-weighted imaging change was more ob-vious than the signal abnormality on T2-weighted images, and in others, the reverse was true.
These diagnostic features can also be seen in axial images (Fig. 3). In some cases, decreased T1-weighted signal is seen most clearly in this image orientation. The axial plane has the advan-tage that seeing the entire length of the abnormal hippocampal segment in a single image allows determination of the posterior extent of the signal abnormality (eg, Fig. 3C).
Hippocampal atrophy was found in 83% of the cases diagnosed as hippocampal sclerosis (Figs. 38, 4A, and 5A). Although, in our experience, the oblique coronal plane is the more sensitive for assessing atrophy in the majority of cases, oblique axial images enable assessment of the length of hippocampal atrophy in a single section (Fig. 38). In three cases, the hippocampus diag-nosed as showing sclerosis was not assessed as atrophic in the midhippocampal body. Signal abnormalities in T1- and T2-weighted images, and loss of internal morphology, easily enabled the correct lateralization and diagnosis of hippo-campal pathology even without visible hippocam-pal atrophy. In one of these cases, pathology confirmed the presence of hippocampal sclerosis following temporal lobe resection. In the other two cases, focal atrophy was present in the hip-pocampal head on MR images (eg, Fig. 58).
Disruption of the internal morphologic struc-ture of the hippocampus is the most difficult feature to define. Knowledge of the MR appear-ance of the coronal microscopic anatomy of the normal and pathologic hippocampus enables its
TABLE 2: Diagnostic features of hippocampal sclerosis (n
=
18)Hippocampal atrophy Disrupted internal structure Increased T2-weighted signal Decreased T !-weighted signal
• Same cases in only 11 of the 15.
15
16 14 15
%
83 89 77" 83"
AJNR: 14, May/ June 1993
recognition (Figs. 5 and 6). Loss of internal struc-ture was found in 89% of patients, and was reported more frequently than any other feature by all three observers. It was not reported in any of the control hippocampi. One case in which it was the only abnormality suggesting left hippo-campal pathology (Fig. 5C) was not diagnosed as hippocampal sclerosis because of uncertainty about how it should be interpreted when present as a solitary feature. EEG data suggested a left temporal abnormality, and atrophy of the whole left hemisphere, including the temporal lobe, was also present. However, other findings were diffi-cult to interpret, and surgery is not contemplated at present.
All four diagnostic features were found to-gether in only 39% of cases (Table 3). If any one feature was taken on its own, the sensitivity of the diagnosis of hippocampal sclerosis would have been only 89% at best (Table 2). This reflects the fact that different features are more prominent in some cases than others, and may be due to heterogeneity within the pathologies that are interpreted as hippocampal sclerosis.
Temporal lobe resection with removal of me-dial structures or selective amygdalohippocam-pectomy was performed in 10 of the 25 patients in this series. Sufficient hippocampal material for diagnosis was available in six cases, and in all of those, the MR imaging diagnosis of hippocampal sclerosis was confirmed pathologically.
Discussion
The structural anatomy of the normal hippo-campus is shown by these imaging techniques (Fig. 2). This degree of detail allows the identifi-· cation of subtle degrees of pathology, and de-tailed noninvasive assessment of the normal hip-pocampus.
The hippocampus can be divided into three main parts (19); a head, a body, and a tail (Fig. 3). The hippocampal head (also known as the pes hippocampi indentatus) is the most anterior por-tion, and lies directly beneath the amygqala.thqt caps in anteriorly and superiorly. The hippocam~
[image:4.612.54.294.664.727.2]A
B
Fornix
Subiculum
Dentate gyrus
c
in the section in which the amygdala is no longer its immediate superior relation and it extends posteriorly to the hippocampal tail. The hippo-campal tail curves upward out of this plane to merge with the fornix in the midline posteriorly and superiorly (Fig. 3).
Hippocampal sclerosis, in keeping with the pathology literature, was the sole MR diagnosis in 64% of this outpatient series of 25 cases (2). Overall it was found in 72% of cases, which included two in which it was present on the side of significant other ipsilateral pathology
(foreign-Temporal horn of the
lateral ventricle
Hippocampal head
Hippocampal body
Fimbria
Hippocampal tail
Posterior horn of the
lateral ventricle
Fig. 3. A, Diagram of the normal an-atomical features of the hippocampal
for-mation as seen in the modified axial
im-aging plane, also showing its medial
anat-omy that projects superiorly out of this
plane.
8, The features of hippocampal
scle-rosis on Tl-weighted images (3500/26;
inversion time, 300 ms; section
thick-ness, 5 mm) are shown in the right
hip-pocampus (arrowheads). Compared with
the left hippocampus, it is small, with
abnormal signal in the head compared
with the body. The gray matter is thinner
than in the normal left hippocampus
throughout its length. The lateral
bound-ary of the hippocampus can be seen as
a thin white line which is the alveus.
C, Another example of pathologically
verified hippocampal sclerosis seen in the axial plane (3500/26; inversion time, 300
ms; section thickness, 5 mm). The
hip-pocampal head shows marked signal
hy-pointensity (anterior arrowhead) due to
the presence of extensive gliosis in this
region. Posteriorly, there is atrophy of
the hippocampal gray matter (posterior
arrowhead), although this is not as severe
as seen in the case shown in B. The most
prominent feature in this axial T
l-weighted image is the focal signal
hy-pointensity.
tissue lesions, and cortical dysplasia). The diag
-nosis of hippocampal sclerosis in two difficult cases, confirmed pathologically, relied on the additional criteria of loss of internal hippocampal morphologic structure and hypointensity on in
-version-recovery images.
[image:5.614.56.397.74.576.2]758 JACKSON
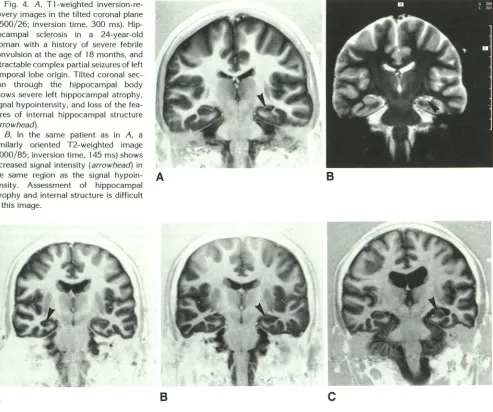
Fig. 4. A, T1-weighted inversion -re-covery images in the tilted coronal plane (3500/26; inversion time, 300 ms). Hip
-pocampal sclerosis in a 24-year-old woman with a history of severe febrile convulsion at the age of 18 months, and intractable complex partial seizures of left
temporal lobe origin. Tilted coronal
sec-tion through the hippocampal body
shows severe left hippocampal atrophy,
signal hypointensity, and loss of the fea-tures of internal hippocampal structure (arrowhead).
8, In the same patient as in A, a
similarly oriented T2-weighted image
(4000/85; inversion time, 145 ms) shows
increased signal intensity (arrowhead) in the same region as the signal hypoin- A
tensity. Assessment of hippocampal
atrophy and internal structure is difficult in this image.
A
B
AJNR: 14, May/June 1993
B
c
Fig. 5. A, Severe atrophy and marked signal hypointensity (arrowhead) is seen on a T1-weighted image (3500/26; inversion time, 300 ms; section thickness, 5 mm) in the right hippocampal body of an 18-year-old man with a history of febrile convulsions complicated
by left hemiparesis.
8, Signal abnormality on a T1-weighted image (3500/26; inversion time, 300 ms; section thickness, 5 mm) and loss of the normal internal structure of the hippocampus is seen in the left hippocampus of a 26-year-old patient with temporal lobe epilepsy (arrowhead).
Atrophy of this hippocampus was not reported.
C, An abnormal hippocampus on the left (arrowhead) showing loss of definition of internal structure without definite hippocampal
atrophy or signal change (3500/26; inversion time, 300 ms; section thickness, 5 mm). This was not diagnosed as hippocampal sclerosis,
but we interpret this as pathologic. Note that the temporal lobe on that side is also atrophic, as is the entire hemisphere (enlarged lateral ventricle). Surface EEGs suggested a left temporal focus (see text).
to make the pathologic diagnosis of hippocampal sclerosis can now be assessed by MR images optimized to display hippocampal morphology and tissue abnormalities.
There is a large gradation of pathologic abnor-mality that falls within the diagnostic category of
hippocampal sclerosis, from minor end-folium
gliosis to extensive gliosis and cell loss (20). The
more subtle degrees of hippocampal pathology
depend on the assessment of hippocampal atro-phy, gliosis, and neuronal cell loss in making a
final pathologic diagnosis. Similarly, the use of all four MR imaging criteria applied to different se-quences and optimally oriented axes enables hip-pocampal pathology to be diagnosed with maxi-mal sensitivity using MR imaging.
Altered Hippocampal Morphology
[image:6.612.63.556.81.493.2]A B
Normal hippocampal structure
_j
Cornu Ammonis
(pyramidal cell layer)
Dentate gyrus
(molecular cell layer)
Features of hippocampal sclerosis
(changes in internal morphological structure)
Loss of CA3 neurons. replacement gliosis
Enlarged temporal horn of the lateral ventricle
Preserved CA2 neurons Loss of pyramidal
cell neurons and ---:~~
c
DLo~s of CA 1 neurons,
replacement gliosis and volume loss
Fig. 6. A, The features of the normal hippocampal structure are shown on 5-mm thick Tl-weighted inversion-recovery images
(3500/26; inversion time, 300 ms; section thickness, 5 mm) oriented at right angles to the hippocampal body. The cornu ammonis is
seen as a layer of decreased Tl-weighted signal intensity (arrowheads), and the end folium can also be seen (arrow). The most clearly
seen layer of pyramidal cells is in the CA 1 and CA2 region and the end folium.
B, A diagram of this region shows the corresponding anatomical and histologic features of the region highlighted in A.
C, The features of hippocampal sclerosis (arrowhead) are identified in this Tl-weighted inversion-recovery image (3500/26; inversion time, 300 ms; section thickness, 5 mm). There is atrophy, Tl signal hypointensity, and loss of all of the internal features of the normal hippocampus.
D, The pathologic abnormalities of hippocampal sclerosis that these imaging changes represent are shown in diagrammatic form. The diagram corresponds to the region marked in C.
TABLE 3: Number of MR imaging features in each case diagnosed as
hippocampal sclerosis (n = 18)
Two features
Three features
Four features
5 6 7
%
27
33
39
as reported by nineteenth century pathologists in
autopsies of patients with epilepsy (2). Normal internal morphologic structure of the hippocam-pus is produced by the alveus, the molecular cell
layer of the dentate gyrus, and the pyramidal cell
[image:7.612.55.560.77.529.2] [image:7.612.52.300.680.734.2]760 JACKSON
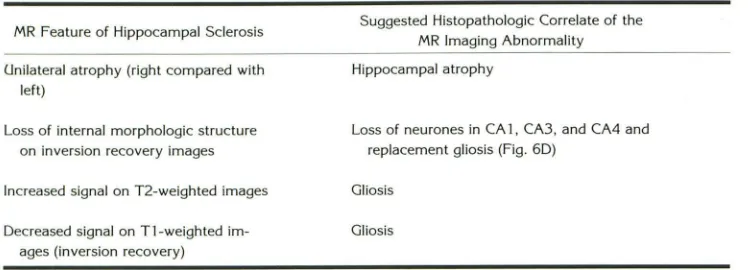
TABLE 4: Features of hippocampal sclerosis
MR Feature of Hippocampal Sclerosis
Unilateral atrophy (right compared with left)
Loss of internal morphologic structure on inversion recovery images
Increased signal on T2-weighted images
Decreased signal on Tl-weighted im -ages (inversion recovery)
In hippocampal sclerosis, the loss of this normal
internal structure is a consequence of neuronal cell loss and replacement of normal anatomical layers with gliotic tissue (Figs. 6C and 60).
Because of the large variation in normal size
(13, 15), atrophy may be accurately detected
only using the criterion of hippocampal asym-metry. Normal hippocampi were symmetrical as
assessed subjectively in the current study, and
by volumetric analysis in previous studies (15,
19). We found hippocampal atrophy in 83% of
patients with hippocampal sclerosis by careful
visual analysis of optimized images (Table 2).
This frequency is comparable to that reported
using volumetric techniques (12, 13). Accuracy
of quantitative volume measurements require analysis of contiguous thin sections oriented at right angles to the long axis of the hippocampus which were not acquired in the current study.
Bilateral hippocampal abnormalities are also
difficult to detect using atrophy as a sole criterion
because of the variation of normal size. Like our
qualitative visual method, reliable quantitative
volumetric techniques rely on the comparison of
the patient's two hippocampi ( 12). The use of
absolute volumetric criteria may lead to errors of lateralization ( 12, 13).
Atrophy was not diagnosed in three cases in
which signal change was present in the
hippo-campal gray matter. In two of these cases,
sub-sequent review showed areas of focal atrophy in
the hippocampal head that had not been detected
with certainty in the reporting process. This em-phasizes that the use of multiple criteria increases
the sensitivity of the diagnosis of hippocampal
sclerosis.
Loss of internal morphologic structure of the hippocampus has been identified in this study as
an MR imaging feature of hippocampal pathol-ogy. It is a sensitive sign of hippocampal sclerosis,
usually seen when atrophy is present, but we are
Suggested Histopathologic Correlate of the
MR Imaging Abnormality
Hippocampal atrophy
AJNR: 14, May/ June 1993
Loss of neurones in CA 1, CA3, and CA4 and replacement gliosis (Fig. 60)
Gliosis
Gliosis
uncertain whether it is sufficient for the diagnosis
in the absence of other features. However, we
suggest that a clearly visualized intact hippocam-pal internal structure is inconsistent with the diagnosis of hippocampal sclerosis.
Altered Hippocampal Signa/Intensity
For reliable diagnosis of hippocampal sclerosis,
a heavily T2-weighted image in the oblique cor
-onal imaging plane is helpful. Our experience suggests that an abnormal signal on T 1- or T2-weighted images arising from an atrophic hippo-campus always represents hippocampal sclerosis. An abnormal signal arising from an apparently
enlarged hippocampus may represent a hamar
-toma or glioma ( 11 ).
Increased T2-weighted signal when localized
imprecisely to the "mesial temporal region" may be caused by foreign tissue such as a glioma or
hamartoma, by gliotic tissue in the hippocampus,
by increased CSF in the atrophied region, by flow
artifacts, and occasionally by a developmental
cyst in tr-= hippocampal head stemming from failure of closure of the lateral aspect of the
hippocamj)al fissure (22). Careful determination
of the exact location of this signal change using
T1-weighted images to give clear anatomical de
-tail enables the correct diagnosis to be made. The MR imaging diagnosis that is based on all four diagnostic features of hippocampal sclerosis in optimized images is more sensitive than any
sin-gle feature, such as atrophy or T2-weighted signal
hyperintensity, taken on its own (Table 2).
For reasons discussed earlier, the frequency
with which increased signal on T2-weighted im
-ages is found in cases of hippocampal sclerosis has varied markedly between different series (4, 5, 7, 8, 10, 11 ). We have found hyperintensity
on T2-weighted images by visual grading in 77%
[image:8.612.123.497.92.227.2]prev-alence of abnormal T2 relaxation time in hippo-campal sclerosis by T2 relaxometry (23).
We report in this paper the finding of decreased hippocampal signal on Tl-weighted images, seen on inversion-recovery images, in 83% of cases of hippocampal sclerosis. We have found this de-creased signal on Tl-weighted images to be at least as important as increased signal on T2-weighted images in making the diagnosis of hip-pocampal sclerosis, particularly in defining the posterior extent of gliosis in oblique axial images,
and it is often easier to appreciate than the signal hyperintensity on T2-weighted images. Such sig-nal hypointensity on Tl-weighted images in the hippocampal gray matter on high-contrast inver-sion recovery imaging is not easily detectable in the Tl-weighted images obtained from a short TR spin-echo sequence or fast volume acquisition technique. This is because the inversion-recovery sequence provides better Tl contrast than the latter two methods. The adoption of an imaging plane that minimizes partial volume seen in con-ventionally oriented images (approximately 35° to the hippocampus) also maximizes tissue con -trast.
Decreased signal on Tl-weighted images and increased hippocampal signal on T2-weighted im-ages are characteristic of gliosis, both in human postmortem material (our unpublished data), and in animal models (24).
Correlation with Pathology and Site of Seizure Origin
The assessment of the cross-sectional size of the hippocampus must be made in images ob-tained in the modified coronal axis that transects the hippocampus at right angles. It has been shown that a smaller hippocampus as detected in this plane, either qualitatively or by quantitative
methods, reliably predicts the side of the epilep-togenic focus in the case of temporal lobe epi
-lepsy (8, 1 0-14), but that absolute measures of hippocampal size must be interpreted with cau
-tion (12, 13, 25). Whenever adequate hippocam-pal histopathology has been available (51 of 81 temporal lobectomy cases previously reported (11), and six of the current 25 outpatient cases), the hippocampal abnormalities that were ide nti-fied by MR imaging have been shown by pathol
-ogy to be caused by hippocampal sclerosis. F ur-thermore, the MR imaging abnormality in all but one of the previous series of 81 temporal lob
ec-tomy cases, and in all of our current series of 25
outpatient cases, correlated with the epile pto-genic temporal lobe. This was judged by the side
of temporal lobectomy, or by the consensus di -agnosis of two independent neurologists based on all available information but blind to the MR imaging data.
Conclusion
Hippocampal sclerosis may be diagnosed with MR, but the sensitivity of this diagnosis, the MR criteria by which this diagnosis is made, and the
necessity for volumetric techniques is still contro-versial. We report a qualitative technique and diagnostic features that enable hippocampal pa-thology to be diagnosed in virtually all cases.
The technique reported in this paper relies partly on inversion-recovery images. Although it takes 7.5 minutes, this sequence provides impor-tant diagnostic information that is not easily seen using fast gradient-echo techniques or Tl weighted spin-echo sequences. Intractable te m-poral lobe epilepsy is a common problem, and hippocampal pathology is the most frequent un-derlying abnormality. Images that can be pro-vided by standard MR imaging systems enable
accurate qualitative assessment of hippocampal pathology.
We propose that altered hippocampal signal intensity (on Tl and/or T2 weighted images) and altered hippocampal morphology (atrophy and/
or loss of internal structure) constitute the MR diagnostic features of hippocampal sclerosis. We
have focused this study on outpatients, and re -port MR techniques and diagnostic criteria that any center with an MR facility can adopt without needing to develop new quantitative methods of analysis.
The diagnosis of hippocampal sclerosis is im
-portant to a patient with intractable epilepsy who is being considered for epilepsy surgery. The most sensitive and specific technique should be
used (26), as the reliable noninvasive diagnosis of hippocampal sclerosis may speed up the assess -ment process for patients undergoing epilepsy surgery, and provide evidence of pathology to
support the decision to offer surgery.
Acknowledgments
762 JACKSON
References
1. Mathieson G. Pathology of temporal lobe foci. In: Penry JK, Daly DD, eds. Complex partial seizures and their treatment. New York: Raven Press, 1975:163-185
2. Babb TL, Brown WJ. Pathological findings in epilepsy. In: Engel J Jr, ed. Surgical treatment of the epilepsies. New York: Raven Press, 1987:511-540
3. Bruton CJ. The neuropathology of temporal lobe epilepsy. Oxford,
UK: Oxford University Press, 1988:1-158
4. Sperling MR, Wilson C, Engel J Jr, et al. Magnetic resonance imaging in intractable partial epilepsy: correlative studies. Ann Neural 1986; 20:57-62
5. Ormson MJ, Kispert DB, Sharbrough FW, et al. Cryptic structural lesions in refractory partial epilepsy: MR imaging and CT studies. Radiology 1986;160:215-219
6. Bergen D, Bleck T, Ramsey R, et al. Magnetic resonance imaging as a sensitive and specific predictor of neoplasms removed for intrac-table epilepsy. Epilepsia 1989;30:318-321
7. Brooks BS, King DW, Elgammal T. MR imaging in patients with
intractable complex partial epileptic seizures. AJNR: Am J Neurora-diol 1990; 11 :93-99
8. Kuzniecky R, de Ia Sayette V, Ethier R, et al. Magnetic resonance imaging in temporal lobe epilepsy: pathological correlations. Ann Neurol1987;22:341-347
9. Engel J Jr. Localization of the epileptogenic lesion. In: Engel J Jr, ed. Surgical treatment of the epilepsies. New York: Raven Press, 1987:6
10. Bronen RA, Cheung G, Charles JT, et al. Imaging findings in hipp o-campal sclerosis: correlation with pathology. AJNR: Am J Neuroradiol
1991;12:933-940
11. Jackson GD, Berkovic SF, Tress BM, Kalnins RM, Fabinyi G, Bladin PF. Hippocampal sclerosis can be reliably detected by magnetic
resonance imaging. Neurology 1990;40: 1869-1875
12. Jack CR, Sharbrough FW, Twomey CK, et al. Temporal lobe seizures: lateralization with MR volume measurements of the hippocampal formation. Radiology 1990; 175:423-429
13. Ashtari M, Barr WB, Schaul N, Bogerts B. Three-dimensional fast low-angle shot imaging and computerized volume measurement of
AJNR: 14, May/June 1993
the hippocampus in patients with chronic epilepsy of the temporal lobe. AJNR: Am J Neuroradiol1991;12:941-947
14. Berkovic SF, Andermann F, Olivier A, et al. Hippocampal sclerosis in temporal lobe epilepsy demonstrated by magnetic resonance imaging. Ann Neural 1991 ;29: 175-182
15. Naidich TP, Daniels DL, Haughton VM, Williams A, Pojunas K, Palacios E. Hippocampal formation and related structures of the
limbic lobe: anatomic-MR correlation. I. Surface features and coronal
sections. Radiology 1987;162:747-754
16. Press GA, Amaral DG, Squire LR. Hippocampal abnormalities in amnesic patients revealed by high resolution magnetic resonance imaging. Nature 1989;341 :54-57
17. Finn JP, Connelly A, Atkinson D. A modified inversion recovery sequence for routine high contrast brain imaging (abstr). In: Book of abstracts: Society of Magnetic Resonance in Medicine, 1989. Berk e-ley, CA: Society of Magnetic Resonance in Medicine, 1989:722 18. Jack CR, Twomey CK, Zinsmeister AR, Sharbrough FW, Petersen
RC, Cascino GD. Anterior temporal lobes and hippocampal forma-tions: normative volumetric measurements from MR images in young adults. Radiology 1989; 172:549-554
19. Duvernay HM. The human hippocampus. Munich: JF Bergmann
Verlag, 1988:1-153
20. Margerison JH, Corsellis JAN. Epilepsy and the temporal lobes. Brain
1966;89:499-530
21. Meldrum BS, Corsellis JAN. Epilepsy. In: Adams JH, Corsellis JAN,
Duchen LW, eds. Greenfields neuropathology. London: Edward
Ar-nold, 1984:921-950
22. Bronen RA, Cheung G. MRI of the normal hippocampus. Magn Reson Imaging 1991;9:497-500
23. Jackson GD, Duncan JS, Connelly A, Austin SJ. Increased signal in the mesial temporal region on T2 weighted MRI; a quantitative study of hippocampal sclerosis. Neurology 1991;41(suppl1):170-171
24. Barnes D, McDonald WI, Landon DN, Johnson G. The characterization
of experimental gliosis by quantitative nuclear magnetic resonance imaging. Brain 1988; 111 :83-94
25. Morell F. In vivo imaging of human anatomy in temporal lobe
[image:10.614.309.555.76.474.2]