MR Quantitation of Volume and Diffusion
Changes in the Developing Brain
Lijuan Zhang, Kathleen M. Thomas, Matthew C. Davidson, B. J. Casey, Linda A. Heier, and Aziz M. Ulug˘
BACKGROUND AND PURPOSE: Brain volume and diffusion change during maturation. Quantitation of these changes may be helpful in understanding normal brain development. We used diffusion-weighted imaging to characterize the volumetric and diffusion changesin vivo. METHODS: We recruited 30 pediatric volunteers (aged 1 month–17 years; 14 male, 16 female). Diffusion was measured in three orthogonal directions with abvalue of 1000 s/mm2. The diffusion parameters from the entire brain were calculated and fitted to a triple gaussian model. In addition, region-of-interest measurements were made in caudate, thalamus, genu and splenium of the corpus callosum, and periventricular white matter (PVWM). The brain volume was measured by counting pixels and by using the model.
RESULTS:Water diffusion of the whole brain, caudate, thalamus, genu and splenium of the corpus callosum, and PVWM decreased during maturation, with the most significant change within the first 2 years. Robust negative correlations were found between age and the measured average diffusion constant (Dav) values in each of the measured locations (P< .005). Volumes
of different cerebral compartments and the total intracranial volume (ICV) increased rapidly during the first 2 years of life and then had a slower growth process through adolescence. Age was correlated with the ICV and the volume of each brain compartment (P< .005).
CONCLUSION: Brain diffusion decreases and brain volume increases during maturation, with the most significant changes occurring within the first 2 years of life. The brain model used in this study provides a good estimate of the increasing brain volume.
The human brain changes substantially during matu-ration. Previous studies have shown that cell numbers increase and water content decreases in the whole brain, forebrain, and brainstem during prenatal de-velopment to 8 years of age (1). The rapid decrease in water content is considered a good marker for brain development (1, 2). Quantifying these changes on MR imaging may improve our understanding of nor-mal brain development. Disorders of metabolism or malnutrition may be especially vulnerable to impair-ment in water content; thus, this imaging may help in the early diagnosis of these diseases. Diffusion imag-ing is a relatively new technique that has been used to
noninvasively measure brain water diffusivity in both white matter and gray matter during development (3–11). Previous diffusion imaging studies have shown that brain diffusion decreases during the first decade of life in both gray matter and white matter (4, 7) and that it remains relatively constant throughout adulthood (12).
Brain volume measurement is of neurologic and neuropsychiatric importance in evaluating disorders of development and degeneration (13, 14). It has been reported that human brain volume peaks at approximately 19 years of age and then declines by 1.3–1.6% per decade of life (14). The purpose of our study was to examine diffusion changes in the devel-oping brain in conjunction with volume changes by measuring the diffusion parameters and fitting these to a brain model (4, 12). Intracranial volume (ICV) was calculated by counting pixels and by using the model.
Methods
Thirty children (aged 0.01–17 years; 14 male, 16 female) were included in this study. The subjects were either healthy volunteers or patients undergoing imaging for clinical reasons excluding the assessment of developmental delay. MR images Received November 21, 2003; accepted after revision April 16,
2004.
From the Department of Radiology (L.Z., L.A.H., A.M.U.) and the Sackler Institute for Developmental Psychobiology (K.M.T., M.C.D., B.J.C., A.M.U.), Weill Medical College of Cornell Uni-versity, New York, NY.
Supported in part by grants National Institute for Child Health and Human Development R03-HD39796 and National Institute for Mental Health R01-MH63255.
Address reprint requests to Aziz M. Ulug˘, PhD, Department of Radiology, Box 141, Weill Medical College of Cornell University, 1300 York Avenue, New York, NY 10021.
©American Society of Neuroradiology
of all subjects were normal. This group included 11 subjects from a previous study (4). The ages of the male and female subjects were not significantly different.
Imaging was performed with a 1.5-T commercial MR ma-chine with a quadrature head coil. The imaging protocol in-cluded sagittal and axial T1-weighted images (TR/TE, 500/ minimum); axial T2-weighted images (4000/102), axial fluid-attenuated inversion recovery images (TR/TE/TI, 10000/162/ 2200; matrix, 256⫻192), and diffusion-weighted images (TR/ TE, 10,500/minimum; image matrix, 256 ⫻ 256; section thickness, 5 mm; field of view, 220 mm).
Diffusion was measured in three orthogonal directions with b⫽1000 s/mm2. An additional set of images (S
o) was obtained
with no diffusion weighting. An orientation-independent diffu-sion image related to the trace of the diffudiffu-sion tensor was obtained as follows: DWItrace⫽3公DWIxDWIyDWIz. Maps of
the average diffusion constant (Dav) were calculated by using
the DWItrace and So images by using this equation: Dav ⫽ (1/b)log(So/DWItrace).
A computer program was used to calculate diffusion distri-bution histograms (Fig 1) with a bin width of 0.02⫻10⫺5cm2/s.
This histogram was fitted to a triple gaussian curve by using commercial software. This curve was given byC1exp{⫺[(Dav⫺
BDav)/]2}⫹C2exp{⫺[(Dav⫺D2)/2]2}⫹C3exp{⫺[(Dav⫺
D3)/3]2}, whereBDavis the diffusion constant for the whole
brain. The curve represented a brain model with three com-partments: 1) brain tissue compartment, 2) compartment of brain tissue mixed with CSF, 3) high-diffusion compartment of CSF and non-brain tissue. The mean of the brain tissue com-partment was recognized as a mean diffusion constant for the whole brain BDav. The details of this model were reported
previously (4, 10). A representative histogram fitted to the triple gaussian model is shown in Figure 1. Using the region-of-interest (ROI) analysis, we also measuredDavin the bilat-eral caudate, thalamus, genu and splenium of the corpus cal-losum, and periventricular white matter (PVWM) (Fig 2).
For each subject, total ICV was calculated by multiplying the individual pixel volume by the number of pixels in the brain. The brain model was also used to calculate the individual brain compartments by analytically integrating the model function for each of the three compartments. The volume of each compartment wasCii公multiplied by the pixel volume. In this way, the volume of different brain compartments could be calculated without segmenting the images. The measured dif-fusion parameters were plotted against age and fitted to a
double exponential curve:m1exp(⫺m2age)⫹m3exp(⫺m4age)
⫹m5, wheremiare the fitted parameters. The measured ICV and compartmental volumes were plotted against age.
Pearson product correlation and the Studentttest were used for statistical analysis. P ⬍.05 was used as the significance level.
Results
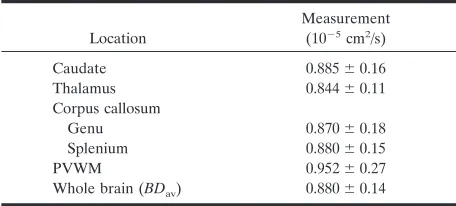
The average Dav values measured in the entire population are summarized in Table 1. Water diffu-sion of the whole brain (BDav), caudate, thalamus, genu, splenium of the corpus callosum, and PVWM decreased during maturation, with the most signifi-cant change within the first 2 years (Table 2, Fig 3). Robust negative correlations were found between age and measuredDavvalues in all of the anatomic loca-tions evaluated (P⬍ .01).
When the subjects were grouped and compared according to sex, no diffusion difference were ob-served between boys and girls, and no age difference was noted between the groups.
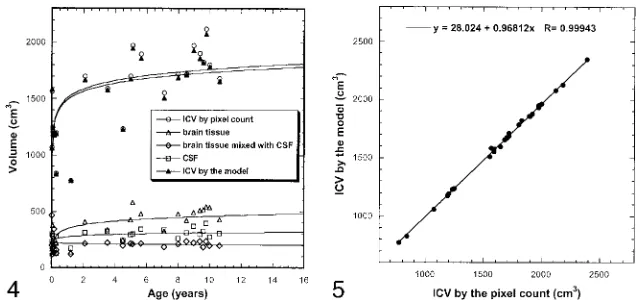
The average ICV measured by means of pixel counting and the brain model was 1639 and 1614 cm3, respectively (Table 3). Volume changes during maturation were fitted to a logarithmic function. The volumes of different cerebral compartments and total ICV increased rapidly during the first 2 years of life; this change was followed by a slower growing process through adolescence (Table 4, Fig 4). A robust positive correlation was found between the volume measurement based on a simple pixel count and the volume calculated from the brain model (R ⫽ 0.999, P ⬍ .001) (Fig 5). Age was robustly correlated to the volume of the three com-partments and the ICV (P ⬍ .001).
When the subjects’ brains were analyzed according to sex, ICV was significantly larger in boys than in girls (P⬍ .05), with an average ICV of 1803 ⫾ 441 cm3in boys compared with 1495⫾327 cm3in girls, as measured by using the pixel count. There was no statistically significant volume difference in the brain tissue compartment between boys and girls (P⬎ .2), although the average brain tissue compartment of the boys was 741 ⫾161 cm3, which was 15% higher than the 627 ⫾116 cm3found in girls.
Discussion
In this study, we determined the diffusion and vol-ume changes during brain development in children by using quantitative diffusion imaging and a mathemat-ical model. Diffusion analysis showed that diffusion values decrease in both the gray matter and white matter of the brain during maturation. The greatest diffusion changes occurred within the first 2 years after birth, when a large drop in the water content of the brain tissue occurs (1). The biexponential age-dependent diffusion decay is consistent with previous quantitative autopsy brain measurements (1), brain water content, and results of other diffusion studies (8 –10, 13). Many mechanisms are thought to contrib-ute to decreased diffusion. These mechanisms in-FIG 1. Representative diffusion distribution histogram in a
clude increased intercellular tortuousity; new mem-brane-barrier formation as a result of myelination and the formation of new axons, dendrites, and glial cells; and an increase in macromolecular con-centrations (2– 6).
The correlations betweenDavvalues and age in the measured areas were all robust, indicating that the water content changes throughout the maturation process in these areas were parallel in pattern, al-though they were possibly different in magnitude.
In the splenium of the corpus callosum, the mea-sured Dav was 0.880 ⫾ 0.147 (10⫺
5
cm2/s), which is comparable that described in previous reports (10, 14). Previous work in adults has shown that the sple-nium has higher anisotropy (8, 15) and higher Dav (15) than the rest of the corpus callosum. There was no difference in Dav between the splenium and the genu in this study (P⬎.05). The ongoing diffusional development of the corpus callosum may be the rea-son for this finding. A larger sample size could im-prove recognition of the diffusion characteristics of the corpus callosum.
The PVWM had the highestDavvalue. This might have been due to the inadvertent inclusion of CSF in the ROI close to ventricles. CSF-suppressed diffu-sion-weighted imaging may enable better diffusion characterization in the regions close to the ventricles (15, 16).
When we compared the biexponential decrease of diffusion from Table 2 with data from our previous study (Table 1 of reference 4), the slower component of diffusional change from both studies agree well with each other. However, there is a considerable difference in the fast component, which is dominant before age 2. This observation suggests that a larger data set with more subjects younger than 2 years is necessary for more accurate description of diffusion at this early age.
Previous studies revealed that the ICV varies from 1300 to 2000 cm3at full growth (17). The average ICV measured by using the pixel count and brain model in this study were 1639 and 1614 cm3, respectively. ICV increased from 0.01 to 17 years with a sharper in-crease during the first 2 years. These findings are in agreement with those of previous studies (12, 17–20). In our study, pixels from the extracranial tissue might have affected the volume measurement during auto-matic data processing. However, the curve of volume change can still serve as a guideline for estimating brain volume.
In this study, the average ICV for boys and girls was 1803 and 1495 cm3, respectively, by pixel count. Sta-tistically, ICV was larger in the boys than in the girls (P⬍.05), similar to previously reported findings (17, 19). However, the volume difference in the brain tissue compartment was not significantly different be-tween boys and girls.
Many factors can affect brain growth and shrink-age. Examples include nutritional status, delivery complications, stressful life events, psychiatric or neu-rologic disorders, Alzheimer disease, and endocrine diseases such as Cushing disease (21, 22). Evidence about reductions in brain volume following child abuse and neglect has also been outlined (23). The brain modeling in this study may provide good esti-mates in disorders related to brain development, in-cluding the neurologic aftermath of brain trauma, mood disorders, and child abuse.
FIG 2. Locations of ROIs in a 2-year-old boy. Round ROIs were placed onDavmaps to measure the diffusion constants of the PVWM,
[image:3.585.56.535.59.239.2]caudate, thalamus, and genu and splenium of the corpus callosum in all subjects.
TABLE 1: Mean diffusion measurements in all subjects
Location
Measurement (10⫺5cm2/s)
Caudate 0.885⫾0.16
Thalamus 0.844⫾0.11
Corpus callosum
Genu 0.870⫾0.18
Splenium 0.880⫾0.15
PVWM 0.952⫾0.27
Whole brain (BDav) 0.880⫾0.14
[image:3.585.54.282.297.400.2]FIG 3. Biexponential curves ofDavversus age. A, Caudate and splenium of the corpus callosum.
B, Thalamus, PVWM, and whole brain (BDav).
C, Data for the genu are fitted by using a single exponential curve. Brain diffusion decreases fastest in the first 2 years, with slower changes afterward.
FIG 4. Age dependence of brain volume. The most significant volume changes oc-cur within the first 2 postnatal years. Lines are the logarithmic fit.
[image:4.585.54.535.70.164.2]FIG 5. ICV measured by using the pixel count and the brain model. Correlation was excellent (R⫽0.999).
TABLE 2: Age-dependent diffusion changes for the study subjects
Location Dav(10⫺
5cm2/second) R
Thalamus Dav⫽0.239 exp(⫺4.072⫻age)⫹0.0123 exp(⫺0.0821⫻age)⫹0.724 0.920
PVWM Dav⫽0.527 exp(⫺2.301⫻age)⫹0.212 exp(⫺0.221⫻age)⫹0.771 0.942
Whole brain (BDav) BDav⫽0.251 exp(⫺1.139⫻age)⫹0.157 exp(⫺0.102⫻age)⫹0.732 0.959
Caudate Dav⫽0.241 exp(⫺1.583⫻age)⫹0.201 exp(⫺0.243⫻age)⫹0.704 0.921
Corpus callosum
Genu* D
av⫽0.431 exp(⫺0.608⫻age)⫹0.748 0.912
Splenium Dav⫽0.398 exp(⫺1.490⫻age)⫹0.061 exp(⫺0.0209⫻age)⫹0.743 0.929
Note.—Subjects’ age range was 0.01–17 years.
[image:4.585.55.535.202.375.2]*Single exponential decay describes the age dependency of diffusion changes in the genu of the corpus callosum.
TABLE 3: Summary of ICV and compartmental volumes
Volume Boys Girls Average Increase
(%)* PValue
By pixel count
ICV 1803 1495 1639 17 .03
By the model
Brain tissue 741 628 681 15 .23
CSF and brain tissue 460 355 404 23 .03
CSF 574 491 530 14 .09
ICV 1775 1474 1614 17 .03
*In boys versus girls.
TABLE 4: Age dependent volume of the study subjects
Volume or
Compartment Volume (cm3) R
ICV
By pixel count V⫽1510⫹252 log(age) 0.680 By the model V⫽1492⫹242 log(age) 0.671 Brain tissue V⫽348⫹111 log(age) 0.773 Brain tissue and CSF V⫽218⫺11 log(age) 0.159*
CSF V⫽276⫹36 log(age) 0.548
Note.—Subjects’ age range was 0.01–17 years.
[image:4.585.55.284.445.548.2] [image:4.585.215.535.585.735.2]Conclusion
This study was a combined investigation of dif-fusion and volumetric changes of the developing brain. The brain model used herein provided a good estimate of brain growth, which may be help-ful for in vivo monitoring of the brain without a need for segmentation.
References
1. Dobbing J, Sands J.Quantitative growth and development of hu-man brain.Arch Dis Childhood1973;48:757–767
2. Smart JL, Dobbing J. Vulnerability of developing brain, IX: the effect of nutritional growth retardation on the timing of the brain growth-spurt.Biol Neonate1971;19:363–378
3. Normura O, Sakuma H, Takeda K, Tagami T, Okuda Y, Nakagawa T.Diffusional anisotropy of the human brain assessed with diffu-sion weighted MR: Relation with normal brain development and aging.AJNR Am J Neuroradiol1994;15:231–238
4. Ulug˘ AM.Monitoring brain development with quantitative diffu-sion imaging.Dev Sci2002;5:286 –292
5. Huppi PS, Maier SE, Eeled S, et al.Microstructural development of human newborn cerebral white matter assessed in vivo by dif-fusion tensor magnetic resonance imaging.Pediatr Res 1998;44: 584 –590
6. Barkovich AJ, Kjos BO, Jackson DE Jr, Norman D.Normal brain maturation of the neonatal and infant brain: MR imaging at 1.5T.
Radiology1988;166:173–180
7. Chepuri NB, Yen YF, Brudette JH, Li H, Moody DM, Maldjian JA. Diffusion anisotropy in the corpus callosum. AJNR Am J Neuroradiol2002;23:803– 808
8. Mukherjee P, Miller JH,. Shimony JS, et al.Diffusion-tensor MR imaging of gray and white matter development during normal human brain maturation. AJNR Am J Neuroradiol 2002;23: 1445–1456
9. Morriss MC, Zimmerman RA, Bilaniuk LT, Hunter JV, Hasel-grove JC.Paediatric neuroradiology: changes in brain water diffu-sion during childhood.Neuroradiology1999;41:929 –924
10. Chun T, Filippi CG, Zimmerman RD, Ulug AM.Diffusion changes
in the aging human brain. AJNR Am J Neuroradiol 2000;21: 1078 –1083
11. Peterson BS, Vohr B, Staib LH, et al. Regional brain volume abnormalities and long term cognitive outcome in preterm infants.
JAMA2000;284:1939 –1947
12. Kumra S, Giedd JN, Vaituzis AC, et al.Childhood onset psychotic disorders: magnetic resonance imaging of volumetric differences in brain structure.Am J Psychiatry2000;157:1467–1474
13. Schmithorst VJ, Wilke M, Dardzinski BJ, Holland SK.Correlations of white matter diffusivity and anisotropy with age during child-hood and adolescence: a cross-sectional diffusion-tensor MR im-aging study.Radiology2002;222:212–218
14. Ulug˘ AM, van Zijl PC.Orientation-independent diffusion imaging without tensor diagonalization: anisotropy definitions based on physical attributes of the diffusion ellipsoid.J Magn Reson Imaging 1999;9:804 – 813
15. Kwong KK, McKinstry RC, Chien D, Crawley AP, Pearlman JD, Rosen BR.CSF-suppressed quantitative single shot diffusion im-aging.Magn Reson Med1991;21:157–163
16. Falconer JC, Narayana PA.Cerebrospinal fluid suppressed high resolution diffusion imaging of the human brain.Magn Reson Med 1997;37:119 –123
17. Sgouros S, Goldin JH, Hockley AD, Wake MJ, Natarajan K.
Intracranial volume change in childhood.J Neurosurg1999;91: 610 – 616
18. Ja¨ncke L, Staiger JF, Schlaug G, Huang YX, Steinmetz H.The relationship between corpus callosum size and forebrain volume.
Cerebral Cortex1997;7:48 –56
19. Caviness VS, Kennedy DN, Richelme C, Rademacher J, Filipek PA.The human brain age 1–11 years: a volumetric analysis based on magnetic resonance images.Cereb Cortex1996;6:726 –736 20. Courchesne E, Chisum HJ, Townsend J, et al.Normal brain
devel-opment and aging: quantitative analysis at in vivo MR imaging in healthy volunteers.Radiology2000;216:672– 682
21. Knutson B, Momenan R, Rawlings RR, Fong GW, Hommer D.
Negative association of neuroticism with brain volume ratio in healthy humans.Biol Psychiatry2001;50:685– 690
22. Simmons NE, Do HM, Lipper MH, Laws ER Jr.Cerebral atrophy in Cushing’s disease.Surg Neurol2000;53:72–76