Animals naturally locomote using a variety of methods in the field. Sometimes the behavior is very brief and sometimes it lasts for long periods. The intensity of these behaviors also varies. Until recently, the energetic costs associated with both short- and long-duration behaviors were often assumed to be the same. In 1998, however, we showed (Baker and Gleeson, 1998) that the energetic expenditure per unit distance traveled for brief activity was much higher than traditional estimates derived from long-duration activity (Taylor et al., 1970; Tucker, 1970; Schmidt-Nielsen, 1972). For example, Taylor et al. (Taylor et al., 1970) ran animals at sustainable speeds for long periods to calculate the minimum cost of running (Mrun), which represented the energetic cost of running for 10 min or more. However, when we ran mice for a minute or less, the
costs of activity were 15–275 times higher than Mrun. The principal causes of this difference were the inclusion and relative magnitude of the excess post-exercise oxygen consumption (EPOC; Gaesser and Brooks, 1984) that occurs immediately following vigorous activity. Other authors have also illustrated that Mrun generally underestimates the actual cost of running when the oxygen consumed during recovery is not considered. For example, when an animal’s rate of oxygen consumption never attains steady-state conditions even though exercise duration is long (Full and Herreid, 1984) and in the more common cases where exercise duration is brief and steady-state conditions are not assumed to be met (Scholnick and Gleeson, 2000), Mrundoes not accurately reflect the actual energetic cost of moving about.
JEB3122
Previous research has shown that the energetic expense per unit distance traveled for one bout of short-duration activity is much greater than the energetic expense associated with long-duration activity. However, animals are often seen moving intermittently, with these behaviors characterized by brief bouts of activity interspersed with brief pauses. We hypothesized that, when multiple bouts of brief activity are performed intermittently, the energetic cost per unit distance is less than when only one short bout is performed. Mice were run 1, 2, 3, 5, 9 or 13 times for 15 s at their maximal speed within a 375 s period while enclosed in an open-flow respirometry system on a treadmill. The mice were also run continuously for 375 s. Following the last sprint and the continuous run, the mice remained in the respirometry chamber until their V.O∑∑
reached resting levels. Excess exercise oxygen consumption (EEOC), the excess volume of oxygen consumed during the exercise period, increased from 0.03±0.01 to 0.40±0.02 ml O2g−1(mean ±S.E.M., N=9) with activity frequency. However, the excess post-exercise oxygen consumption (EPOC), or volume of oxygen consumed during the recovery period, was independent of activity frequency (range 0.91–1.16 ml O2g−1) and
accounted for more than 80 % of the total metabolic cost when activity was performed intermittently. Lactate concentration was measured at rest, immediately after running and immediately after recovering from running 1, 5 and 13 times within the 375 s period. After running, [lactate] was significantly higher than resting values, but following recovery, [lactate] had reached resting values. The net cost of activity, Cact, calculated by summing
EEOC and EPOC and then dividing by the distance run, decreased significantly from 132±38 to 6±1 ml O2g−1km−1
as activity frequency increased. When these values for Cact were compared with the cost of running
continuously for the same amount of time, the values were identical. Therefore, we conclude that animals can minimize energetic expenditure by performing brief behaviors more frequently, just as they can minimize these costs if they increase the duration of continuous behaviors.
Key words: intermittent activity, exercise, locomotion, oxygen consumption, energetics, cost of activity, mouse, Mus domesticus, lactate.
Summary
Introduction
CAN ENERGETIC EXPENDITURE BE MINIMIZED BY PERFORMING ACTIVITY
INTERMITTENTLY?
EMILY BAKER EDWARDS* ANDTODD T. GLEESON
Department of Environmental, Population and Organismic Biology, University of Colorado, Boulder, CO 80309-0334, USA
*Present address: Department of Kinesiology and Applied Physiology, University of Colorado, Boulder, CO 80309-0354, USA (e-mail: bakerej@ucsu.colorado.edu)
As a result of the data from our two previous papers (Baker and Gleeson, 1998; Baker and Gleeson, 1999), we concluded that short-duration behaviors are more costly than previously thought. This higher cost results from including EPOC when calculating energetic expenditure. In both studies, EPOC accounted for more than 90 % of the total energetic expenditure. Therefore, the energetic costs associated with brief bouts of activity are high because a majority of the oxygen consumed as a result of brief activity occurs during the recovery period. Since our estimates of cost were so high, we concluded that the cost associated with one bout of brief activity was too great for a small animal such as a mouse to incur repeatedly during a day, and that animals must perform multiple bouts of activity in a way that causes the energetic expenditure to be less than we had calculated for one bout of brief activity. Since animals in nature are often observed moving intermittently, we hypothesized that intermittent activity may result in an improved locomotor capacity as demonstrated by a lower energetic cost per unit distance run compared with a single, discrete bout of behavior. This intermittent behavior is characterized by brief periods of activity interspersed with brief pauses, with these pauses being short and not long enough for the animals to recover completely (Kenagy and Hoyt, 1989; Weinstein, 1995; McAdam and Kramer, 1998). In support of our hypothesis, Weinstein and Full (Weinstein and Full, 1992) reported that, depending on the frequency of relatively brief behavior, the endurance of ghost crabs Ocypode quadrata could be changed. When compared with continuous activity, intermittent activity was able to increase the distance traveled by the crabs. Thus, intermittent behaviors improved the locomotor capacity of this ectotherm.
In the present study, laboratory mice were run on a motor-driven treadmill at various frequencies while oxygen consumption was measured. Activity intensity was held constant by requiring animals to sprint maximally for 15 s. To vary activity frequency, the mice were run 1, 2, 3, 5, 9 or 13 times during a period of 375 s. For comparison, the mice also were run continuously for 375 s. Whole-body lactate concentrations were also measured to determine whether the energetic costs associated with anaerobic glycolysis were completely accounted for when recovery was complete. We found that lactate concentration increased with the number of times the mice were run, but removal rates were rapid, such that net lactate accumulation did not contribute significantly to the net energetic cost estimates. We have used these data to determine the effect of activity frequency on oxygen consumption and the resulting net cost of activity. We found that the EPOC volume was independent of exercise frequency, but accounted for a majority of the oxygen consumed. Consequently, the energetic cost of activity (cost per unit distance traveled) decreased as exercise frequency increased. When the energetic cost of running for a given amount of time intermittently was compared with that for running continuously for the sum of those times, the values were nearly identical. Thus, animals can minimize energetic expenditure by performing activity at greater frequencies, just as they can
decrease the cost by performing continuous exercise for longer durations.
Materials and methods Protocol
Nine female white laboratory mice Mus domesticus (L.) from an out-bred stock (CF-1; Sasco, Inc.) were used. The animals were ear-punched for identification and were kept four or five per cage with food and water available ad libitum. They did not have access to a running wheel or other form of exercise. The mice were maintained on a 12 h:12 h light:dark photoperiod, and all experiments were performed during the light phase. The mice weighed 28.3±0.7 g at the start of the study and had increased significantly in mass to 33.6±0.8 g after 6 months (means ± S.E.M.). An analysis of variance (ANOVA) confirmed that the increase in body mass did not significantly affect the rate of oxygen consumption during 15 s of exercise. The animal protocol was reviewed and approved by the University of Colorado’s Animal Care and Use Committee.
To determine the effect of activity frequency on the energetic cost of activity, each mouse was fasted for 12 h and then transferred to an open-flow respirometry chamber. The respirometry chamber was a 4 cm×4.5 cm×15.5 cm Plexiglas open-bottomed chamber set on the treadmill surface. Air was drawn from around the bottom of the chamber and through an opening at the back of the chamber at 700 ml min−1 (STPD) during rest and recovery or at 1400 ml min−1(STPD) during and immediately following exercise.
Animals were rested in the respirometry chamber for 1–2 h before being run. Before one of the runs, the animal was rested for 3 h so that a resting metabolic rate could be determined for each mouse. Once the animal was rested, treadmill speed was increased to each individual’s maximum sprint speed for 15 s, which was repeated at different frequencies. Within a 375 s period, the mice were run for 15 s once, twice, three, five, nine or thirteen times, with varying rest periods between each run (Fig. 1). The mice were also run constantly for 375 s at the maximum speed they could maintain. Following each run protocol, the mouse rested in the respirometry chamber for 60 min to determine the oxygen consumed during recovery. During the rest and recovery periods, the chamber was covered so that visual and auditory disturbances were minimized.
Measurement of oxygen consumption
for the analysis system to detect a full-scale change in oxygen concentration in the chamber was 1.5 s. Carbon dioxide was absorbed from the excurrent air using Ascarite. Rates of oxygen consumption were calculated using equation 4a of Withers (Withers, 1977), following a correction for instantaneous estimates of oxygen concentration (see Bartholomew et al., 1981).
Resting rate of oxygen consumption (V.O∑rest) was defined as the lowest 15 min average during the 3 h rest period. To determine when recovery was complete following a run, a 3 min running average of V.O∑, beginning at the start of the recovery period, was calculated. Recovery was complete when the first 3 min average was equal to, or less than, 1.5 times the value of V.O∑restfor each individual animal. This value allowed us to quantify an endpoint to recovery that minimized any influence that grooming and other behaviors in which animals might engage following activity had on V.O∑. To determine the ‘excess’ oxygen consumed as a consequence of the activity, the volume of oxygen consumed as a result of resting metabolic rate was subtracted from the volumes of oxygen consumed during the run and recovery.
Whole-body lactate concentration
Thirty-five white laboratory mice (22.7±0.25 g body mass) from the same CF-1 outbred stock were used for determining whole-body lactate concentrations at rest, immediately after exercise and following recovery to determine whether the lactate that accumulated during exercise was removed from the body by the time V.O∑returned to resting levels after activity. The mice were kept 10 per cage with food and water available ad libitum. They had no access to a running wheel or other form of exercise.
After being fasted overnight, each mouse was first rested quietly for 45–120 min in the same-sized chamber used for the metabolic experiments. Following rest, the mouse was transferred to the treadmill where it ran according to the one-run, five-run and 13-run protocols. After running, the mice recovered for 25, 13 or 23 min, respectively, which was the time required for V.O∑to reach resting levels in the mice in the
first part of this study. The mice were killed following rest, immediately after the last 15 s sprint of the three exercise treatments or after recovering from the activity. The carcasses were homogenized in cold 6 % perchloric acid, and samples of the supernatant fluid were centrifuged and frozen for subsequent analysis of lactic acid content. Lactic acid concentrations in the homogenates were determined using the technique described by Gleeson (Gleeson, 1985) using a Hitachi U1100 spectrophotometer at 340 nm.
Statistical analyses
EPOC volume and the cost of activity were analyzed as a function of exercise frequency. A repeated-measure ANOVA was used to determine differences across treatments. Paired post-hoc tests were used to examine differences between treatments. For repeated tests of significance, experimentwise error was maintained at 5 %. Volumes are expressed as STPD. Data are expressed as means ± S.E.M.; N=9 for the V.O∑ experiments.
Whole-body [lactate] was analyzed as a function of exercise frequency and whether the animal was at rest, had just run or had recovered from the activity. A factorial ANOVA was used to determine differences across treatments. A one-tailed post-hoc test was used to analyze whether values were higher than the resting value for [lactate]. Data are expressed as means ± S.E.M.; N=5 for each of the seven treatments.
Results
The mean change in the rate of oxygen consumption (V.O∑) during the five-run treatment is shown in Fig. 2. Once the animal had rested, treadmill speed was increased to each animal’s maximum sprint speed. At this time, V.O∑increased rapidly, stayed elevated during the run and then began to
Time (min)
Pr
otocol
0 1 2 3 4 5 6 1×
2× 3× 5× 9× 13× Constant run
15 s run/345 s rest 15 s run/165 s rest 15 s run/75 s rest 15 s run/30 s rest 15 s run/15 s rest 375 s run/0 s rest
= 15 s
2 3 4 5 6 7 8 9
0 10 20 30 40 50 60
Rate of oxygen consumption
(ml O
2
g
-1 h -1)
[image:3.612.321.566.69.235.2]Time (min) Fig. 1. Experimental design. Each bar represents a 15 s sprint at each
mouse’s maximum sprint speed. Constant run represents a continuous run at the maximum speed the mouse could maintain for 375 s. Except for the one-run (1×) protocol, the first run began at time zero and the last run ended at 375 s, thus altering the length of
the pause periods between the runs. Fig. 2. Mean rates of oxygen consumption during the five-run
exercise protocol. Time zero equals the beginning of the first run. The black bars under the curve during the run period represent the time intervals when the mice were run. Data are plotted as means ±
[image:3.612.50.297.72.177.2]decline during the recovery period. When treadmill speed was again increased, V.O∑ also increased, and the same trend was seen for each 15 s sprint. Once the final sprint had finished, V.O∑ declined towards resting levels. The resting rate of oxygen consumption (V.O∑rest) in the mice used for measuring oxygen consumption ranged from 1.68 to 2.62 ml O2g−1h−1 (mean 2.20±0.12 ml O2g−1h−1). The rate of oxygen consumption during the 15 s sprints (V.O∑run) ranged from 3.79 to 8.64 ml O2g−1h−1(mean 6.25±0.05 ml O2g−1h−1).
The total excess volume of oxygen consumed during exercise (or excess exercise oxygen consumption; EEOC volume) increased as activity frequency increased because the animals spent more time running as activity frequency increased. Total EEOC volume increased significantly (ANOVA P<0.0001) from 0.03±0.01 ml O2g−1during the one-run treatment to 0.40±0.02 ml O2g−1during the continuous 375 s run. The EEOC volume of later sprints tended to be lower than that of earlier sprints within a single protocol. This is illustrated in Fig. 2 for the five-run protocol.
The distance the animals ran during each exercise treatment increased significantly (ANOVA P<0.0001) with activity frequency, as expected. Values ranged from 8.9±1.9 m during the one-run treatment to 154.5±5.8 m during the continuous run (Table 1). The mice could easily sprint for 15 s at a time, but they could not maintain this pace during the continuous run. The animals ran significantly faster during the 15 s sprints (0.52±0.01 m s−1) than during the continuous 375 s run (0.45±0.04 m s−1; ANOVA P<0.05).
After the last run of each protocol, V.O∑dropped sharply at first and then more gradually, reaching threshold levels (1.5×V.O∑rest) in 13–25 min. Recovery times averaged 19±2 min for all protocols and were not significantly different for the different treatments (Table 1; ANOVA P=0.30), although a minimum recovery time was observed following the five-run protocol.
[image:4.612.46.562.86.228.2]When the volume of oxygen consumed only during the final recovery period was calculated (the last EPOC volume), no significant differences were found among the treatments (Fig. 3; Table 1; ANOVA P=0.24). When the total excess oxygen consumed during all the recovery periods (pause-interval volumes plus the last EPOC volume) were summed (the total EPOC volume), the total EPOC volumes for the two-run, three-run and five-run exercise protocols were significantly greater than the total EPOC volume for the continuous 375 s run (ANOVA P<0.05). There were no significant differences among the other comparisons (Fig. 3; Table 1; ANOVA P=0.20). The total EPOC volume accounted for more than 80 % of the total excess oxygen consumed as a result of running when activity was performed intermittently.
Table 1. Summary of distance run, recovery times and oxygen consumption
Final EPOC volume Total excess O2consumed;
Number of Distance run recovery time (ml O2g−
1)
EEOC+total EPOC
15 s sprints1 (m) (min) Last Total (ml O
2g−1)
1 8.9±0.6 25±5 1.01±0.23 1.01±0.23 1.04±0.23
2 16.9±0.8 18±3 0.71±0.14 1.02±0.15 1.06±0.15
3 22.5±1.0 17±4 0.68±0.15 1.08±0.17 1.13±0.18
5 38.6±1.7 13±3 0.54±0.13 0.91±0.15 1.00±0.15
9 72.1±2.6 19±4 0.69±0.18 0.98±0.19 1.15±0.20
13 99.2±3.8 23±6 0.94±0.28 1.16±0.29 1.38±0.29
Constant run 154.5±5.8 19±3 0.56±0.10 0.56±0.10 0.96±0.11
ANOVA P<0.0001 P=0.30 P=0.24 P=0.20 P=0.61
1All sprints occurred within a 375 s period, so increasing the number of sprints reflects an increased frequency of running. The continuous
run represents a 375 s run.
Values are means ±S.E.M. (N=9).
EPOC, excess post-exercise oxygen consumption; EEOC, excess exercise oxygen consumption.
Last indicates the EPOC volume for the final recovery period only. Total EPOC volume also includes the oxygen consumed for the recovery periods during the intervals between exercise bouts.
0 0.5 1 1.5
EPOC volume
(ml O
2
g
-1)
1 C
Treatment
[image:4.612.351.535.318.466.2]2 3 5 9 13
Fig. 3. Excess post-exercise oxygen consumption (EPOC) volume as a function of the number of 15 s sprints in 375 s. The hatched columns indicate the volume of oxygen consumed after the final 15 s run (the final, uninterrupted, EPOC volume) and the black columns indicate the total EPOC volume (O2consumed between run intervals
When the mice ran for a constant 375 s, EPOC volume accounted for only 58 % of the total excess oxygen consumed during exercise and recovery.
Whole-body lactate concentrations ([lactate]) increased significantly from resting levels (5.3±0.2 mmol) immediately after sprinting, but then dropped to resting levels during the recovery periods (Fig. 4). As the number of 15 s sprints within the 375 s period increased from one to 13, [lactate] immediately after the last sprint increased from 1.0 to 3.7 mmol above the resting value, respectively. After recovering for 25, 13 or 23 min following the one-run, five-run and 13-run protocols, respectively, [lactate] was not significantly different from resting values.
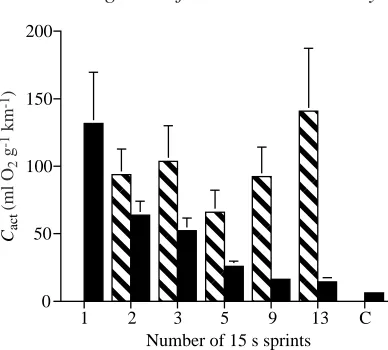
The cost of activity (Cact) (as originally defined by Baker and Gleeson, 1998) was calculated by summing the EEOC and EPOC volumes and then dividing by the distance traveled. To this value we would have added the oxygen volume equivalent of the accumulated lactate persisting at the end of recovery, but in these experiments there was none. To address whether prior activity influenced subsequent activity costs, we also calculated the Cactfor the last 15 s bout of running by summing the oxygen consumed during the last 15 s run and the oxygen consumed during the final recovery period and then dividing by the distance run only during the last 15 s run. Values for the last Cact ranged from 66±16 to 141±47 ml O2g−1km−1 when activity was performed intermittently (Fig. 5). No significant differences occurred among these treatments (ANOVA P=0.11).
The total Cactwas calculated by summing the excess oxygen consumed during each interval and the total EPOC volume and dividing by the distance run by the mice during all sprints for each treatment. As activity frequency increased, the total Cact decreased significantly (Fig. 5, ANOVA P<0.0001). Values
for the total Cactdecreased from 132±38 ml O2g−1km−1for the one-run treatment to 6±1 ml O2g−1km−1for the constant run.
Discussion
[image:5.612.347.541.60.235.2]Previous research from our laboratory showed that one bout of brief, intense running in mice (5–60 s) had an energetic cost associated with it that was much higher than the costs estimated from long-duration, sustainable exercise (Baker and Gleeson, 1998; Baker and Gleeson, 1999). The energetic cost per unit distance run was 15–250 times higher than traditional estimates calculated from animals running at a low intensity for a long time (Taylor et al., 1970). When our data were combined with data for the daily movement distance of other small rodents (Garland, 1983), we anticipated that cost estimates based upon single activities were too high for an animal to incur repeatedly during a day. As a result, we hypothesized that the energetic cost of traveling a unit distance would be reduced when a behavior was performed frequently. Previous research in lizards (Dipsosaurus dorsalis) showed that recent activity could reduce the energetic cost of a subsequent bout of locomotor activity. Scholnick and Gleeson (Scholnick and Gleeson, 2000) reported that, when lizards performed intermittent activity before 5 min of continuous exhaustive exercise, the final EPOC volume was 30–40 % lower than if the lizard had not performed any activity before the 5 min run. As a result, the cost of activity was significantly lower when intermittent behaviors were performed. To determine whether this also occurs in mice, we calculated the energetic cost associated with only the final 15 s run (last Cact, Fig. 5). The results showed that the energetic cost of the last 15 s run was not affected by the number of sprints occurring
Fig. 4. Lactate concentration versus experimental treatment. 1-E, 5-E and 13-E represent the lactate concentration (mmol) immediately after running once, five times or 13 times. 1-R, 5-R and 13-R represent the lactate concentration after recovering for 25, 13 or 23 min, respectively, following the one-run, five-run and 13-run exercise protocols. Asterisks mark significant differences from resting values. Values are plotted as means + S.E.M.; N=5 for each experimental treatment. R indicates the [lactate] after only resting.
0 2.5 5 7.5 10
[Lactate] (mmol)
R 1-E 1-R 5-E 5-R 13-E 13-R Experimental treatment
*
*
*
0 50 100 150 200
Cact
(ml O
2
g
-1 km -1)
1
Number of 15 s sprints C
[image:5.612.87.268.69.224.2]2 3 5 9 13
Fig. 5. Cost of activity (Cact) as a function of the number of 15 s
sprints in 375 s. The hatched columns indicate Cactcalculated when
considering only the oxygen consumed and distance run during and following the last 15 s run (the last Cact). The black columns indicate
the total Cact, calculated by dividing the total oxygen consumed,
before the final bout. Thus, any energetic savings that might be realized as a result of recent, previous behaviors were not detected in mice.
Although lacking statistical significance, the volume of the final EPOC volume did exhibit a noticeable minimum following the five-sprint protocol (Fig. 3). This result may hint at an activity frequency that allows optimal recovery for these animals. The 75 s pause periods between each of the 15 s runs in this protocol may be long enough for cellular energy sources to replenish themselves enough to energize the animal through the following run in the most economical manner. There is evidence of optimum run–pause ratios in other animals that improve locomotor capacity in some way (Weinstein and Full, 1992; Weinstein and Full, 1999) and an analogous optimum may also exist in mice.
When the energy expended per unit distance covered is considered for each protocol as a whole, rather than considering only the final run and recovery, there are significant differences in Cact. When intermittent activity is performed less frequently, the energetic cost is greater, and when behaviors occur more frequently, the cost per unit distance run decreases. Although the animals consumed more oxygen during the activity periods at higher frequencies because they were running for a longer total amount of time, the mice were not consuming proportionately greater amounts of oxygen for the greater distance they ran. As a result, Cact decreased as frequency increased because the total EPOC volume was not significantly different for any of the protocols. This same relationship is seen when only activity duration is
changed. One of our previous studies found that, as activity duration increased, Cactdecreased in a similar manner (Baker and Gleeson, 1998). Fig. 6 compares the energetic costs of running for a given amount of time continuously versus intermittently. The data indicate that, as the cumulative time spent running increases, Cact decreases regardless of whether the activity is intermittent or continuous. The effect of increasing exercise frequency mirrors the effect of increasing the duration of continuous exercise, which means that the costs associated with brief activity are not always high. If a brief bout of exercise is performed only once, the energetic cost will be high, but if brief bouts are performed more frequently, then costs per unit distance may be reduced.
Other studies have also shown that, when activity is performed intermittently, animal performance is enhanced. Weinstein and Full (Weinstein and Full, 1992) reported that ghost crabs could increase the distance they were capable of running by more than fivefold if the exercise was intermittent rather than continuous when the runs were performed either at the same absolute speed or at the average speed. In a similar study, Weinstein and Full (Weinstein and Full, 1999) published data also showing an increase in the distance that frog-eyed geckos Teratoscincus przewalskii were able to run when activity was performed intermittently rather than continuously. In rainbow trout Oncorhynchus mykiss, Scarabello et al. (Scarabello et al., 1992) found that when trout were exercised for two 5 min bouts 6 h apart, they recovered from the second bout at least an hour sooner than from the first bout (2–3 h versus 4 h, respectively). Accompanying the faster V.O∑ recovery after the second bout of exercise was a faster removal of whole-body lactate, and the authors concluded that there were improved rates of metabolic recovery following intermittent activity.
Mice may be able to reduce their energy expenditure when performing activity intermittently by keeping the pause periods between runs much shorter than the time required for complete recovery. However, if this pause period is long enough to allow complete recovery, then the cost of intermittent exercise may be higher than a period of constant activity of equal total duration. This is the case in both humans Homo sapiens and prairie voles Microtus ochrogaster . Haltom et al. (Haltom et al., 1999) reported that human subjects performing circuit weight training could expend more calories by having a longer rest period between different exercises. When the rest period was limited to 20 s, subjects expended only 87 % of the calories that were used when the rest period was 60 s. Following a single sprint, prairie voles require only 7 min for V.O∑to return to resting levels. When prairie voles were run seven times for 5 s each with a long rest period between the bouts (30 min), the total Cact was higher than that predicted from continuous activity lasting 35 s (seven bouts ×5 s each; T. T. Gleeson and B. A. Wunder, unpublished data).
Another energetic benefit of intermittent activity is that a given amount of work performed intermittently can preserve energy sources and prevent fatigue from occurring as fast as it would occur during continuous activity. Saltin and Essén
0 50 100 150
0 100 200 300 400 500 600 700
Cact
(ml O
2
g
-1 km -1)
[image:6.612.45.288.73.250.2]Cumulative run time (s)
Fig. 6. Total cost of activity (Cact) as a function of the cumulative
run time for each treatment. The total time the mice spent running during each treatment was summed, and Cactwas then plotted. Using
the equation from Baker and Gleeson (Baker and Gleeson, 1998), values of Cactfor continuous running for the same time as for each
sequence of intermittent runs was estimated (open squares). The filled circles represent values for Cact during intermittent activity.
The open circle at 600 s represents the cost for steady-state exercise (Taylor et al., 1970). The Cact values for summed intermittent
locomotion decreased as predicted by the equation y=2596x−1.057.
(Saltin and Essén, 1971) reported that, in humans exercising intermittently with varying exercise and pause periods, ATP and creatine phosphate stores declined less if the exercise periods were 15 s or shorter and the recovery periods were 20 s or longer. By the end of the 20 s recovery period, ATP and creatine phosphate concentrations had been restored. At longer exercise durations, [creatine phosphate] dropped to less than 25 % of resting values and [ATP] dropped to below 55 % of resting concentrations. By keeping activity durations short, an animal can repeatedly rely upon these energy sources. Saltin and Essén (Saltin and Essén, 1971) also found that glycogen depletion was less during intermittent exercise than during continuous exercise. By protecting glycogen stores, the capacity for extended vigorous activities, such as capturing prey and escaping predators, may be preserved.
In conclusion, the costs of intermittent locomotion in mice are lower than predicted from cost estimates of single bouts of activity. When animals increase the frequency with which they perform brief activity, they can minimize energetic costs just as they would if they were to increase the duration of continuous activity. Since many animals are not able to run for long periods because of aerobic limitations or increased risks associated with predators, performing activity intermittently appears to afford the same energetic benefits. Performing activity frequently in short bursts may be the mechanism by which animals are able to afford the costs associated with brief locomotion.
We would like to thank Tom Hancock for his discussions and analysis of this work. Funded by NSF Grant IBN9724140.
References
Baker, E. J. and Gleeson, T. T. (1998). EPOC and the energetics of
brief locomotor activity in Mus domesticus. J. Exp. Zool. 280, 114–120.
Baker, E. J. and Gleeson, T. T. (1999). The effects of intensity on
the energetics of brief locomotor activity. J. Exp. Biol. 202, 3081–3087.
Bartholomew, G. A., Vleck, D. and Vleck, C. M. (1981).
Instantaneous measurements of oxygen consumption during pre-flight warm-up and post-pre-flight cooling in sphingid and saturniid moths. J. Exp. Biol. 90, 17–32.
Full, R. J. and Herreid, C. F. (1984). Fiddler crab exercise: the
energetic cost of running sideways. J. Exp. Biol. 109, 141–161.
Gaesser, G. A. and Brooks, G. A. (1984). Metabolic bases of excess
post-exercise oxygen consumption: a review. Med. Sci. Sports 16, 29–43.
Garland, T. (1983). Scaling the ecological cost of transport to body
mass in terrestrial mammals. Am. Nat. 121, 571–587.
Gleeson, T. T. (1985). Glycogen synthesis from lactate in skeletal
muscle of the lizard Dipsosaurus dorsalis. J. Comp. Physiol. 156, 277–284.
Haltom, R. W., Kraemer, R. R., Sloan, R. A., Hebert, E. P., Frank, K. and Tryniecki, J. L. (1999). Circuit weight training and its
effects on excess postexercise oxygen consumption. Med. Sci.
Sports Exerc. 31, 1613–1618.
Kenagy, G. J. and Hoyt, D. F. (1989). Speed and time–energy
budget for locomotion in golden-mantled ground squirrels. Ecology
70, 1834–1839.
McAdam, A. G. and Kramer, D. L. (1998). Vigilance as a benefit
of intermittent locomotion in small mammals. Anim. Behav. 55, 109–117.
Saltin, B. and Essén, B. (1971). Muscle glycogen, lactate, ATP and
CP in intermittent exercise. In Advances in Experimental Medicine
and Biology: Muscle Metabolism During Exercise (ed. B. Pernow
and B. Saltin), pp. 419–424. New York: Plenum Press.
Scarabello, M., Heigenhauser, G. J. F. and Wood, C. M. (1992).
Gas exchange, metabolite status and excess post-exercise oxygen consumption after repetitive bouts of exhaustive exercise in juvenile rainbow trout. J. Exp. Biol. 167, 155–169.
Schmidt-Nielsen, K. (1972). Locomotion: energy cost of swimming,
flying and running. Science 177, 222–228.
Scholnick, D. A. and Gleeson, T. T. (2000). Activity before exercise
influences recovery metabolism in the lizard Dipsosaurus dorsalis.
J. Exp. Biol. 203, 1809–1815.
Taylor, C. R., Schmidt-Nielsen, K. and Raab, J. L. (1970). Scaling
of energetic cost of running to body size in mammals. Am. J.
Physiol. 219, 1104–1107.
Tucker, V. A. (1970). Energetic cost of locomotion in animals. Comp. Biochem. Physiol. 34, 841–846.
Weinstein, R. B. (1995). Locomotor behavior of nocturnal ghost
crabs on the beach: focal animal sampling and instantaneous velocity from three-dimensional motion analysis. J. Exp. Biol. 198, 989–999.
Weinstein, R. B. and Full, R. J. (1992). Intermittent exercise alters
endurance in an eight-legged ectotherm. Am. J. Physiol. 262, R852–R859.
Weinstein, R. B. and Full, R. J. (1999). Intermittent locomotion
increases endurance in a gecko. Physiol. Biochem. Zool. 72, 732–739.
Withers, P. C. (1977). Measurement of V.O∑, V
.
CO∑and evaporative