Assessed with Blood Oxygen Level–Dependent Functional MR
Imaging
Stefan Posse, Uwe Olthoff, Matthias Weckesser, Lutz Ja¨ncke, Hans-Wilhelm Mu¨ller-Ga¨rtner, and Stephen R. Dager
PURPOSE: To quantitate the amplitude changes and temporal dynamics of regional functional MR imaging signals during voluntary hyperventilation using blood oxygen level– dependent contrast echo-planar imaging. METHODS: Seven male subjects were studied during voluntary hyperven-tilation (PetCO2520 mm Hg) regulated by capnometry. Measurements were made on multisection echo-planar MR images obtained with parameters of 1000/66 (repetition time/echo time), flip angle of 30°, and voxel size of 33335 mm3. Sensitivity of the functional MR imaging signal to changes in PetCO2, time delays in relation to PetCO2changes, and time constants of functional MR imaging signal changes were assessed on a region-by-region basis. RESULTS: Within 20 seconds of starting hyperventilation, rapid and substantial decreases in the functional MR imaging signal (by as much as 10%) were measured in areas of gray matter, which were significantly greater than the modest changes observed in white matter. Regional-specific effects in areas of the frontal, occip-ital, and parietooccipital cortex were stronger than in subcortical regions or in the cerebellum. Signal decreases measured with functional MR imaging were significantly delayed with respect to the reduction in PetCO2. Apparent differences between regional time constants did not reach statistical significance. CONCLUSION: Regional and gray–white matter differences in functional MR imaging signal changes during controlled hyperventilation may reflect differences in metabolic activity, vascular regulation, and/or capillary density. When measuring brain activation with functional MR imaging, arterial PCO2 differences due to unregulated respiration may confound interpretation of activation-related functional MR imaging signal changes.
Index terms: Cerebral blood flow; Magnetic resonance, functional
AJNR Am J Neuroradiol18:1763–1770, October 1997
Functional magnetic resonance (MR) imag-ing is increasimag-ingly beimag-ing used to assess cerebral vasomotor reactivity to respiratory challenges and their effect on signal changes in functional MR imaging (1–5) (K. Ying, D. W. Chakeres, P. Schmalbrock, “Functional MRI of Alternating Hyperventilation and Apnea,” in: Abstracts of
the Society of Magnetic Resonance,1994;4(P): 60; J. V. Hajnal, A. Oatridge, N. Saeed, G. M. Bydder, I. R. Young, “Detection of Changes Pro-duced by Inhalation of Pure Oxygen and Carbo-gen Using 3D T1-Weighted Brain Imaging,” in:
Abstracts of the Society of Magnetic Resonance,
1995:769; H. B. W. Larsson, E. Rostrup, P. Toft, et al, “fMRI of CO2Induced Increase in Cerebral Perfusion,” in: Abstracts of the Society of Mag-netic Resonance, 1993:8; K. K. Kwong, K. M. Donahue, L. Ostergaard, et al, “Mechanism of Brain Signal Increases in Hyperoxia,” in: Ab-stracts of the Society of Magnetic Resonance
1995:768). Such studies are of interest because they provide a potential means for characteriz-ing the sensitivity of functional MR contrast to changes in cerebral blood flow (CBF) that are unrelated to changes in blood oxygenation or neuronal activation.
Received January 8, 1997; accepted after revision April 21. Presented in part at the annual meeting of the American Society of Neuroradiology, Seattle, Wash, June 1996.
From the Institute of Medicine, Research Center Ju¨lich (Germany) GmbH (S.P., U.O, M.W., L.J., H-W.M-G.), and the Departments of Psychi-atry and Behavioral Sciences and Bioengineering, University of Washing-ton, Seattle (S.R.D.).
Address reprint requests to Stefan Posse, PhD, Institute of Medicine, Research Center Ju¨lich GmbH, D-52425 Ju¨lich, Germany.
AJNR 18:1763–1770, Oct 1997 0195-6108/97/1809 –1763
©American Society of Neuroradiology
Voluntary hyperventilation rapidly and strongly reduces CBF, but (except for extreme cases) does not decrease cerebral oxygen con-sumption in healthy persons (6). As compared with pharmacologic interventions to reduce global CBF, use of voluntary hyperventilation as a physiological challenge has several advan-tages: it can be carefully monitored and regu-lated; reduction of global CBF can be induced very rapidly, enabling the time constants of the vascular regulation to be measured; and it can be repeated multiple times in a single experi-ment to increase sensitivity or to assess repro-ducibility. If the subject experiences adverse physiological or psychological reactions, con-trolled hyperventilation can be terminated im-mediately. The reduction in CBF, which is most pronounced in cortical areas, has been quanti-tated with positron emission tomography (PET) with oxygen 15 by several research groups (7, 8). In those studies, no specific regional differ-ences in cortical CBF changes were investi-gated. More recently, Stehling and colleagues (1) have reported hyperventilation-induced cor-tical signal decreases in blood oxygen level– dependent (BOLD) contrast functional MR im-aging. They hypothesized that the observed signal decreases were due to a reduction in cerebral blood volume. A subsequent study by Ying and coworkers, using a strongly flow-sen-sitized functional MR imaging technique, re-vealed signal decreases in all cortical vessels after hyperventilation (Ying et al, “Functional MRI...”), consistent with results from Doppler sonographic studies and from 15O PET experi-ments (7, 8). Our interest in using functional MR imaging to study hyperventilation was stimu-lated by our previous work using proton echo-planar spectroscopic imaging to measure re-gional metabolic changes during controlled hyperventilation (9). In that study, we observed global increases in brain lactate in areas of both gray and white matter. The combination of met-abolic MR imaging with functional MR imaging may allow the functional relationship between regional metabolic and CBF regulation to be assessed in healthy and diseased brain.
In this study, we specifically assessed the amplitude changes and temporal dynamics of regional functional MR imaging signal change during voluntary hyperventilation using BOLD contrast echo-planar imaging. Hyperventilation was regulated using endtidal CO2 (PetCO2),
which closely parallels arterial CO2(PaCO2), to
ensure a comparable magnitude of hypocapnia among subjects for measuring functional MR imaging signal changes (10). The amplitudes of the changes in functional MR imaging signals were determined for anatomically defined re-gions of interest (ROIs), the time delays for these signal changes were determined in rela-tion to PetCO2, and the time constants of the
signal changes were computed assuming an exponential signal decay.
Materials and Methods
Seven healthy male subjects (with no known history of vascular disease) were studied 21 times. Written informed consent was obtained in accordance with institutionally reviewed protocols. After baseline measurements were ob-tained (PetCO2538.1 mm Hg63.5) (all measurements6 standard deviation), subjects were instructed to hyperven-tilate vigorously. During sustained hyperventilation, which was maintained for up to 3 minutes, PetCO2was monitored continuously to adjust the respiratory rate to achieve con-sistent PetCO2levels of 17.562.0 mm Hg (hypocapnia). Expired gas was sampled continuously via a nasal cannula to monitor PetCO2using a Datex Capnomac (Instrumenta-rium Corp, Helsinki, Finland) capnometer. In an earlier study, we demonstrated that the PetCO22PaCO2gradient within subjects is consistent under normal and hypocapnic conditions (10). Measurements were taken with a tempo-ral resolution of between 3 and 5 seconds. There was a PetCO2 measurement delay of approximately 5 seconds after expiration due to dead space from the 7.5 m long cannula.
MR imaging was performed on a clinical 1.5-T whole-body scanner with a maximum gradient amplitude of 25 mT/m and a gradient rise time of 600 milliseconds. The head was secured inside the standard quadrature head coil using tight foam padding. Tapes were placed over the forehead and attached to the head coil to minimize head motion further and to provide a default head position in case head movement occurred. Heart rate was monitored using the pulse oximeter (or the electrocardiogram) unit integrated in the MR scanner. T1-weighted spin-echo im-aging was used for anatomic reference and rapid flow-sensitized gradient-echo imaging was used to depict cere-bral vasculature.
BOLD contrast functional MR imaging was performed using gradient-echo echo-planar imaging with the follow-ing pulse sequence parameters: 1000/66/1 (repetition time [TR]/echo time [TE]/excitations), flip angle of 30°, and voxel size of 33335 mm3. The low flip angle was
high-resolution imaging section with the largest extension of the thalamus; the third section was placed in the center of the striatum). The fourth section was placed in the centrum semiovale (to exclude artifacts due to cerebrospinal fluid, this section was placed approximately 6 mm above the highest level of the side, or lateral, ventricles). The fifth section was placed in the apex (this section was thought to contain only small parts of white matter and predomi-nantly cortical gray matter). The aim of this section selec-tion was to obtain at least one secselec-tion for each anatomic structure investigated, where that structure was clearly demarcated. The separation between sections was vari-able, since each section was matched to individual brain anatomy. Hyperventilation was initiated after 40 seconds of baseline measurements and continued for 60 seconds. The same measurement was repeated after 15 minutes of rest. In addition, three of the seven subjects repeated the protocol on a different day.
To assess whether residual in-flow effects confounded the previous protocol, one of the subjects was retested with a TR of 6000 and a flip angle of 90°. For this study, electrocardiogram gating was used to minimize potentially confounding effects from brain pulsations. Eighteen axial sections covering the cerebrum and part of the cerebellum were acquired. Hyperventilation was initiated after 120 seconds of baseline measurements and continued for 180 seconds. The same measurement was repeated after 15 minutes of rest.
Image registration using the AIR2.0 software developed by Woods et al (11) proved to be difficult for data acquired at a TR of 1000 owing to the large gaps between sections that precluded correction of through-plane motion. Two-dimensional image registration was used to reduce edge artifacts. Data sets were discarded in instances in which gross head displacement could be identified by displaying the images in a cine loop, or in which more subtle head displacement, which correlated with the onset of hyper-ventilation, could be identified as artifactual signal changes along the edge of the brain and along the ventri-cles inzscore images. Two-dimensional image registra-tion was used to reduce edge artifacts in these data sets. Data analysis of reconstructed echo-planar images was performed on a Sun workstation using IDL (Interactive Data Language, Boulder, Colo) and the DPA software package developed by Goldberg and Le Bihan (12). To assess the distribution and strength of regional signal changes visually, we performed azscore analysis of the images using azscore threshold of two standard devia-tions.
Anatomically defined ROIs were drawn manually in each hemisphere (Fig 1) in reference to the brain atlas of Talairach and Tourneaux (13); these comprised the frontal cortex, the parietooccipital cortex, the occipital cortex, the cerebellum, the insular cortex, the thalamus, the striatum, and the white matter in the centrum semiovale (averaged over two sections). For data acquired with a TR of 6000, the same ROIs were defined. The functional MR imaging signal intensity data were averaged over the ROIs and then transferred to a PC for further analysis using the Sigmaplot
2.0 software (Jandel Corp, SPSS Inc, Chicago, Ill). The initial seven time points acquired during non–steady-state conditions were discarded.
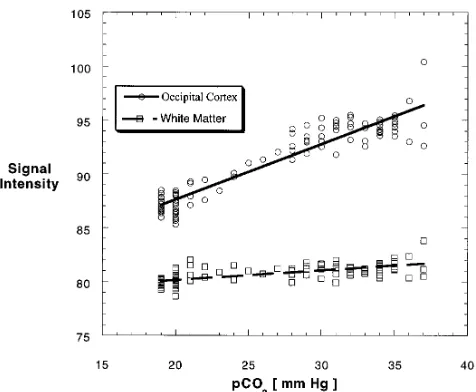
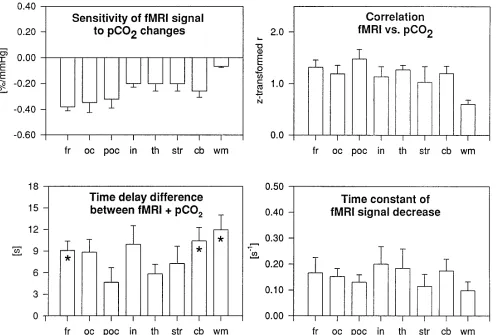
Analyses using linear regression between the regional functional MR imaging signal intensity values and PetCO2 values in each subject were performed to assess the re-gional sensitivity of the functional MR imaging signal to changes in PetCO2(slope) and the correlation coefficients. Results were averaged over all subjects. The time course of the regional functional MR imaging signals was further analyzed using a nonlinear least squares curve fit routine to calculate four parameters (Fig 2): the signal intensity at rest (S0), the starting point of the decrease in signal
inten-sity (t1), the time constant of the decrease in signal
inten-sity (t), and the signal intensity during maximum hyper-ventilation (S1). The fit assumed a constant function
during baseline (t,t1):
1) S~t!5S0
and a delayed exponential signal decay during hyperven-tilation (t$t1):
2) S~t!5~S02S1)exp(2t[t2t1])1S1.
The delay between the decrease in regional functional MR imaging signal and the onset of decreases in global PetCO2 (corresponding to a PetCO2 decrease that exceeded one standard deviation of baseline fluctuations) was calculated on the basis of t1and by taking into account the 5-second
PetCO2measurement delay. Results were averaged over all subjects.
Because of the small sample size, the calculatedPvalues were used as measures of the size of the effect (14). To detect differences with respect to dependent variables measured in the different brain regions (without relying on statistical arti-facts), only effects associated with aPvalue of less than .05 are reported . To assess significance, nonparametric statis-tical tests (Friedmann’s two-way analysis of variance, Wil-coxon’s matched-pairs signed rank test) were applied. Cor-relation coefficients werez transformed for comparison of brain regions (15).
Results
hyperven-tilation, which was delayed with respect to the reduction in PETCO2(Figs 2– 4). In some areas,
the change in functional MR imaging signal was detectable within seconds from onset of hyper-ventilation (Fig 5, Table). The relative signal decreases in parts of the frontal cortex ex-ceeded 10% of baseline. Statistically significant differences (P 5 .007) in signal changes were observed between anatomically defined ROIs (Fig 5, Table). Subsequent analysis (Student-Neuman Keuls method) revealed that white matter had the least sensitivity to changes in PetCO2, up to six times less than that in the
frontal cortex. In addition, we found that de-creases in regional functional MR imaging sig-nal in the insular cortex, the thalamus, the stri-atum, and the cerebellum were smaller than those in the frontal, parietooccipital, and
occip-Fig 1.A–E, Depiction of the anatomi-cally defined ROIs in the five selected axial sections (1, frontal cortex;2, central white matter;3, parietooccipital cortex;4, central white matter;5, insular cortex;6, striatum;7, thalamus; 8, occipital cortex; 9, cerebel-lum).
[image:4.587.59.550.86.537.2]ital areas. Although there was a trend toward a between-hemisphere difference in changes in functional MR imaging signal in the frontal cor-tex, no further statistically significant differ-ences between left and right hemispheres were observed. There were strong linear correlations between PetCO2and functional MR imaging
sig-nal (z values greater than 1.0), corresponding to a Pearson correlation greater than 0.76 (Fig 5, Table), except for white matter (P , .002). Pairwise comparisons using the Student Neu-man-Keuls method revealed no significant in-terregional differences except for white matter. When assessing the regional temporal dy-namics of signal changes (Fig 5, Table), we measured a significant time delay between on-set of changes in PetCO2and onset of changes in
regional functional MR imaging signal for the combined group of ROIs (P 5 .009). Using Dunn’s method to investigate individual ROIs, we measured a significant time delay in the cerebellum, the frontal cortex, and white matter (Fig 5). The time constants of the decreases in functional MR imaging signal in areas of gray matter were similar. White matter exhibited a smaller signal decay time constant. Apparent differences between regional time constants did not reach statistical significance (P 5.652). In some of these data sets, the decreases in func-tional MR imaging signal were preceded by a slight signal increase during the initial seconds of hyperventilation.
The signal decreases induced by hyperventi-lation were qualitatively reproducible in all sub-jects after 15 minutes of rest during the second period of hyperventilation. In well-trained sub-jects in whom head movement was minimal, even the regional distribution and the
magni-tude of regional signal changes during repeated hyperventilation were similar (Fig 6). A com-parison of the data obtained in one volunteer at TRs of 6000 and 1000 shows that the mean amplitude of signal decreases averaged over all regions at TR of 6000 differed by 1.1% (SD, 2.4%) from those obtained with TR of 1000, suggesting that saturation effects did not signif-icantly confound the observed signal changes with TR of 1000.
Discussion
Hyperventilation results in a number of acute physiological and psychological symptoms, which can include light-headedness, dizziness, visual disturbance, numbness and paresthesia, palpitations, tachycardia, shakiness, tension or anxiety, panic attacks, and weakness or ex-haustion (16 –18). The immediate physiological effect of hyperventilation is to reduce arterial PaCO2, which, in turn, increases perivascular
and intraneuronal pH. Increased intraneuronal pH produces a shift in the oxidation/reduction state of central nervous system (CNS) tissue and increases neuronal discharge of both motor and sensory fibers and increases glucose con-sumption and lactate (and pyruvate) produc-tion (9, 10, 19). Rises in perivascular pH induce marked vasoconstriction, which leads to a rapid reduction in CBF, which is observable by func-tional MR imaging. Our funcfunc-tional MR imaging observations in this preliminary study can be interpreted within the context of currently
[image:5.587.308.546.81.277.2]pro-Fig 3. Corresponding time course of the PCO2 change. The hyperventilation period is indicated by the horizontal bar.
[image:5.587.51.285.85.237.2]posed mechanisms thought to be responsible for the BOLD contrast effect (20). To maintain oxidative energy metabolism during blood flow reduction due to hypocapnia, increased oxygen extraction is necessary; this increases the de-oxyhemoglobin concentration and reduces the functional MR imaging signal. This interpreta-tion is also consistent with the rise in brain lac-tate, which we reported in a previous study (9).
[image:6.587.53.549.84.419.2]The apparent regional differences in decreases in functional MR imaging signal in the gray ter, and the much-reduced effect in white mat-ter, may reflect differences in metabolic activity, vascular regulation, and/or capillary density. For example, it is known that the metabolic activity of white matter is approximately three times lower than that of the cortical areas (21). The amplitudes of the functional MR imaging
Fig 5. Summary of results (from Table). Error bars indicate standard error of the mean;asterisk,P,.05; for abbreviations, see Table.
TABLE 1: Regional quantitation of functional MR (fMR) signal dynamics based on 14 measurements in five subjects
Region of Interest
Sensitivity (Linear Regression Slope of fMR
Signal vs PetCO2), %/mm Hg (SD)
Z-Transformed Correlations: (fMR Signal vs
PetCO2), (SD)
Time Delay of fMR Signal Decrease with Respect to Start of PetCO2Decrease
(Corrected for 5 Second PetCO2 Measurement Delay), seconds (SD)
Time Constant of fMR Signal Decrease, s21
(SD)
Frontal cortex 20.38 (0.18) 1.32 (0.31) 9 (3) 0.17 (0.15)
Occipital cortex 20.34 (0.20) 1.19 (0.37) 9 (4) 0.15 (0.08)
Parietooccipital 20.32 (0.17) 1.48 (0.42) 5 (5) 0.13 (0.07)
Cerebellum 20.26 (0.19) 1.20 (0.33) 10 (4) 0.17 (0.11)
Thalamus 20.20 (0.14) 1.27 (1.20) 6 (3) 0.16 (0.15)
Striatum 20.20 (0.12) 1.04 (0.51) 7 (5) 0.11 (0.11)
Insular cortex 20.20 (0.07) 1.14 (0.43) 10 (6) 0.20 (0.19)
White matter 20.07 (0.03) 0.61 (0.18) 12 (5) 0.09 (0.07)
[image:6.587.51.547.464.598.2]signal changes in insular regions had to be in-terpreted with caution, since the insular cortex is quite thin and the inclusion of white matter areas was difficult to avoid when drawing the ROI. Temporal characteristics of CBF changes for different brain regions in response to hypo-capnia are of theoretical, and potentially of clin-ical, interest, since they may help to assess regional differences in vascular regulation of clinical conditions, such as vascular disease (22). With the use of high-time-resolution func-tional MR imaging, it is possible to monitor very rapid signal changes within a few seconds after onset of hyperventilation.
This study underlines the importance of con-trolling for respiratory changes during func-tional MR imaging studies of brain activation. In the frontal cortex, which appears to be most sensitive to hypocapnia, as much as a 0.5% change in functional MR imaging signal can be induced by a 1 mm Hg decrease in PetCO2. Our
previous experience with functional MR imaging indicates that factors such as subject arousal or even slight discomfort may increase respiration, leading to decreases in arterial PCO2. The
con-founding effects of arousal or anxiety have been amply demonstrated with other functional im-aging techniques, such as single-photon emis-sion computed tomography and PET (23, 24). While simple motor tasks may elicit functional MR imaging signal changes on the order of a few percentage points, higher cognitive functions induce much smaller signal changes, which may be more easily confounded by the effects of unregulated changes in PetCO2. The most
commonly used analytic method in functional MR imaging, correlational analysis, relies on the temporal signature of the induced signal changes to assess statistical significance. Func-tional MR imaging signal changes in primary motor and visual brain regions occur relatively rapidly (with time constants on the order of a few seconds) and thereby can be differentiated from the slower signal changes induced by changes in PetCO2. However, increasing task
complexity may induce a slower change in functional MR imaging signal, which would be difficult to differentiate from signal changes oc-curring as a consequence of changes in PetCO2.
[image:7.587.49.381.84.294.2]We were unable to use some of the data from two subjects, owing to gross evidence of motion contamination. For retained data sets, it is pos-sible that more subtle head motion contributed to the observed functional MR imaging signal changes during hyperventilation. Although some head motion was difficult to avoid in our study, we would expect that substantial head motion produces increases, as well as de-creases, in functional MR imaging signal at the periphery of the brain, along the ventricles, and in other areas with strong image contrast inter-faces. In the context of motion artifacts, positive functional MR imaging signal changes should be readily observable, as a large volume of brain between the cerebellum and the centrum semiovale was sampled. In this study, among retained data sets, functional MR imaging signal increases were only observed rarely, and the predominant change was a decrease during hy-perventilation. The effects were mostly localized
inside gray matter areas, and the fact that there was a measurable response in white matter ar-gues against predominant motion effects. Sig-nal decreases had regioSig-nal specificity, which also argues against substantial motion artifacts. However, more subtle head motion may have contributed to individual variability in functional MR imaging signal response. Finally, in contrast to most functional MR imaging studies, we se-lected rather large ROIs (Fig 1), which are in-herently less sensitive to motion artifacts than are small ROIs with focal signal changes.
In conclusion, the use of BOLD functional MR imaging to assess CBF changes during hyper-ventilation may help to elucidate mechanisms involved in regional metabolic and vascular reg-ulation and to broaden our understanding of CNS disease processes that affect those regu-latory mechanisms. Previous work has shown that functional MR imaging signal changes in the visual cortex are reduced when CBF is in-creased (25). Decreases in CBF arising from uncontrolled hypocapnia also may reduce the sensitivity of functional MR imaging for detect-ing brain activation.
Acknowledgments
We thank Denis Le Bihan (Orsay, France) for sharing his functional MR imaging analysis software package and Edgar Mu¨ller (Siemens AG, Germany) for making avail-able a pre-release of his echo-planar pulse sequences. We also thank Wolfgang Klement (University of Du¨sseldorf, Institute of Clinical Anaesthesiology) for providing the Da-tex Capnomac CO2monitor. Software support for the
non-linear curve fit was provided by Paul Jansen (Central In-stitute of Applied Mathematics, Research Center Ju¨lich GmbH) and by Frank Sonnenberg (Institute of Medicine, Research Center Ju¨lich GmbH).
References
1. Stehling MK, Turner R, Mansfield P. Echo-planar imaging: mag-netic resonance imaging in a fraction of a second.Science1991; 254:43–50
2. Kwong KK, Wanke I, Donahue KM, Davis TL, Rosen BR. EPI imaging of global increase of brain MR signal with breath-hold preceded by breathing O2.Magn Reson Med1995;33:448 – 452 3. Stillman AE, Hu X, Jerosch-Herold M. fMRI of brain during breath
holding at 4T.Magn Reson Imaging1995;13:893– 897
4. Rostrup E, Larsson HB, Toft PB, et al. fMRI of CO2induced in-crease in cerebral perfusion.NMR Biomed1994;7:29 –34 5. Moseley ME, Chew WM, White DL, et al. Hypercarbia-induced
changes in cerebral blood volume in the cat: a1H MRI and intra-vascular contrast agent study.Magn Reson Med1992;23:21–30
6. Van Rijen PC, Luyten PR, Berkelbach Van Der Sprenkel JW, et al. 1
H and31
P NMR measurement of cerebral lactate, high-energy phosphate levels and pH in humans during voluntary hyperventi-lation: associated EEG, capnographic, and Doppler findings.
Magn Reson Med1989;10:182–193
7. Bednarczyk EM, Rutherford WF, Leisure GP, et al. Hyperventila-tion-induced reduction in cerebral blood flow: assessment by PET.
Ann Pharmacother1990;24:456 – 459
8. Ramsay SC, Murphy K, Shea SA, et al. Changes in global cerebral blood flow in humans: effect on regional cerebral blood flow during a neural activation task.J Physiol1993;471:521–534
9. Posse S, Dager S, Richards T, et al. In vivo measurement of regional brain metabolic response to hyperventilation using mag-netic resonance proton echo planar spectroscopic imaging (PEPSI).Magn Reson Med1997;37:858 – 865
10. Dager SR, Strauss WL, Marro KI, Richards TL, Metzger GD, Artru AA. Proton magnetic resonance spectroscopic investigation of hyperventilation in subjects with panic disorder and comparison subjects.Am J Psychiatry1995;152:666 – 672
11. Woods RP, Mazziotta JC, Cherry SR. Automated image registra-tion. In: Uemura K, Lassen NA, Jones T, Kanno L, eds. Quantifi-cation of Brain Function: Tracer Kinetics and Image Analysis in Brain PET.Amsterdam, the Netherlands: Elsevier; 1993;:391–398 12. Le Bihan D. Integrated processing software for functional MRI.
Human Brain Mapping1995;supp 1:151
13. Talairach J, Tournaux P.Coplanar Stereotaxic Atlas of the Human Brain.New York, NY: Thieme Medical; 1988
14. Krauth J.Distribution-Free Statistics: An Application-Oriented Ap-proach.Amsterdam, the Netherlands: Elsevier; 1988
15. Sachs L. Angewandte Statistik.Berlin, Germany: Springer-Ver-lag; 1984
16. Belmer H, Haardonk H. Symptomatik und Behandlung des Hy-perventilations Syndroms. Mnch Med Wschr 1971;113: 1255–1258
17. Hill O. The hyperventilation syndrome.Br J Psychiatry1979;135: 367–368
18. Lum LC. Hyperventilation and anxiety state (editorial).J R Soc Med1981;74:1– 4
19. Siesjo BK. Carbon dioxide in brain energy metabolism. In: Siesjo BK, ed.Brain Energy Metabolism.New York, NY: Wiley; 1978: 288 –323
20. Boxermann JL, Hamberg LM, Rosen BR, Weisskopf RM. MR con-trast due to intravascular magnetic susceptibility perturbations.
Magn Reson Med1995;34:555–566
21. Siesjo BK. Regional metabolic rates in the brain. In: Siesjo BK, ed. Brain Energy Metabolism. New York, NY: Wiley; 1978: 131–150
22. Ringelstein EB, Sievers C, Ecker S, Schneider PA, Otis SM. Non-invasive assessment of CO2-induced cerebral vasomotor re-sponse in normal individuals and patients with internal carotid artery occlusions.Stroke1988;19:963–969
23. Gur RC, Gur RE, Resnick SM, Skolnick BE, Alavi A, Reivich M. The effect of anxiety on cortical cerebral blood flow and metabo-lism.J Cereb Blood Flow Metab1987;7:173–177
24. Dager SR, Layton ME, Richards TL. Neuroimaging findings in anxiety disorders.Semin Clin Neuropsychiatry1996;1:48 – 60 25. Bruhn H, Kleinschmidt A, Boecker H, Merboldt K-D, Hnicke W,