Scientific reasoning vs multivariable causal inference
Scientific reasoning vs multivariable causal inference: Which route to take to improve learners' understanding of multivariable causality?
Boris Ney University of Twente Student number: 0153567
Learning Sciences (Instructie, Leren & Ontwikkeling) 1e Begeleider: Pascal Wilhelm
Abstract
This study aims to replicate the finding that isolating the effects of multiple independent variables step-by-step using the control-of-variables strategy (COV) does not lead to
understanding-of-multivariable-causality (UMC). The difference in learning gain between a scientific teaching instruction following a multivariable-causal-inference (MCI) approach and a scientific-reasoning (SR) approach was assessed. Additional posttest items measuring understanding of the multivariable structure of the task (UMST) were used to compare in how far both conditions were able to identify causal and non-causal independent variables. In a pre-posttest design twenty-three children were randomly assigned to one of the two
conditions. Both groups of learners progressed significantly, but a significant difference in learning gains between the two conditions was found, in favour of learners in the SR
condition. Scores on the additional posttest items nevertheless indicated that the learners had poor insights into the multivariable structure of the task with no differences between both conditions. In addition, COV-experts from both conditions had no above-average scores on these posttest items, indicating poor UMST. Results are discussed and limitations of the current study as well as alternative explanations for its findings are outlined, closing the article with suggestions for future research in this area.
Key words: Control-of-variables; multivariable causal inference; scientific reasoning; multivariable prediction; scientific teaching instruction
An important goal in nearly all U.S. and other countries’ national curriculum standards is the mastery of the scientific method (Abd-El-Khalick et al, 2007; National Research Council, 1996). Yet, it is neither clear what the scientific method actually implies nor which elements are pivotal to its understanding and use (Kuhn, 2005).
In the field of educational psychology, two lines of research can be distinguished. One involves the more developmental studies into scientific reasoning (SR), the other concerns studies into multivariable causal inference (MCI). Although very similar phenomena are studied in both fields, namely drawing inferences from data, they developed almost independently from each other (Kuhn & Dean, 2004). Generally, the difference between them is that in SR research data is generated by the learner. Effects of independent variables on dependent variables are isolated stepwise. In MCI, however, data is presented to the learner. By evaluating this data, the learner identifies causal and non-causal variables (Kuhn, 2007). Kuhn (2004) notes, that the theoretical scope in MCI research is rather broad opposed to SR research, where it is rather narrow, focusing on specific task domains. Albeit the broader theoretical scope in MCI research, it has been narrowly confined to college students. SR research addresses a wider range of adult and child populations (Kuhn, 2004).
The SR literature has a strong focus on the control-of-variables (COV) strategy
For example, Kuhn and Dean (2004) found that (pre) adolescents have difficulty in answering multivariable prediction (MVP) questions. In such questions, learners have to predict an outcome in a particular scientific domain based on different settings of independent variables. These questions serve as a measurement of participants’ understanding of
multivariable causality, indicated by gained insights into the multivariable structure of the task domain. Participants in Kuhn and Dean’s study correctly identified all influencing variables with the help of the COV beforehand, but their answers to MVP questions showed that they were unable to make valid predictions when two or more operative variables have a joint effect, which is referred to as the additivity principle. Furthermore, participants often made inconsistent predictions by stating in one question that variable A has an influence on an outcome, and in another question that variable B affects that same outcome. Their answers thus go against the so-called consistency principle.
Because of these violations of the additivity and consistency principles, Kuhn (2007) concludes that many learners have immature mental models of multivariable causality, despite mastery of COV strategy. Only when the learner is able to reason about such multiple effects s/he will become proficient in (multivariable) causal attribution and eventually in the
scientific method. Research on this matter is needed in order to find a way how
understanding of multivariable causality of learners might be enhanced. New instructional approaches are needed, examining which route to take in order to achieve proficiency in MCI reasoning in learners (Kuhn, 2007).
MVP questions, they may improve their understanding of multivariable causality (Kuhn, 2007).
With a different target group and setting, this study sought to replicate the finding of Kuhn (2007) that learners who acquire the COV strategy in a SR context fail on MCI tasks. One group of learners, the SR condition will follow the SR approach. Under guidance of the experimenter they will generate data themselves. Subsequently they have to answer
standardized questions which refer to the different effects of independent variables in the task at hand. Learners have to evaluate evidence and use the COV strategy in order to answer these questions.
Another group of learners will acquire the COV strategy in a MCI context. This group might benefit from exposure to multivariability and therefore develop a better understanding of the multivariable structure of the task domain, abbreviated as UMST in this article. This investigation follows a MCI approach (Downing, Sternberg & Ross, 1985); a whole data set is presented and the learner has to draw inferences about particular effects of the variables by carefully interpreting the data. This investigation is different from the typical SR approach that is used in the other condition, where the effects of variables are isolated experiment by experiment.
Presenting a whole set of experiments at the outset of the instruction may be more beneficial to developing UMST than building up this set experiment by experiment because the learner is exposed to all the data at once and has to actively search for the proper
Several studies have investigated the question of which instructional approach yields more learning gain in children. The results show that pure discovery learning and even minimal guided instruction, also called inquiry-based instruction, as well as problem based and experiential learning models might not be beneficial over other more guided approaches to learning, such as guided instruction or direct instruction (Kirschner, Sweller & Clark, 2006; Dean & Kuhn, 2006; Klahr & Nigam, 2004; Mayer, 2004). Students often seem confused and do not know how to stick to the task at hand; neither do they know when they are finished. Therefore, in this study instruction is fully guided by the experimenter.
Method Participants
Participants in this study were 23 sixth-graders (14 males) of a primary school in Neede, the Netherlands. Their mean age was 11.8 years (SD = .42), and they were randomly assigned to one of the two conditions; 12 participants were in the SR condition and 11 participants were in the MCI condition.
The participants were volunteers and never had any science education course, nor did they ever learn about the content of the learning task used in this study (pendulums and their swinging behaviour).
Materials
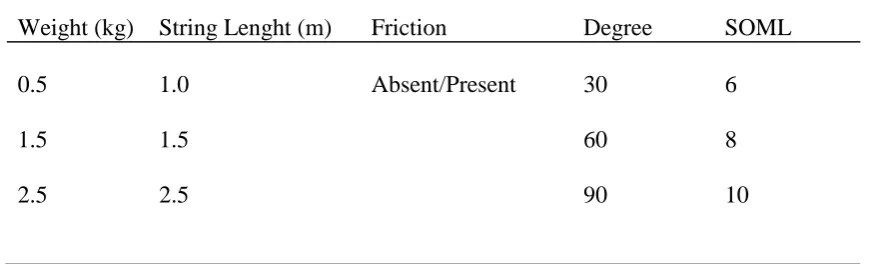
10 seconds, abbreviated as SOML. An overview of these values appears in Table 1. Even though the simulation included a more extensive set of values, the subset in Table 1 was used in this study to manage task complexity.
During the Domain Introduction, all participants received instruction material for the pretest. On four sheets of paper the different values for the different variables were displayed (see Table 1). An example of a question on the pretest was depicted on the fifth page,
followed by a stepwise description on how to handle each question on the pretest (see
[image:7.595.62.502.396.528.2]Appendix A). They could consult this instruction material throughout the entire investigation.
Table 1
Values for the Different Variables in the Pendulum Task
Weight (kg) String Lenght (m) Friction Degree SOML
0.5 1.0 Absent/Present 30 6
1.5 1.5 60 8
2.5 2.5 90 10
Note: SOML = Swing Over Mid Line Within 10 seconds
Cronbachs alpha, which is an internal consistency estimate of reliability of the test scores was considerably low, = .46, as was the coefficient of internal consistency using the Spearman-Brown prophecy formula, .18.
Posttest. The posttest consisted of 20 multiple choice questions, as well. In order to control for test effects and ensure comparability between pre and posttest, half of the questions in the posttest were identical to the ones in the pretest (but presented in a different order). Furthermore, five questions were taken out of the pretest and values were changed. However, these changes had no influence on the dependent variable because only values of non-causal variables were altered. The remaining five questions had the same form as all questions and only the values depicted in Table 1 were used. These questions were no more difficult than any other question; however, the combination of values of variables was unique and thus new to the participants.
All the participants received instruction material for the posttest. The first four pages of this instruction material were the same as in the pretest. However an example of the additional posttest items and a different description of how to handle each question on the posttest were additionally provided (see Appendix B).
Due to a negative average covariance among items, a reliability analysis could not been carried out for the post-test. Scores on the posttest therefore seem not to be internally consistent. Correlations among items were considerably low.
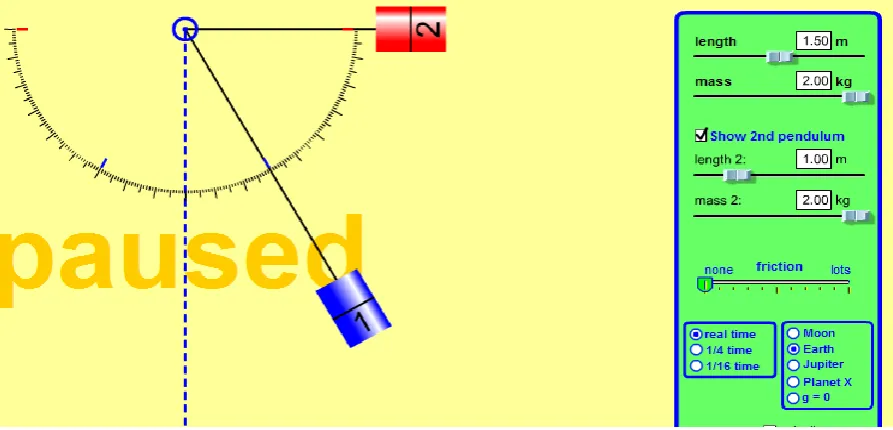
Figure 1 Example of a question on the posttest
1a) Which of the two pendulums will swing more often over the mid line within 10 seconds? A)Both pendulums will cross the mid line on an equal amount
B) Pendulum 1 will cross the mid line more often C) Pendulum 2 will cross the mid line more often D) I don’t know. Go on to the next question.
1b) Which variable(s) played no role on how often one of the two pendulums would swing over the mid line? Tick your answer or answers.
1. The weight 2. The degree 3. The string length 4. The friction
1c) Which variable(s) played a role on how often one of the two pendulums would swing over the mid line? Tick your answer or answers.
1. The weight 2. The degree 3. The string length 4. The friction
instructions was to teach participants the COV strategy and evidence evaluation skills. In the next two sections it is outlined how the two conditions differed from each other.
Table 2: Effects of Independent Variables in the Pendulum Task
Note: SOML = Swing Over Mid Line Within 10 seconds
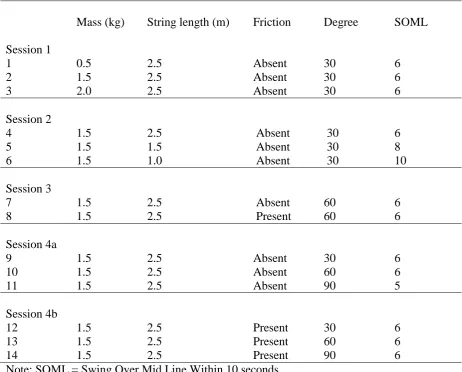
SR Condition. Participants in this condition were presented the pendulum simulation lab. At the beginning of the instruction the experimenter handed out four worksheets for four learning sessions. Every learning session consisted of set of experiments which aimed at uncovering the effects of the four variables on SOML, sequentially, by using the COV strategy and evidence evaluation skills. Table 3 gives an overview of all different experiments within each session during the two teaching instructions. As can be seen in Table 3, the sessions addressed the effects of the variables in the following order: (1) weight, (2) string length, (3) friction, (4a) degree and (4b) degree and friction. Because the variable friction is dichotomous only two experiments were carried out in Session 3. Session 4 first addressed the main effect of degree (4a) and then the interaction effect between degree and friction (4b), leading to a total of 6 experiments in this session.
Variable Effect Outcome
Weight Non causal No change in SOML
String length Causal 2.5m: 6 times
1.5 m: 8 times 1.0 m: 10 times
Friction Interaction if degree is 90 and
friction is present SOML + 1
Degree Causal if degree 30 or 60 no
During experimentation, the participants filled in the values the experimenter chose for the independent variables on the worksheet. Then, the simulation was started and the
experimenter held a stopwatch to measure 10 seconds. During these 10 seconds it was the participant’s task to count how often the pendulum swung over the mid line. After the experiment the participant filled in this number on the worksheet. If a participant failed to count correctly the experimenter gave the right answer.
When the experiments for one session were conducted the experimenter posed standardized questions (an overview of all experiments made within sessions appears in Table 3). The question referring to evidence evaluation was: „Considering these experiments, what can you tell me about the influence of ((1) weight, (2) string length, (3) friction, (4a) degree, (4b) friction and degree) on how often the pendulum swings over the mid line?” Subsequently, for every session the question referring to the understanding of the COV strategy was: “Why can you tell me that this feature ((1) weight, (2) string length, (3) friction, (4a) degree, (4b) friction and degree) has an/no influence on how often the pendulum swings over the mid line?”
MCI Condition. Participants in the MCI condition did not work with the pendulum lab simulation but were presented a whole dataset at the outset of the instruction. For the sake of comparability, this dataset was identical to the one used in the SR condition (see Table 3). Every experiment was presented on a separate sheet of paper and placed in random order in front of the learner. The procedure was as follows: participants were instructed which values belong to which variable so that they were able to “read” the data set. After this was clear, the experimenter posed the question which experiment sheets should be chosen to find out about the influence of a particular variable, following the same order as in the SR
Hints to choose the right sheets were given when needed. An example of an ideal hint to choose the right sheets referring to the influence of weight on SOML was: “You have to search for sheets where the values for weight differ. The values for degree, string length and friction should be the same. Which sheets could you choose?”. If a participant was unable to choose the right sheets, the experimenter picked the right experiments and then posed the same two questions as in the SR condition (see above).
In both conditions hints and/or explanations were given by the experimenter when the learner could not answer the evidence evaluation and/or COV questions posed. In order to illustrate this procedure, some examples of ideal answers to both questions and examples of hints given by the experimenter are outlined, followed by a description of the interview protocol used by the experimenter (consult Appendix C for a complete description of examples, hints, and explanations given during the instructions).
An example of an ideal answer to both questions (evidence evaluation and COV) referring to the influence of weight on SOML is: “As I can see that all values for all variables except weight do not differ and, realizing that SOML is not changing, I can conclude that
weight seem not to have an influence on SOML”.
This is an ideal answer as it includes that (1) SOML does not change regardless of differences in weight and that (2) one can conclude that weight has no influence on SOML, because all values for string length, degree and friction stay the same.
An example for a hint to the evidence evaluation question considering the influence of weight on SOML is: “Look closely at the values for weight. Now, look especially at how often the pendulum swung over the mid line.”
every experiment. This means that it does not matter how much weight hangs on the
pendulum. Thus, the correct answer here is that weight has no influence on SOML”.
Hints were given according to a strict protocol. When participants were unable to give an answer, gave incorrect answers, or simply seemed not to understand, the experimenter
explained why one can conclude that a particular variable has (no) influence on SOML. After every experiment in a session was picked or performed, the experimenter posed the first question referring to evidence evaluation (see above). The following protocol was used in both conditions:
1. If the participant answers both questions correctly, go to the next session. 2. If the participant does not answer correctly, is not clear in his formulations or
hesitates longer than 20 seconds, give the hint referring to evidence evaluation and pose the question again.
3. If the participant is still not able to answer, is not clear in his formulations or hesitates longer than 20 seconds, give the explanation to the first question referring to evidence evaluation and pose the second question.
4. If the participant answers the second question correctly, go to the next session. 5. If the participant answers the second question incorrectly, is not clear in his
formulations, or hesitates longer than 20 seconds, give the hint referring to COV and pose the question again.
6. Give the explanation to the second question if the participant is still not able to answer, is not clear in his formulations or hesitates longer than 20 seconds and go to the next session.
Table 3: Experiments per Session with Values for the Variables in the Pendulum Task
Mass (kg) String length (m) Friction Degree SOML Session 1
1 0.5 2.5 Absent 30 6
2 1.5 2.5 Absent 30 6
3 2.0 2.5 Absent 30 6
Session 2
4 1.5 2.5 Absent 30 6
5 1.5 1.5 Absent 30 8
6 1.5 1.0 Absent 30 10
Session 3
7 1.5 2.5 Absent 60 6
8 1.5 2.5 Present 60 6
Session 4a
9 1.5 2.5 Absent 30 6
10 1.5 2.5 Absent 60 6
11 1.5 2.5 Absent 90 5
Session 4b
12 1.5 2.5 Present 30 6
13 1.5 2.5 Present 60 6
14 1.5 2.5 Present 90 6
Note: SOML = Swing Over Mid Line Within 10 seconds
Procedure
The investigation took place during normal school hours within one week. In a whole-class session, the Domain Introduction was given to all participants; their teacher was present during this session. Participants were introduced to all variables in the pendulum task.
(1) identify the different values of the four variables for the two pendulums, (2) think about
your answer, (3) tick the answer you think it is right and go to the following question, and (4)
if you have answered all questions, please stay quite so that the others can finish the test. If
you really do not know the answer to a question tick “I don’t know” and go to the next
question.
After the pretest was administered the participants were randomly assigned to one of the two conditions (SR condition or MCI condition). On day two and three the participants were given the individual teaching instructions in a room at school. The sessions were audio recorded and transcribed. Before the posttest was administered, one day after the teaching instructions, the instruction material for the posttest was given to the participants (see
Appendix B). The experimenter explained how to handle the additional sub-questions on the posttest; the example provided in Figure 1 was described. After that the posttest was
individually administered with the following instructions displayed on a smart board: (1) identify the different values of the four variables for the two pendulums, (2) think about
your answer, (3) tick the answer you think it is right, (4) tick which variable(s) played no role
on how often one of the two pendulums would swing over the midline, (5) tick which
variable(s) played a role on how often one of the two pendulums would swing over the
midline. If you have answered all questions, please stay quite so that the others can finish the
test. If you really do not know the answer to a question tick “I don’t know” and go to the next
question.
Data Analysis
Sub-Questions on Posttest. The score on the Sub-Questions, serving as a measure for UMST, was calculated as follows. First the total number of variables ticked right and wrong on the Sub-Questions (A and B) on the posttest were calculated. After that, percentages of correctly ticked variables in total and by condition were computed and compared. Additionally the absolute values were used in order to perform a chi square test, examining whether there were differences between the two conditions.
Scores on teaching instruction. In order to compare the two conditions on the use of evidence evaluation skills and COV, scores on the scientific teaching instructions were calculated as follows: if a participant directly stated the right answer to one of the question s/he got a score of 1. If a participant needed a hint before giving the right answer s/he got a score of 2. Whenever a participant gave a wrong answer or no answer after the hint has been given s/he got a score of 3. The sum scores indicate how much help was needed by the participants in forms of hints or explanations from the experimenter. Participants were classified as experts of evidence evaluation and COV when they attained the minimum score of 10. Note that lower scores indicate better performance.
Results Learning gains
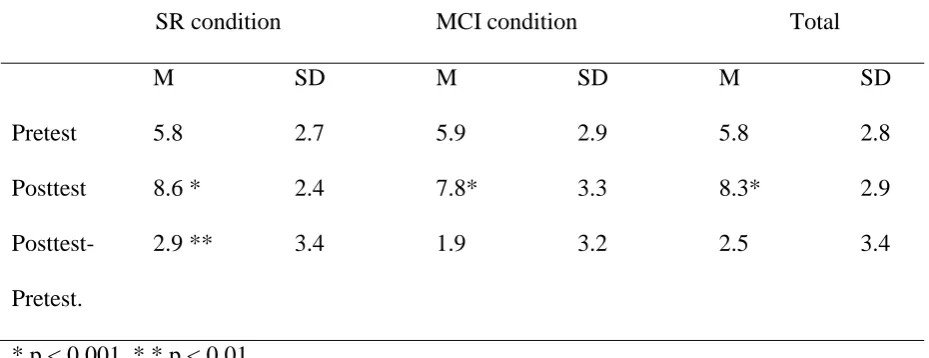
Posttest scores were consistently higher than the pretest scores (see Table 4). Learning gains from pretest to posttest were analyzed by paired sample t-tests. The entire-sample gain score was significant, t(22) = 16.2, and so were the separate analyses for the SR condition, t(11) = 13.9, and the MCI condition, t(10) = 8.9, p < 0.001.
To test whether there was a significant difference in learning gain between the two
[image:18.595.65.530.454.633.2]conditions an ANOVA was carried out with the gain scores as dependent variable. The result was significant, F (2, 22) = 10.3, p < 0.01, and the scores in Table 4 indicate that the SR condition scored approximately one point higher than the MCI condition. However, as the probability of Type II error was considerable, β = 0.89, the effect size was rather small, Cohen’s d < 0.2.
Table 4
Means and Standard Deviations for Pretest, Posttest and Posttest-Pretest
SR condition MCI condition Total
M SD M SD M SD
Pretest 5.8 2.7 5.9 2.9 5.8 2.8
Posttest 8.6 * 2.4 7.8* 3.3 8.3* 2.9
Posttest- 2.9 ** 3.4 1.9 3.2 2.5 3.4
Pretest.
* p < 0.001, * * p < 0.01
Analysis of scientific teaching instructions
An ANOVA revealed that there were significant differences between the two conditions on the duration of the scientific teaching instructions, F (2, 22) = 35.9, p < 0.001. Average
duration for the MCI condition was approximately two minutes longer than for the SR condition.
The minimum score (indicating excellent understanding) on the individual teaching
instructions was 10 which three of the participants attained. These three participants were thus classified as experts of evidence evaluation skills and COV. Maximum score (indicating poor understanding) was 24.
Unfortunately, the data of three participants, two of the SR condition and one of the MCI condition, on the individual session were incomplete. Therefore the scores of these
participants were not included in this analysis.
An ANOVA revealed that the scores on the scientific teaching instructions differ
significantly between the two conditions, F (2, 19) = 49.1, p < 0.001. Participants in the MCI condition score approximately four points higher than the SR condition on average.
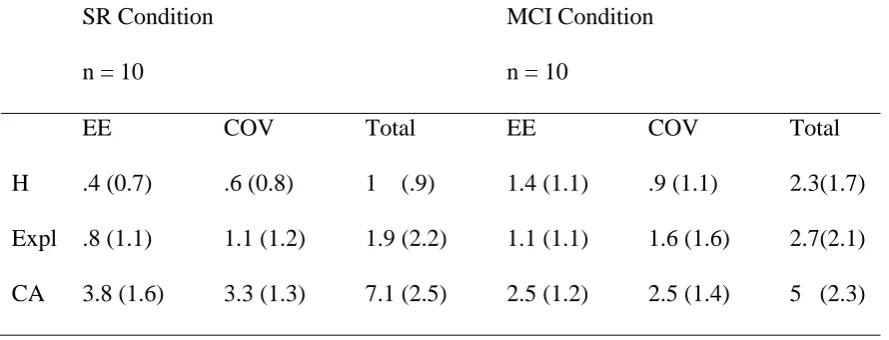
As Table 5 shows, the MCI condition needed more hints to answer questions referring to evidence evaluation as well as answers to questions referring to COV than the SR condition. The MCI condition also needed more explanation than the SR condition on both type of questions. This means that fewer questions were answered correctly in the MCI condition, without help of the experimenter.
An ANOVA was carried out in order to examine whether the number of hints and explanations needed and correct answers given were significantly different between the two conditions. No significant differences were found. The two conditions did not differ in the number of hints and explanations needed (F (2, 19) = 3.9, p = .07; F (2, 19) = .84, p = .37), and in the number of correct answers given (F (2, 19) = 3.8, p = .07).
Table 5: Averages of Correct Answers Given, Hints and Explanations Needed During Individual Session per Group
SR Condition MCI Condition
n = 10 n = 10
EE COV Total EE COV Total
H .4 (0.7) .6 (0.8) 1 (.9) 1.4 (1.1) .9 (1.1) 2.3(1.7) Expl .8 (1.1) 1.1 (1.2) 1.9 (2.2) 1.1 (1.1) 1.6 (1.6) 2.7(2.1) CA 3.8 (1.6) 3.3 (1.3) 7.1 (2.5) 2.5 (1.2) 2.5 (1.4) 5 (2.3)
Note: H = Hints
Table 6
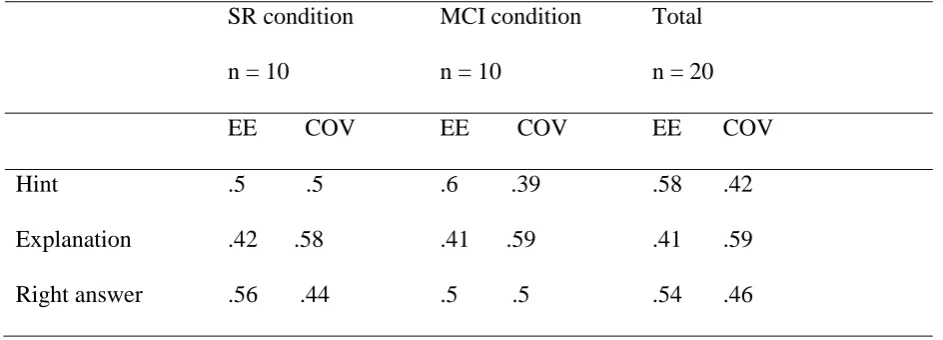
Fractions of Correct Answers Given, Hints and Explanations Needed During Individual
Session per Group
SR condition MCI condition Total
n = 10 n = 10 n = 20
EE COV EE COV EE COV
Hint .5 .5 .6 .39 .58 .42
Explanation .42 .58 .41 .59 .41 .59 Right answer .56 .44 .5 .5 .54 .46
Note: Values rounded to two decimals EE = evidence evaluation COV = control of variables
Sub-Questions on Posttest
Participants in the MCI condition were expected to score higher on the Sub-Questions. Table 7 shows the percentages of correctly and incorrectly ticked answers of all possible variables on the Sub-Questions on the Posttest. As a reminder, Sub-Question A asked the participant to tick variables which have no causal influence on SOML, whereas Sub-Question B asked the participant to tick the variables which have causal influence on SOML. Contrary to expectation, participants in the SR condition seemed to have ticked more variables
condition. However, a chi-square test on the MVP scores revealed no significant difference between the two conditions, X²(3, N = 1414) = 5.4, p= 0.14.
Table 7
Percentages of Correctly and Wrongly Ticked Variables on Sub-Question A and B
SR condition MCI condition
(n = 12) (n = 11)
TAC 54.76% (276) 48.27% (223)
TBC 44.08% (201) 40.67% (195)
TAW 33.33% (152) 34.45% (144)
TBW 23.02% (116) 28.57% (132)
Note: TAC = percentage of correctly ticked variables on sub-questions A TBC = percentage of correctly ticked variables on sub-questions B TAW = percentage of wrongly ticked variables on sub-questions A TBW = percentage of wrongly ticked variables on sub-questions B Absolute values in brackets
Experts of COV.
the expectation is that these participants would be more proficient in identifying causal and non-causal variables on the posttest; they should score higher on the Sub-Questions. When examining the difference scores of these participants, which is a measure for learning gain, it is striking that all experts made substantial progress on the pendulum task. They all scored above the average learning gain for both conditions, which was 2.5 (see Table 8). One of them answered 4, two answered 7, and one, the expert from the MCI condition answered 8 answers more correctly on the posttest than on the pretest.
Table 8
Percentages of Correctly and Wrongly Ticked Variables on Sub-Question A and B for
Experts, per condition and total.
7E 8E 12E 3EE SR condition MCI condition Total
n = 9 n = 10 n = 19
TAC 88.1 47.6 33.3 69.0 54.2 46.2 50
TBC 52.6 50 39.5 52.6 43.0 39.5 39.8
TAW 47.4 23.7 34.2 57.9 32.8 32.1 32.4
TBW 11.9 7.1 28.6 33.3 25.4 28.1 26.8
Note: TAC = percentage of correctly ticked variables on sub-questions A TBC = percentage of correctly ticked variables on sub-questions B TAW = percentage of wrongly ticked variables on sub-questions A TBW = percentage of wrongly ticked variables on sub-questions B
Conclusions/Discussion
The main goal of this study was to replicate the finding that isolating the effects of independent variables step-by-step using the COV strategy does not lead to improvement in UMC. It was hypothesized that participants in the MCI condition would attain higher learning gain than participants in the SR condition. Moreover participants in the MCI
Experts of COV and evidence evaluation skills were expected to obtain above average
learning gains and to be more proficient in identifying causal and non-causal variables. Although learning gain was significant in both conditions, scores on the Sub-Questions revealed that the learners’ UMST was still far from perfect. This replicates Kuhn’s (2007) findings. Learners in the MCI condition also progressed in their understanding of the task domain, but to a significant lesser extent than learners in the SR condition, and were
comparable in their level of UMST. Therefore the hypothesis that a MCI approach would lead to a better UMST was not supported. Possible explanations and limitations for the findings, practical implications for future research, and conclusions are outlined next.
The first hypothesis was not supported by the results, because participants in the MCI condition had a lower learning gain than participants in the SR condition. However, although participants in the SR condition scored significantly higher on the posttest, the difference with the MCI condition was only one point higher on average. Furthermore the effect size was small as well, which might be due to the small sample size in this study.
Besides issues of time on and difficulty of the task, which are discussed below, an
important reason for the small difference in learning gain between the SR and MCI condition might be that the MCI-investigation was too closely related to the SR-approach. Participants had to actively search the whole data set, however, after selecting the right experiments, the focus then shifted to questions referring to individual effects of variables, but not on
domain. Because every effect of every variable and the relationship between them would get included in such a concept map, it might improve participant’s UMST and maybe even UMC in general.
The MCI condition did not perform better on the Sub-Questions on the posttest than the SR condition. Significant differences between the two conditions on answering the Sub-Questions on the posttest were not found, which is why the second hypothesis was not supported. Bearing in mind that the MCI condition did worse on the scientific teaching instructions it seems that the MCI condition had no benefit from being exposed to the whole data set right at the beginning of the investigation in terms of improvement in UMST, opposed to the SR condition. The participants in the MCI condition had more difficulty with the scientific teaching instruction following the MCI approach than the participants following the SR approach indicated by the significant differences of the scores on the teaching
instructions. However amounts of hints, explanations needed and correct answers given during the teaching instruction did not differ significantly between the two conditions. Even the participants classified as Experts, regardless of condition, were not proficient in identifying causal and/or non-causal variables. Their UMST seem not be significantly better with respect to lower scoring participants. So, if even experts of COV and evidence
evaluation are not able to proficiently identify causal and non-causal variables the question which instruction to follow to improve UMC and foster MCI ability remains.
Generally, learning gain was significant in both conditions, however relatively small with a maximum of three questions answered more correctly on the posttest than on the pretest. The reason for this may have different roots. First of all pre and posttest appeared not to be internally consistent. It might therefore be that these tests do not measure the
reliable and valid measures should get developed, maybe using other task domains in order to measures learners UMC.
Secondly, the development of a proper scientific mental model, which is an internal model of someone’s thought processes of how things work in the real world, is a long enduring process and develops gradually (Dean & Kuhn, 2007). Participants in this study never had any science course, which is why their scientific mental models may not have been fully
developed, yet. Thirdly, the short duration of the investigation might be of concern when interpreting the results. Participants in both conditions simply may not have received enough teaching time. The teaching instructions were held only once, what might be too short time for children to really learn, understand and internalize the effects of the variables in the pendulum task. Duration of the individual scientific teaching instructions were significantly longer for the MCI condition, because the time needed to select the right experiments was longer than performing the experiments, as it was the case in the SR condition. It could be that learners in the MCI condition had difficulty answering the questions, because they might have experienced a high internal load, by being exposed to the whole data set right at the beginning of the investigation. Furthermore, the time between the posttest and the teaching instructions, which was one day, might have been too long.
Another possible explanation for the low learning gain, may be that the task at hand was more difficult opposed to the ones used in Kuhn’s study, because it contained an interaction effect which was not present in Kuhn’s study. Thus, the question remains whether there was not enough teaching time or whether the effects of the variables in the task were too difficult to grasp for the participants. An interaction of both factors might be the most reasonable explanation.
focus on the question to what extend participant’s ability to identify causal and non-causal variables before and after the investigation improved. Future research should use a pre- posttest design, in order to examine whether participants improved their UMST.
Kuhn (2005) notes that narrowing the focus to only one explanatory variable in a task, besides others which are also influential, may constrain explanation, because participants tend to shift their focus to this variable only, neglecting other influential variables. Despite Kuhn’s notion it might be beneficial to introduce tasks or assignments where indeed only one variable plays an influential role on the outcome, subsequently, joint, and still later, interaction effects could be examined on a higher level of the trajectory. This has also been done in this study. However, it might be that the effects of the variables were presented to fast, giving the
participants too less time to interpret and build upon the knowledge they gained. It might have been beneficial to grant participants more time on considering non-causal effects, for
example. Later on, maybe a week later, main effects could get discussed and still later interaction effects may get examined; thereby gradually building upon learner’s level of understanding.
References
Abd-El-Khalick, F., BouJaoude, S., Duschl, R., Lederman, N., Mamiok-Naaman, R.,
Hofstein, A., Niaz, M., Treagust, D., & Tuan, H. (2004). Inquiry in science education: International perspectives. Science Education, .88 (3), 397–419.
Dean, D. JR., Kuhn, D. (2007). Direct Instruction vs. Discovery: The Long View. Science Education, .91(3), 384-397.
Downing, C. J., Sternberg, R. J., Ross, B. H., (1985). Multicausal inference: Evaluation of evidence in causally complex situations. Journal of Experimental Psychology: General, 114(2), 239-263.
Kirschner, P. A., Sweller, J., Clark, R. E., (2006). Why Minimal Guidance During Instruction Does Not Work: An Analysis of the Failure of Constructivist, Discovery, Problem-Based, Experiential, and Inquiry-Based Teaching. Educational Psychologist, . 41(2), 75-86.
Klahr, D., Nigam, M., (2004). The Equivalence of Learning Paths in Early Science: Instruction Effects of Direct Instruction and Discovery Learning. Psychological Science, 15 (10), 661-667.
Kuhn, D., Pease, M., (2008). What Needs to Develop in the Development of Inquiry Skills? Cognition and Instruction, 26 (4), 512-559.
Kuhn, D., (2007). Reasoning About Multiple Variables: Control Of Variables Is Not The Only Challenge, Science Education, 91 (5), 710-726.
Kuhn, D., (2005). Education for thinking. Cambridge, MA: Harvard University Press. Kuhn, D., Dean JR, D., (2004). Connecting Scientific Reasoning and Causal Inference,
National Committee on Science Education Standards and Assessment; National Research Council, (1996). The National Science Education Standards. Washington, DC: National Academies Press.
University of Colorado at Boulder, Interactive simulations, (2011). retrieved march 2011 http://phet.colorado.edu/en/simulation/pendulum-lab
Appendix A
Instruction Material for the Pretest, Given During the Domain Introduction
The Pendulum Task
1. Mass = weight which hangs on the pendulum. The weight can be 0,5; 1,5 of 2 Kilogram
0,5 Kilo 1,5 Kilo 2,0 Kilo
2. Length= the string length
The string length can be 1,0; 1,5 of 2 meter
3. Degree = degree from which the pendulum gets dropped. The value of Degree can be 30, 60 or 90 degree.
30 degree 60 degree 90 degree
4. Friction = friction at the pivot
In the picture the pivot is shown. The pendulum can get stuck here and friction occurs.
The friction can be (a) absent of (b) present.
Example:
Slinger Mass String length Degree Friction
1 2,0 1,0 60 Present
2 0,5 2,5 30 Present
“Pendulum 1 has a weight of 2 kilo, a string length of 1 meter and gets dropped from 60 degree.
Pendulum 2 has a weight of 0.5 kilogram, a string length of 2.5 meter and gets dropped from 30 degree.
On the first test you have to work according to the following stepwise description: 1. Identify the different values of the four variables for the two pendulums.
2. Think about your answer.
3. Tick the answer you think it is right and go to the following question.
4. If you have answered all questions, please stay quite so that the others can finish the test.
Appendix B
Instruction Material for the Posttest
The Pendulum Task
1. Mass = weight which hangs on the pendulum. The weight can be 0,5; 1,5 of 2 Kilogram
0,5 Kilo 1,5 Kilo 2,0 Kilo
2. Length= the string length
The string length can be 1,0; 1,5 of 2 meter
3. Degree = degree from which the pendulum gets dropped. The value of Degree can be 30, 60 or 90 degree.
30 degree 60 degree 90 degree
4. Friction = friction at the pivot
In the picture the pivot is shown. The pendulum can get stuck here and friction occurs.
The friction can be (a) absent of (b) present.
Example of a question on the posttest:
1a) Which of the two pendulums will swing more often over the mid line within 10 seconds? A)Both pendulums will cross the mid line on an equal amount
B) Pendulum 1 will cross the mid line more often C) Pendulum 2 will cross the mid line more often D) I don’t know. Go on to the next question.
1b) Which variable(s) played no role on how often one of the two pendulums would swing over the mid line? Tick your answer or answers.
5. The weight 6. The degree 7. The string length 8. The friction
1c) Which variable(s) played a role on how often one of the two pendulums would swing over the mid line? Tick your answer or answers.
Slinger Mass String length Degree Friction
1 2,0 1,0 30 Absent
2 2,0 1,5 90 Absent
“Pendulum 1 has a weight of 2 kilo, a string length of 1 meter and gets dropped from 30 degree.
Pendulum 2 has a weight of 2 kilo, a string length of 1.5 meter and gets dropped from 90 degree.
The friction is absent for both pendulums.”
On the second test you have to work according to the following stepwise description: 1. Identify the different values of the four variables for the two pendulums.
2. Think about your answer.
3. Tick the answer you think it is right and go to the following question.
4. Tick which variable(s) played no role on how often one of the two pendulums would swing over the mid line
5. Tick which variable(s) played a role on how often one of the two pendulums would swing over the mid line
6. If you have answered all questions, please stay quite so that the others can finish the test.
Appendix C
Examples of Ideal Answers, Hints, and Explanations Given During the Scientific Teaching
Instructions
An example of an ideal answer to the question referring to evidence evaluation considering the influence of weight on SOML is:
“There is no change in SOML, so weight seems not to have an influence on SOML.”
An example of an ideal answer to the question referring to COV considering the influence of weight on SOML is:
All values for all other variables, but weight stay the same, also SOML. Only the values for
weight change. This is why I conclude that weight seems not to have an influence on SOML.
An example of an ideal answer to both questions (evidence evaluation and COV) referring to the influence of weight on SOML is:
As I can see that all values for all variables except weight do not differ and, realizing that
SOML is not changing, I can conclude that weight seem not to have an influence on SOML.
This is an ideal answer as it includes that (1) SOML does not change regardless of differences in weight and that (2) one can conclude that weight has no influence on SOML, because all values for string length, degree and friction stay the same.
An example for a hint to the evidence evaluation question considering the influence of weight on SOML is:
Look closely at the values for weight. Now, look especially at how often the pendulum swung
over the mid line.
An example for a hint to the COV question considering the influence of weight on SOML is:
Take a look at the values for string length, degree and friction. Now take a look at the values
Explanations given by the experimenter could refer to evidence evaluation questions or to both. An example for an explanation referring to the evidence evaluation question considering the influence of weight on SOML is:
The values for weight differ from experiment to experiment. However, SOML does not change. So weight does not seem to have an influence on how often the pendulum swung over
the mid line, SOML.
An example for an explanation referring to both questions (evidence evaluation and COV) considering the influence of weight on SOML would be:
All values in all experiments, except the ones for weight are the same. The pendulum swings
six times over the mid line in every experiment. This means that it does not matter how much
weight hangs on the pendulum. Thus, the correct answer here is that weight has absolutely no