1
Multi-Composition-EPSR: Towards Transferable Potentials To Model
Chalcogenide Glass Structures.
James J. Towey and Emma R. Barney*
Faculty of Engineering, University of Nottingham, University Park, Nottingham, NG7 2RD
*Corresponding Author e-mail: [email protected]
Telephone: +44 (0)115 74 84674
Abstract
The structure of xAs40Se60-(1- x)As40S60 glasses, where x = 1.000, 0.667, 0.500, 0.333, 0.250 and 0.000, are investigated
2
1.
Introduction
It has been widely reported that atomic scale oscillations of molecular bonds can strongly absorb specific wavelengths of light in the mid infra-red (mid-IR) region of the electromagnetic spectrum (3-12 µm). This means that the presence of compounds of interest can be identified, and quantified, by using spectroscopy to measure these absorptions, often referred to as “molecular fingerprints” 1-2. Studies have shown that a wide range of organic molecules, from toxic
agents 3 and greenhouse gasses 4 to biological tissue 5 and beer 6, can be identified using their characteristic molecular
vibrations. Unfortunately, the current ability to exploit this spectroscopic technique is limited by the lack of off-the-shelf mid-IR optics 2. New IR sources, guides and detectors are required in order to harness the potential of
mid-IR light for real-time, remote sensing 1. In recent years, glass fibres based on chalcogen elements (S, Se and Te) have
been proposed as prospective candidates for these technologies due to their ability to transmit, and interact with, mid-IR light 1-2, 7.
Chalcogenide glasses have long been known to possess optical properties that make them attractive potential materials for use in mid-IR spectroscopy applications 7. They transmit light from 2-10 µm and possess a range of other
favourable qualities, including good thermal stability and resistance to crystallisation, that facilitate the shaping and manufacture of the glass into fibres and waveguides. Furthermore, the broad concentration range over which chalcogenide glasses form offers exciting possibilities for tailoring properties via compositional development 7-10. To
successfully exploit As40Se60-As40S60 glasses as materials for mid-IR optical fibres it is necessary to be able to control
the physical properties. Understanding the composition-structure-property relationships that govern this system would enable glasses with specific functional properties to be designed. However, fully exploring and characterising the glass forming regions is both time consuming and costly. As such, device development has been limited to a small number of glass compositions that are known to provide suitable functional properties. This investigation builds upon recent work carried out by the authors using a number of different structural techniques to characterise a series of stoichiometric As40Se60-As40S60 glasses 11. The current work is motivated by the desire to build computational structural
models of these glasses to understand the effect of composition on their short and medium range order. These models can then be used to explore the links between glass structure and macroscopic properties, investigating the validity of conclusions drawn by Barney et al. 11. The ultimate goal is the development of a robust and reliable methodology for
predicting the structure of a chalcogenide glass composition via computational modelling. Success would enable glass properties to be estimated from the structural motifs predicted, without the investment in time and resources to melt and characterise the glass. In this way, it would be possible to focus compositional development on areas of the glass forming region most likely to yield glasses with the desired properties.
A number of chalcogenide glasses have been studied using computational modelling, including two glass compositions of interest here, As40Se60 and As40S608, 12-17. Many of these computational studies have used Molecular Dynamics (MD)
3 motion. The movement of the atoms within the simulation is controlled by the interaction potentials that provide the force field. Broadly speaking, the different methods of calculating these force fields can be split in to two groups, classical and quantum mechanical (QM). Classical simulations use empirically derived force fields while QM simulations obtain the potentials directly from calculations of the Schrödinger equation associated with the system being studied. As a result, QM simulations are more computationally costly than classical MD, due to the level of calculation required, but can provide an interesting insight into the structure of small systems. There have been a number of studies in the literature using ab initio QM MD approaches to model As40Se60 and As40S60 in both amorphous 8, 12, 14-21 and liquid 16, 22-23 states. The models for these studies have ranged in size from 80 to 200 atoms, and the general consensus is that
~16% of Se bonds are homopolar. This is consistent with 77Se MAS NMR results for GeSe
2 published by Gjersing et al. 24, but it is not consistent with the 77Se MAS NMR results recently published by the authors for As
40Se60 11, which
showed no peak arising from Se-Se bonds.
Another widely used simulation technique is the Monte Carlo (MC) method. MC simulations rely on random movement of the atoms in the simulation. These moves are then accepted or not based on criteria prescribed by the type of simulation that is being run. In standard MC studies the moves are accepted based on whether or not they lower the potential energy of the system. This technique was employed by Mauro and Varshneya 15, who used a combination of
QM interatomic potentials and Metropolis MC simulations to study two arsenic selenide glass compositions. However, the success of this work was limited. The fraction of arsenic atoms that were 3 coordinated was only ~60%, with a correspondingly low number of 2 coordinated Se atoms (45%) 15. Bauchy and Micoulaut later compared the published
simulated structure factors with experimental data to show poor agreement 12. The lack of agreement between
simulation and experiment is a major drawback for both MD and standard MC studies. Indeed, it is often sufficiently poor that the results are unconvincing 8, 15 and too disparate to allow competing structural models to be tested reliably 17. In some cases the simulations are not tested against experimental data at all 16.
One way to avoid the problem of inconsistency between simulation and experiment is to use methods such as Reverse Monte Carlo (RMC). Unlike the simulation techniques outlined above, RMC does not require appropriate interatomic potentials to produce the simulation. Instead, a trial and error method of modifying the atomic coordinates is used and movements are accepted based on whether or not they improve the agreement of the simulation with experimental data 25. The lack of interatomic potentials dramatically reduces the computational time required to
perform these simulations and allows significantly larger simulation sizes to be conducted than are possible with other simulation studies. Typical simulation boxes will contain between 5,000 13 – 20,000 14 atoms. Previous RMC simulations
of chalcogenide glasses have had mixed success. Fabian et al 26 studied As
40Se60 glasses and found that both the arsenic
and selenium atoms have lower average coordination numbers than expected; 2.6 and 1.8 rather than 3 and 2. However, Kaban et al 14 had more success simulating As
40S60 glasses, obtaining coordination numbers of 2.94 (As) and
lone-4 pair electrons, such as are found on arsenic atoms, are crucial for understanding glass structures and functional properties 27-28. A further drawback for this modelling method is that it is reliant on experimental data and cannot be
used to predict the structure of new glass compositions.
This study seeks to use a simulation technique, Empirical Potential Structure Refinement 29 (EPSR), which provides a
structure that is consistent with the experimental results, and allows inter-atomic potentials to be included. EPSR is a form of RMC simulation, which uses inter-atomic potentials to produce an approximate model of the system. These potentials are then iteratively modified until agreement between the simulation and experimental data is reached. EPSR has traditionally been used to probe aqueous systems, where contrast from isotopic H/D substitution can be easily obtained to help guide the simulation to chemically reasonable solutions 30. There have, however, been several
proof of concept studies of glass structure 27, 31-35. Of particular note is the work of Soper 33, who investigated the
presence of homopolar Se-Se bonds in GeSe2, and Alderman et al. 27 who used dummy lone-pair atoms to simulate
steric environments for lead atoms in a PbO-SiO2 glass. In the present study, EPSR has been used to probe the structure
of stoichiometric As40Se60-As40S60 glasses. This is the first report to systematically develop computational models for a
series of chalcogenide glasses across a compositional range (in this case As40Se60 to As40S60). To produce chemically
reasonable structural models, the investigation has built upon the work of Soper 33 and Alderman et al. 27 but has
implemented a new methodology for EPSR which builds a single set of potentials that are consistent with all the data sets available.
5
2.
Methodology
2.1.
Sample preparation and characterisation
A series of xAs40Se60-(1- x)As40S60 glasses where x = 1.000, 0.667, 0.500, 0.333, 0.250 and 0.000 (see Table 1) have been
included in this study and the sample preparation and characterisation have previously been reported by Barney et
al.11. The neutron structure factors presented here were measured using the GeM diffractometer 36 at the ISIS Pulsed
Neutron and Muon Source (Rutherford Appleton Laboratory, Oxfordshire, UK). The data were collected for as-annealed glass rods held inside cylindrical vanadium containers, of inner diameter 10 mm. These vanadium containers were thin-walled, with a thickness of 25 μm, in order to reduce the magnitude of the experimental corrections required. Gudrun 37 and ATLAS 38 software were used to normalise the data using a calibration measurement of an 8
mm vanadium rod. The data were also corrected for attenuation, multiple scattering and scattering from the sample container and the empty instrument to give the distinct scattering spectra, 𝐹N(𝑄). 𝐹𝑁(Q), is given by the summation of the partial structure factors, 𝑆𝛼𝛽(𝑄), weighted by the concentration, 𝑐, and scattering length, b, of the relevant pair of atoms α and β.
𝑭𝑵(𝑸) = ∑ 𝒄 𝜶
𝜶𝜷 𝒄𝜷𝒃𝜶𝒃𝜷(𝑺𝜶𝜷(𝑸) − 𝟏) (1) The X-ray data were collected at the Diamond Light Source (Rutherford Appleton Laboratory, Oxfordshire, UK) using the I15 beamline optimised for the collection of PDF data. The photon energy used for the experiment was 73 keV. The samples were powdered and placed in 1 mm diameter silica capillaries, and the scattering was detected using a Perkin Elmer 2D flat panel 1621 detector. The 2D data were reduced to 1D using Fit2D 39-40 and were corrected for
detector attenuation following the method detailed by Skinner et al. 41. The 1D data were normalised using the
Krohe-Moe and Norman method 42-43 and corrected for attenuation, multiple scattering and scattering from the sample
container and the empty instrument using GudrunX 44 to produce the sharpened distinct scattering spectra, 𝐹X(𝑄). In
an analogous manner to 𝐹N(𝑄), 𝐹𝑋(𝑄) is defined as,
𝑭𝑿(𝑸) = ∑ 𝒄 𝜶
𝜶𝜷 𝒄𝜷𝒇𝜶(𝑸)𝒇𝜷(𝑸) (𝑺𝜶𝜷(𝑸)) (2) where, 𝑓𝛼(𝑄) is the atomic form factor for atom α. All the EPSR fits were made to 𝐹N(𝑄) and 𝐹X(𝑄). However, for ease of interpretation, the results have been shown in real-space. To achieve this, 𝐹N(𝑄) and 𝐹X(𝑄) were Fourier transformed using the Lorch modification function 45 and a maximum momentum transfer, Q
max, of 35 Å-1for neutron
and 25 Å-1for X-ray data. This yielded the total radial distribution functions, 𝐺(𝑟), defined as,
6
𝒏𝜶𝜷 = 𝟒𝝅𝝆𝒄𝜷∫ 𝒓𝟐𝒈
𝜶𝜷(𝒓)𝒅𝒓 𝒓𝒎𝒂𝒙
𝒓𝒎𝒊𝒏 (5)
where 𝜌 is the atomic number density of the system, 𝑐𝛽 is the proportion of atoms of type 𝛽 in the system and 𝑟𝑚𝑖𝑛 and 𝑟𝑚𝑎𝑥 are the radial limits of the integration. To extract coordination numbers for arsenic, sulfur and selenium nearest neighbours, 𝑟𝑚𝑖𝑛 values were set to 1.00 Å and 𝑟𝑚𝑎𝑥 was defined as the position of the minimum following the first peak in the relevant partial RDF (2.79-2.88 Å for each of the As-S and As-Se correlations studied). The average arsenic-chalcogen coordination number, 𝑛𝐴𝑠𝐶ℎ, for a particular composition is given by the sum of 𝑛𝐴𝑠𝑆 and 𝑛𝐴𝑠𝑆𝑒 while the chalcogen-arsenic coordination number, 𝑛𝐶ℎ𝐴𝑠, is calculated as,
𝒏𝑪𝒉𝑨𝒔 = (𝑿 ∙ 𝒏𝑺𝒆𝑨𝒔) + ([𝟏 − 𝑿] ∙ 𝒏𝑺𝑨𝒔) (6)
A key factor to consider when producing simulations for glass structures based upon scattering data is the scattering lengths of the atoms in the system. The total scattering functions (Equations (1) and (2)) are comprised of a weighted sum of all of the pair correlations found in the glasses. In the neutron measurement the scattering lengths, b, of arsenic, sulfur and selenium are 6.58, 2.85 and 7.97 fm respectively, while the X-ray form factors (𝑓𝛼(0)) are 33, 16 and 34. In both cases, the signals from the Se correlations are much stronger than from S correlations, giving little contrast between the two techniques. To compensate for the weak scattering from sulfur, an extra, sulfur-rich, sample (x=0.250) was included in the analysis to give an asymmetric concentration series (Table 1).
2.2.
EPSR methodology
EPSR is a form of Monte Carlo simulation that utilises an iterative algorithm to produce a 3-dimensional atomic structure consistent with experimental diffraction data 29, 46-48. Traditionally, EPSR has been used to investigate
aqueous systems (see for example 30, 49); however ionic liquids 50 and glassy systems 27 have also been studied. This
versatility is achieved due to EPSR being a purely structural technique. The dynamical properties of the models are not considered and, therefore, a glass is essentially indistinguishable from a liquid sample. To simulate a structure, an initial interatomic reference potential, 𝑈𝑟𝑒𝑓, for each atom pair present is required. These take the form of a combination of a Lennard-Jones and Coulomb term and are defined as,
𝑼𝒓𝒆𝒇(𝒓
𝒊𝒋) = 𝟒𝝐𝜶𝜷[(𝝈𝒓𝜶𝜷 𝒊𝒋)
𝟏𝟐
− (𝝈𝜶𝜷 𝒓𝒊𝒋)
𝟔
] + 𝒒𝜶𝒒𝜷
𝟒𝛑𝝐𝟎𝒓𝒊𝒋 (4)
7
2.3.
Determining starting potentials,
𝑼
𝒓𝒆𝒇.
Literature potentials were not used as a starting point for the present study because they were not deemed to be consistent with structural measurements (e.g. 8, 15). Therefore, initial interatomic potentials for As, Se and S were
obtained via a trial and error approach. The selected parameters, given in Table 2, were chosen to reproduce the first peak positions in the total radial distribution functions ,𝐺(𝑟), after thermalisation. This approach has previously been applied successfully to simulate the structure factors for lead silicate 27 and germanium selenide 48 glasses. As shown
in Figure 1a, the final structural model reproduces the position of the first peak in G(r)at ~2.35 Å but fails to reproduce the data at longer distances. In addition to simulating the correct bond lengths, the results were also required to be consistent with the spectroscopic results from a recent study of As40Se60-As40S60 glasses 11. Barney et al. used Raman
spectroscopy to show the lack of S-S bonding and 77Se NMR studies to show that the selenium atoms are mainly found
in [AsCh3] units 11. To enforce the absence of homopolar bonds, minimum approach distances (Rmin values, given in
Table 3) were included in the reference potentials.
2.4.
Traditional EPSR simulation of As
40Se
60-As
40S
60glasses and the need for
a new technique
Initial models for the six As40Se60-As40S60 glasses were generated using T-EPSR. The first stage of the procedure was to
carry-out an energy minimisation of simulation boxes containing 5,000 atoms in the correct ratio of As, Se and S for each composition (Table 1). Then, using the finalised values for 𝑈𝑟𝑒𝑓 (Table 2), a thermalisation was performed for each of the glass compositions individually. The simulated structure factors for each composition were then compared to the corresponding experimental 𝐹N(𝑄) and 𝐹X(𝑄). To minimise the difference between the simulated RDFs and the experimental data a set of empirical terms were generated to modify 𝑈𝑟𝑒𝑓. In this way, an iterative refinement to the inter-atomic interactions was made for each composition; additional empirical potentials were applied to the atom potentials until an optimised agreement between model and experiment was achieved for each individual composition (see Scheme 1). The effect of modifying 𝑈𝑟𝑒𝑓 with empirical potentials can be appreciated by comparing the initially simulated neutron and X-ray radial distribution functions, 𝐺(𝑟), for As40Se30S30 in Figure 1a with the refined 𝐺(𝑟)s for
the same composition, shown in Figure 1b. In the latter, the simulated 𝐺(𝑟)s more fully reproduce the experimental
𝐺(𝑟)s on all length scales. A similar quality of fit was found for each composition (see Supplementary Information, Figure S1). Once this level of agreement is achieved is it possible to interrogate an ensemble of atomic structures that are consistent with the experimental data for insights into the glass structure 29.
An initial analysis of the six simulations produced using T-EPSR was performed by examining the first peaks in the As-Ch partial radial distribution functions, 𝑔AsCh(𝑟). All the As-Ch partials are shown in Supplementary Information, Figure S2. The positions of the first 𝑔AsCh(𝑟) peaks for the binary glasses, 2.28 Å and 2.40 Å for As40S60 and As40Se60
respectively, were consistent with previous X-ray diffraction studies of As40S60 (2.26 Å 14) and As40Se60 (2.42 Å 26) glasses
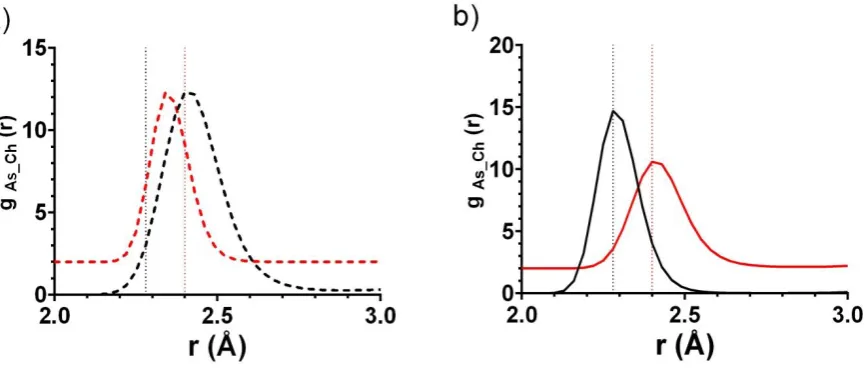
8 length of 2.39 Å. However the peak positions obtained for the ternary glasses were unsatisfactory. Figure 2a shows the simulated nearest neighbour peaks for the arsenic-sulfide (As-S; black dashed line) and arsenic-selenide (As-Se; red dashed line) correlations in As40S30Se30 along with dotted lines corresponding peak positions for the S and
As-Se bond lengths found in the simulations of As40S60 and As40Se60. The positions of the As-S and As-Se peaks in As40S30Se30
are representative of 𝑔AsCh(𝑟) for all four ternary glasses s, having an As-Se bond length (2.28-2.37 Å) that is shorter than the As-S bond (2.34-2.46 Å), in direct disagreement with the bond lengths extracted from the simulations for As40S60 and As40Se60 glasses. Therefore, the simulations produced using T-EPSR for the ternary glass compositions were
inconsistent with both the simulations for the binary glasses and the chemical understanding of As-Se and As-S bonds. In conclusion, T-EPSR was not sufficiently constrained by the combination of diffraction data and reference potentials to yield refined reference potentials able to produce reliable structures for individual ternary glasses.
2.5.
Development of the Multi-Composition EPSR methodology
To successfully generate physically reasonable models for the As40Se60-As40S60 glass system, it was necessary to
increase the number constraints on the simulations. When considering potential methods to introduce new constraints to the data, it was noted that EPSR was able to simulate As-Ch bond lengths for As40S60 and As40Se60 that
were consistent with bond valence calculations. Therefore, it would be advantageous to incorporate the atomic potentials refined for these two glass compositions into the simulations for the more complex ternary glasses. The methodology used to achieve this, Multi-Composition EPSR (MC-EPSR), is shown in Scheme 2. The aim of MC-EPSR is to produce a single set of empirically derived pair potentials which generate simulations consistent with experimental data for a range of glass compositions (i = 1 to n). This is accomplished by using the difference between the experimental and simulated structure factors for composition i to modify the potentials for composition i + 1. The difference between the simulation and experimental data for composition i + 1 is then used to modify the potentials for concentration i + 2 and so on. By iterating this procedure cyclically, an equilibrium is reached in which a) each individual structure factor is successfully simulated by MC-EPSR while b) ensuring that the As-S and As-Se bond lengths in every simulation are consistent with those measured experimentally for the binary glasses. In this way, MC-EPSR produces a single set of potentials that are able to produce structures consistent with experimental data for any composition across those studied.
MC-EPSR was run twice for the data sets in the As40Se60-As40S60 system using two different configurations. The first
configuration, hereafter referred to as the Atomic configuration, contained 5,000 atoms and were composed of a mix of As, Se and S atoms. The second configuration, henceforth referred to as the Lone Pair configuration, contained an additional 2,000 dummy atoms used to simulate the lone pair of electrons associated with each arsenic atom 27. These
9 As, Se and S atoms entering that volume to simulate the steric effect of the lone-pair of electrons. The reference potentials, listed in Table 2, for Se and S were identical in the two approaches, but the coulomb charge for As was altered in the lone pair configuration (As’) to accommodate the negative charge associated with the lone pair atom (qAs). The minimum approach distances for all the atoms are given in Table 3 and have been set to ensure that the models contain no homopolar bonds. The final fits to the structure factors, along with the As-Ch partial radial distribution functions, 𝑔AsCh(𝑟), are given in the Supplementary Information (Figure S3-S6) for all compositions in both configurations. Visual inspection of each 𝐺(𝑟) shows little difference in quality of fit with that in Figure 1b. However, inspection of 𝑔AsCh(𝑟) show significant differences between the MC-EPSR simulations and those generated by T-EPSR.
The 𝑔AsCh(𝑟)s taken from the atomic MC-EPSR analysis of the As40S30Se30 structure are shown in Figure 2b and are
representative of the results obtained for all ternary compositions and both configurations (see Supplementary Information, Figure S4 and S6). In contrast to 𝑔AsCh(𝑟)in Figure 2a, the average arsenic-sulfur bond length (as indicated by the position of the peak in 𝑔AsS(𝑟)) was at a shorter distance than the arsenic-selenium bond length in 𝑔AsSe(𝑟). The first peaks in 𝑔AsS(𝑟)and 𝑔AsSe(𝑟)were at 2.28 Å and 2.40 Å, coinciding with the positions of the first peaks in
𝐺(𝑟) for As40S60 and As40Se60 respectively (dotted lines). In conclusion, the obvious difficulties in obtaining accurate
local structural information for systems with insufficient experimental constraints have been obviated by the use of MC-EPSR, which ensures that the arsenic-chalcogen bond lengths in all the simulated glass structures for the As40Se60
-As40S60 system were consistent with diffraction experiments 11, 14, 26 and bond valence calculations 53. The rest of this
10
3.
Results and Discussion
3.1.
A comparison of MC-EPSR models generated using atomic and lone pair
simulations.
3.1.1 Coordination numbers
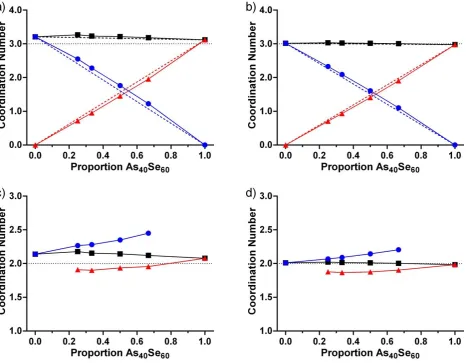
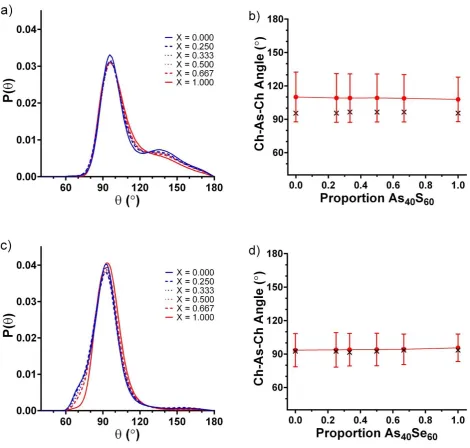
Figure 3 shows the average As-Ch coordination numbers, 𝑛𝐴𝑠𝐶ℎ, for each composition simulated using MC-EPSR with Atomic (Figure 3a) and Lone-Pair (Figure 3b) configurations. Figure 3a shows that values for 𝑛𝐴𝑠𝐶ℎ obtained using the Atomic configurations vary between 3.08 and 3.24, with higher values of 𝑛𝐴𝑠𝐶ℎ found in sulfur rich glasses (𝑛𝐴𝑠𝐶ℎ> 3.20 at x ≤ 0.500). The individual As-Ch coordination numbers, 𝑛𝐴𝑠𝑆 and 𝑛𝐴𝑠𝑆𝑒, shows that this over-coordination arises from As-S bonds. 𝑛𝐴𝑠𝑆 is consistently higher than expected, while 𝑛𝐴𝑠𝑆𝑒 is slightly lower. In contrast, Figure 3b shows that the average values of 𝑛𝐴𝑠𝐶ℎ obtained using the Lone-Pair configuration are much closer to the expected value of 3, varying between 2.97 and 3.00.
An alternative analysis of the coordination numbers can be obtained by considering the distribution of coordination environments in the glass. Table 4 shows that attaching a dummy lone pair atom to each arsenic atom reduces the standard deviation on the average arsenic coordination number for As40Se60 from 0.71 to 0.27, with a corresponding
improvement also observed for As40S60. Table 5 and figure 4a show this difference in standard deviation arises from
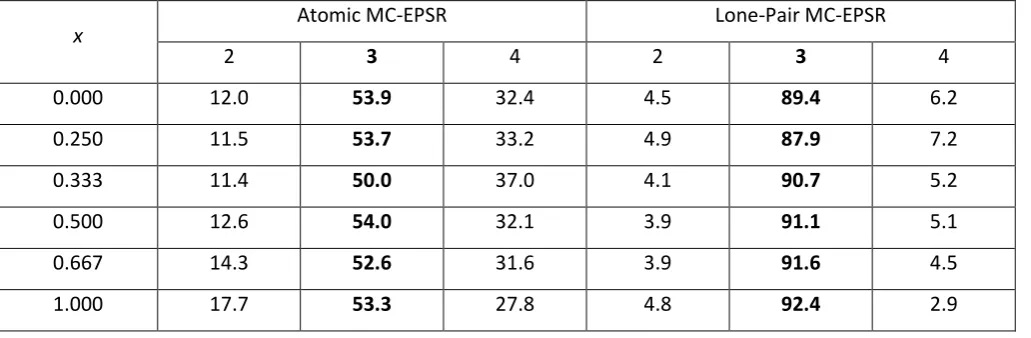
the greater variation in the arsenic environment in the Atomic configurations. Across all the glass compositions, only 50-54 % of the arsenic atoms are coordinated by 3 chalcogen atoms in the Atomic configuration with 28-37 % of the As atoms bonded to 4 chalcogens and the remaining 11-17 % have a coordination number less than 3. In contrast, in the Lone-Pair simulations, 88-92 % of the arsenic atoms are 3 coordinated and the remaining As atoms are evenly divided between 2 and 4 coordination environments, resulting in the average coordination number of ~ 3. An analysis of the structure of crystalline As2Se3 54 and As2S3 55 shows that only [AsCh3] units are likely to be present in these
glasses, and this is corroborated by the position and width of the As-Ch peaks fitted to the data in a previous study 11.
11 To explain these results, it can be postulated that the weak scattering from sulfur atoms, resulting in a lack of intensity in the structure factor from sulfur correlations, coupled with no method for enforcing the “voids” near the [AsCh3]
units that arise from the presence of a lone pair, allows sulfur atoms to cluster around the arsenic atoms in higher concentrations than expected without significantly altering the simulated structure factor. By reproducing the effect of a lone pair using a dummy atom, the available space for additional chalcogens to cluster around arsenic is greatly reduced. However, while the addition of the lone pair atoms has greatly reduced the distribution of As environments, the change in the Se environment induced by including lone pair atoms is minimal.
3.1.2 Bond Angle Distributions
The structural differences between the MC-EPSR simulations carried out with and without dummy lone pair atoms can be further explored by investigating the Ch-As-Ch bond angles within the [AsCh3] polyhedra. There is remarkable
consistency in the shape of the distributions observed for each glass composition generated using a particular configuration. The distribution of bond angles obtained for simulations using the Atomic configuration are shown in Figure 5a and have a bi-modal distribution, with a sharp peak at 95° and a much broader peak at 145°. An evaluation of the mean and modal averages of the angular distributions, shown in Figure 5 b, yields values of ~109° and ~96° respectively, across the compositional range. The mean bond angle is close to that expected for an [AsCh4] tetrahedron
and this may be reflective of the increased number of 4 coordinated units in the atomic simulations. It is worth noting that Alderman et al.27 also observed a bimodal distribution of O-Pb-O bond angles in the atomistic models of
80PbO-20SiO2 glass. Following the work of Alderman et al., the lone pair configuration was expected to reduce the width of
the bond angle variation in the simulation.
Figure 5c shows that the addition of a lone pair to each As atom has the effect of sharpening the bond angles distribution in the Ch-As-Ch triplets, removing the shoulder, and producing a unimodal peak centred at ~94 with mean and modal averages that are in close agreement (~94° and ~93° respectively Figure 5 d). This is very close to the X-As-X bond angles reported by Gillespie 56 for lone pair molecules, AsF
3 and AsCl3 (95.8 and 98.9 respectively). The
Ch-As-Ch bond angle distribution in crystalline As2S3 and As2Se3 ranges from 90.6 to 106.5. The mean median and modal
average angles are 98.85, 98.65 and 98.7 respectively with a standard deviation of 5.2. Therefore, the unimodal shape of the Ch-As-Ch bond angle distributions generated by the Lone-Pair configuration match that found in the crystal structures, but the average bond angles are ~4 smaller. The current work has been more successful in producing the expected single Gaussian distribution with closely matched mean and modal values than that of Alderman et al.26 and this difference may be a result of the much wider variation in Pb environments found in lead
oxide glasses, where a range of different coordination environments are known to exist.57
12 is significantly narrower. The mean, median and modal averages for the As-Ch-As bond angle distribution in the crystals are 97.0, 99.5 and 101 respectively, with a standard deviation of 6.4. Therefore the shoulder at 140 observed in the Lone-Pair model is considered to be unphysical.
3.1.3 The chalcogen environment.
Figure 3b, Figure 4a and Figure 5c show the marked effect attaching dummy lone pair atoms to the arsenic atoms has on the distribution of As-Ch environments. In contrast, Figure 4b (and the similarity between Figure 5a and Figure S7) shows that there is little difference in the selenium environments found in the Atomic and Lone-Pair configurations. A significant number of 0, 1, 2 and 3 coordinated Se present in both models along with a significant number of As-Ch-As bond angles of ~140. The presence of a dummy lone pair atom in the local environment of arsenic fills space, preventing more than three chalcogen nearest neighbours, thereby constraining the number of lower coordination environments that may form to maintain an average coordination number of 3, and reducing the range of As-Ch-As bond angles. However, there is no such constraint on the selenium environment. The authors postulate that a similar reduction in the distribution of Ch environments may be achieved if the two lone pairs of electrons on the S and Se atoms were are also included in the model. However, this would add 50% more spheres to the lone pair simulation and significantly increase the computational time required. A more elegant method of controlling the local environments of atoms would be to add a coordination number or bond valence constraints and this is future work to develop MC-EPSR.
3.2.
A comparison of the partial correlation functions simulated using
Lone-Pair MC-EPSR with crystalline As
2Se
3.
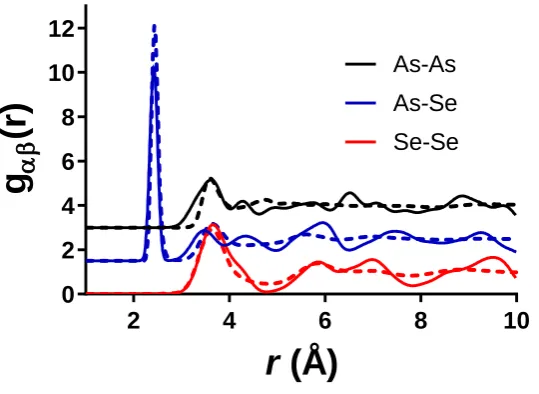
An important test for any atomistic model is to examine the partial structure factors to ensure that the model is chemically reasonable. Figure 6 plots the three partial structure factors, As-As, As-Se and Se-Se, obtained for the As40Se60 sample using Lone-Pair MC-EPSR with those simulated for crystalline As40Se60. The XTAL program 58 was used
to simulate the partials correlation functions for the crystal using the published atomic positions and lattice parameters.59 The ideal partial correlation functions were broadened for the effects of real space resolution (arising
from a finite Qmax) and thermal motion. For longer distances, the rms variation in interatomic distance was calculated
from the published anisotropic thermal parameters, but for short distances (i.e. As-Se bonds and Se…Se nearest neighbours) the values taken from fitting the correlation functions for amorphous As2Se3 were used, simulating the
effects of correlated motion. 11
13 amorphous nature of the material, and the good agreement between crystal and simulated glass structure over the short range indicates that the model for As40Se60 is chemically reasonable. Figure S8 in the supplementary information
shows the partial correlation functions for As40Se60 with those of As40Se30S30 and As40S60 to demonstrate that there the
partials generated for each glass composition are consistent with each other.
3.3.
A comparison of the MC-EPSR lone pair model for As
40Se
60with MD
simulations.
As stated in Section 1, this study is, to the best of our knowledge, the first to systematically sample across a series of chalcogenide glass compositions to produce consistent computational structural models. Furthermore, while there are numerous reports in the literature for structural models of As40Se608, 12, 15, 18, 20, 23, we are unaware of any studies
of As-Se-S glasses due to the difficulties discussed in section 2. A comparison of As and Se environments generated by MC-EPSR using Atomic and Lone-Pair configurations has demonstrated that the presence of a lone pair atom associated with each arsenic atom markedly improves the quality of the model. However, before the structural simulations obtained for each of the glasses in the x As40Se60 – (1-x) As40S60 series can be studied in detail, it is necessary
to ensure that the results obtained in this work are comparable in quality to the best MD simulations reported in the literature. 1218
The majority of reports for the structure of As40Se60 have used small box ab initio MD simulations with varying levels
of success. Figure 4 compares the distribution of arsenic and selenium coordination numbers in the MC-EPSR atomic and lone pair simulations for As40Se60 with those reported in the literature 181215. Bauchy and Micoulaut’s 2013 paper 12 directly compared the structural models for As
40Se60 published by of Mauro and Varshneya 15, Li and Drabold 18 and
Bauchy and Micoulaut 12 with experimental data to determine the quality of the three models. It was shown that the
Bauchy and Micoulaut and Li and Drabold models both obtained similarly good quality of fits to the experimental data published by Salmon et al. 60. However, the model proposed by Mauro and Varshneya failed to reproduce the intensity
or positions of the peaks in the experimental structure factor. Indeed, Figure 4 shows that the Mauro and Varshneya model is of similar quality to the Atomic model reported here, with both simulations contain 1, 2, 3 and 4 coordinated arsenic atoms, low fractions of two-coordinated selenium, and a maximum bond angle distribution significantly different from that expected for the pseudo-trigonal bipyramid shape induced by the presence of a lone pair 56. Due
to the shortcomings of the Atomic and Mauro and Varshneya models for As40Se60, the discussion will now focus on the
Lone-Pair model and those reported by Li and Drabold 18 and Bauchy and Micoulaut. 12
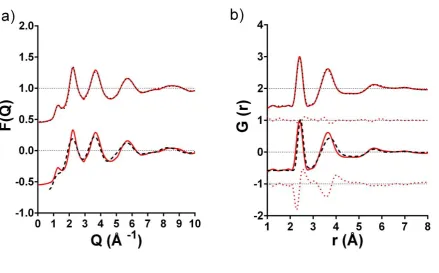
Figure 7a shows the experimental 𝐹N(𝑄) for As40Se60 reported by Barney et al. 11 along with the structure factor
generated using the MC-EPSR lone pair configuration in this study and the corresponding simulated structure factor published by Bauchy and Micoulaut 12. As might be expected, there is a significantly better agreement between the
14 experimental F(Q) and the Bauchy and Micoulaut structure factor are the lack of a first sharp diffraction peak (FSDP) at ~1.25 Å-1 in the model, and the reduced heights of the peaks at ~2.2 and ~3.4 Å compared to the experimental data.
Inspection of the partial structure factors calculated from the lone pair simulation for As40Se60, suggests that the FSDP
arises from a mix of As-Se and As-As correlations in the glass (see supplementary information). The effect of these differences in the structure of the glass can be best understood by inspecting the total radial distribution functions,
𝐺(𝑟) (Figure 7b). The data of Bauchy and Micoulaut are in agreement with the area of the experimental first peak, yielding an arsenic coordination number of 3.02 12, but the peak maximum is at a longer distance (2.46 Å) than found
experimentally (2.41 Å). Discrepancies can also be seen in the position of the second peak in 𝐺(𝑟), which is centered at 3.65 Å in the experimental data and at the longer distance of 3.73 Å in the simulation of Bauchy and Micoulaut12. It
is non-trivial to assign the shift in this peak to a single atomic pair correlation because this region is composed of intensities from the 𝑔AsAs(𝑟), 𝑔SeSe(𝑟)and 𝑔AsSe(𝑟) partials. However, the long As-Se bonds predicted by the simulation would be expected to have the effect of expanding the network structure and lengthen distances to all coordination shells. In summary, by refining the initial starting potentials used by EPSR, the structural models reported in this study are, unsurprisingly, in much closer agreement with experimental data than those generated from interatomic potentials alone.
Figure 4c compares the arsenic environments in the lone pair simulation for As40Se60 with those reported by Li and
Drabold 18 and Bauchy and Micoulaut 12. All three simulations indicate that between 89 and 97 % of As atoms are
three-coordinated. However, in the Bauchy and Micoulaut simulation the majority of the remaining As atoms (9.7%) have more than 3 neighbouring atoms, resulting in an average arsenic coordination number that is >3. In the MC-EPSR lone pair and Li and Drabold simulations, the distribution of the remaining As atoms is evenly split between 2 and 4 coordination. In contrast, the selenium environments reported in Figure 4d, indicate that the Bauchy and Micoulaut simulation for As40Se60 is more realistic because 94% of the selenium atoms are two-coordinated; the Li and Drabold
and lone pair simulations only achieve ~65% two coordinated Se atoms. Using this analysis, each of the models has it’s own strengths in producing a chemically reasonable model. However, it should be remembered that an additional set of constraints were applied to this study. Spectroscopic studies of stoichiometric As40Ch60 glasses have suggested that
the structure is predominantly comprised of [AsCh3] pyramidal units 11, 61. Therefore, the arsenic atoms are expected
to be primarily coordinated by three chalcogen atoms (S and/or Se) while chalcogen atoms are coordinated by two arsenic atoms. Previous studies in the literature 12, 18 have not enforced the absence of homopolar bonds. Bauchy and
Micoulaut reported that 21% of As bonds are to other arsenic atoms 12, while Li and Drabold found that 23% of As
bonds were homopolar 18. These values are ~three times greater than the 7% As-As bonds predicted by Georgiev 62
following analysis of Raman spectra for As40Se60, and 77Se NMR work published by the authors show that the number
of Se-Se bonds present in this As40Se60 sample is negligible. To incorporate the NMR results, this work has used
minimum approach distances that ensure only As-S or As-Se bonds are possible in the final simulations. The excellent level of agreement between the MC-EPSR lone pair simulation for As40Se60 and experimental data, coupled with As
15
12, demonstrates that it is possible to build a model for the structure of As
40Se60 that does not require homopolar bonds
to generate a high quality structural model for As40Se60.
In summary, a comparison of the lone pair model for As40Se60 with MD simulations reported in the literature indicates
that the quality of the results are comparable, even with the addition of closest approach constraints to remove homopolar bonding in the current model. However, the truly unique aspect of this work is that rather than focusing on modelling one or two glass compositions individually, a single set of potentials has been derived that is capable of generating fits to 6 different compositions simultaneously. The success of this approach suggests that the final interatomic potential could be used predictively, to generate the structure of a previously unmeasured glass composition reliably.
3.4.
Model Transferability
The MC-EPSR methodology, which combined with a lone pair starting configuration, has allowed structural models to be calculated for six glasses in the xAs40Se60 – (1-x)As40S60 system (where x = 0.000, 0.250, 0.333, 0.500, 0.667 and
1.000) simultaneously. Furthermore, the agreement between simulation and experimental data (see S.I. Figs 3 and 5) is excellent, and the simulations all yield chemically reasonable models composed of ≥ 87% [AsCh3] units (Table 4).
However, all of these simulations were produced with reference to experimental data, and so the method is not intrinsically predictive. In contrast, Bauchy and Micoulaut were able to use the MD methodology to simulate structures for As40Se60 and As20Se80 12with no reference to experimental results at all. In order to investigate the transferability of
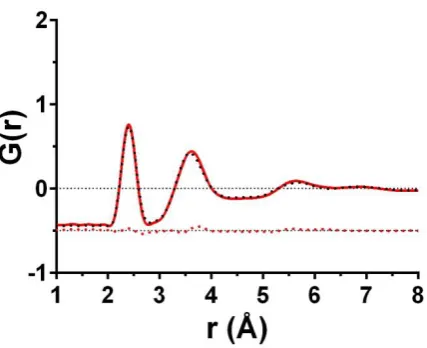
the interatomic potentials generated using MC-EPSR with a lone-pair configuration, a subsequent neutron diffraction experiment was conducted on a glass with the composition x = 0.750 (As40S15Se45). This composition was made using
the same method as the other glasses investigated here 11.
Figure 8 shows the total radial distribution function, G(r), from this experiment (red line) along with a predicted G(r) (black dotted line) produced using the empirical potentials obtained from the MC-EPSR lone pair configuration. In previous EPSR studies the quality of fit between the experimental (𝐹𝑖(𝑄)) and simulated (𝐷𝑖(𝑄)) structure factors has been evaluated using the R-Factor 33, 63. This is calculated using,
𝑹 = 𝟏
𝑴∑ 𝟏
𝒏𝑸(𝒊)∑ [𝑫𝒊(𝑸) − 𝑭𝒊(𝑸)] 𝟐 𝑸
𝒊 (7)
where, 𝑀 is the number of datasets, 𝑛𝑄(𝑖) is the number of 𝑄 values in the 𝑖th dataset and the lower the value of R the closer the fit to the data. The R-Factor values for the glasses with compositions of x = 0.000, 0.250, 0.333, 0.500, 0.667 and 1.000 vary between 0.3-0.8 x 10⁻³ with an average of 0.6 x 10⁻³
. The R-factor calculated for the simulation of
x = 0.750 is 0.7 x 10⁻³. This level of agreement is within the range reported for data that has been explicitly fitted using
EPSR, suggesting that the empirical potentials taken from the current work are transferable to other glass compositions in the As40Se60-As40S60 series. In future these potentials could be used to simulate the structure of other
16 It should be stated that no attempt has yet been made to simulate non-stoichiometric compositions because the closest approach constraints, given in table 3, prevent the formation of homopolar bonds. This could be viewed as a limitation of this work but, as discussed in Section 3.2, many MD models of As40Se60 contain significantly more
homopolar As-As bonds (~23%) 12, 18 than are expected from the analysis of spectroscopic techniques. This work
demonstrates that models can be generated that are consistent with both X-ray and neutron data without the need for any homopolar bonding, and that the modelling approach used is robust enough to be a useful tool for predicting the structure of other glasses in the same glass series. The extension of this method to work for non-stochiometric compositions is already underway.
In conclusion, the use of MC-EPSR has advantages over T-EPSR for complex systems where there is insufficient data to guide the model. Firstly, simultaneously fitting data from a series of related glass compositions using neutron and X-ray data reduces the problem of the model being under constrained. The form of the total radial distribution functions are given in equations 1 and 2. They are comprised of a series of overlapping partial correlation functions, 𝑆𝛼𝛽(𝑄), which must be deconvoluted to fully determine the structure of the glass. We have demonstrated that, for a complex glass with strongly overlapping 𝑆𝛼𝛽(𝑄) and only weak scattering contrast, T-EPSR (combining neutrons and X-rays to vary the scattering lengths, 𝑏, that determine the intensity of each partial) is inadequate. MC-EPSR refines one set of potentials against a series of glasses to give contrast in the concentration of each of the elements, 𝑐 as well 𝑏. In doing so, significantly more data sets are provided to guide the fit and ensure that the model more closely matches the real glass structures. The second advantage of this methodology is that it is predictive. MD and MC modelling methods use interatomic potentials to calculate the structure of a material, and are therefore predictive but have not been compared to experimental data, while RMC generates models that are more closely related to the measured structure of the glass, but are not predictive. Our approach combines these two methods. Experimental data for a series of samples is used to derive a series of interatomic potentials that accurately model the data and, as a result, we have developed a set of potentials that can be used to simulate the structure of a previously unmeasured glass reliably.
17
3.5.
Interrogating the Model
One of the initially stated aims of this work was to develop a structural model for a series of As40Se60-As40S60 glasses
that can be interrogated to determine structural origins for the glasses functional properties. For example, recently published results indicated that the glass transition temperature (Tg) and non-linear refractive indices (n2) of the
As40Se60-As40S60 series of glasses do not vary linearly with glass composition 11. Both Tg and n2 values for the ternary
glasses were found to be more similar to the sulphide end member, As40S60, than As40Se60. Using direct analysis of
neutron diffraction data, it has been suggested that this non-linear behaviour was due to a the non-linear change in the selenium-sulfur coordination number with increasing sulfur content 11. This conclusion was based on the
assumption that differences between a correlation function for a ternary glass and a suitably weighted sum of the end member compositions (i.e. As40Se30S30 and 0.5As40Se60+0.5As40S60) arise solely from Se-S correlations in the glass, which
are unaccounted for in the weighted sum. An interrogation of the MC-EPSR simulations generated using the Lone-Pair configuration yields chalcogen-chalcogen coordination numbers that all vary linearly with concentration (See S.I. Figure S9). This observed behaviour casts doubt on the previously reported interpretation for the differences between the experimental correlation function for the ternary glasses and corresponding weighted sums calculated from the binary glass compositions 11. The reported difference was observed in the second peak in the correlation function and,
as stated previously in section 3.3, this peak is composed of a mix of all possible partial correlations; for the ternary glasses these comprise As-As, As-Se, As-S, Se-Se, S-S and Se-S. To state that a weighted sum of the As-Ch, As-As, Se-Se and S-S correlations in As40Se60 and As40S60 would generate the correct correlations for a ternary glass is likely to be an
oversimplification of the structural rearrangements that occur on mixing chalcogen atoms together in the glass network.
An alternative explanation for the changes in functional properties that occur with composition in the As40Se60-As40S60
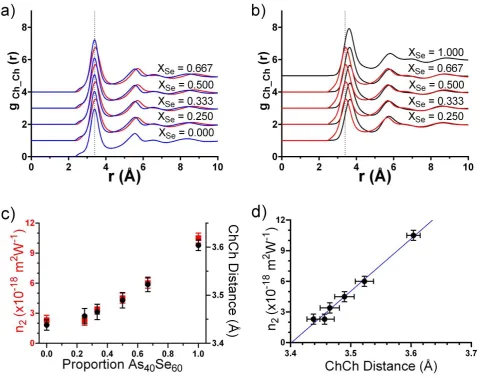
glass series can be found by examining the partial radial distribution functions (𝑔𝛼𝛽(𝑟)) produced by MC-EPSR for each of the chalcogen-chalcogen pairs. Figure 8 a and b show the partials for 𝑔𝑆𝑆(𝑟), 𝑔𝑆𝑆𝑒(𝑟) and 𝑔𝑆𝑒𝑆𝑒(𝑟) and show that there is no appreciable change in position of the nearest neighbour Ch…Ch peak with composition. The first peaks in the partials are centred at 3.39 Å for 𝑔𝑆𝑆(𝑟), 3.42 – 3.45 Å for 𝑔𝑆𝑆𝑒(𝑟) and 3.60 – 3.66 Å for 𝑔𝑆𝑒𝑆𝑒(𝑟), all within the region of the reported non-linear changes in 𝐺(𝑟)11. Figure 8a compares 𝑔
𝑆𝑆(𝑟) with 𝑔𝑆𝑆𝑒(𝑟) to show that the nearest neighbour distance for these two Ch-Ch interactions are within 0.06 Å. In contrast, selenium-selenium nearest neighbour distances are 0.21-0.27 Å longer than those for selenium-sulfur. This indicates that the mixed chalcogen-chalcogen interactions in the ternary glasses are more similar to S-S distances than Se-Se distances. It might be expected that this would result in a non-linear variation in the atomic number density but the data given in Table 1 show that this is not the case. This can be rationalised by considering the positions of the second peaks in the chalcogen-chalcogen 𝑔𝐶ℎ𝐶ℎ(𝑟). Here, the differences between the three partials are reversed, with the positions of the second peaks in 𝑔𝑆𝑆𝑒(𝑟) and 𝑔𝑆𝑒𝑆𝑒(𝑟) differing by only 0.06-0.09 Å (Figure 8b) , while the same peak position in
18 content is the non-linear variation in the average Ch…Ch nearest neighbour distance. The similarity between the Se…S and S…S distances result in an average Ch…Ch separation in the ternary glasses that varies non-linearly with composition and is weighted to be more similar to that of As40S60 than As40Se60. Figure 8c shows the average Ch…Ch
distance for atoms within the nearest neighbour coordination shell (here defined as being within 4 Å of each other) along with the corresponding variation in n2 and the two parameters demonstrate similar trends with composition.
Indeed, a linear relationship is demonstrated in Figure 8d. These results indicate that the conclusions of Barney et al.
11, which postulate that the chalcogen-chalcogen environment is correlated with non-linear refractive index, n
2, in the
As40Se60-As40S60 glass system, are qualitatively correct. However, MC-EPSR simulations suggest that it is the relative
19
4.
Conclusions
The structure of a series of xAs40Se60-(1- x)As40S60 glasses where x = 1.000, 0.667, 0.500, 0.333, 0.250 and 0.000 has
been investigated using a combination of neutron and X-ray diffraction along with Monte Carlo simulations. From the analysis of the simulated structures it was found that one neutron diffraction and one X-ray diffraction experiment was insufficient to constrain the Monte Carlo model for an individual glass composition. We have, therefore, used a multi-composition refinement procedure (MC-EPSR) to provide one set of interatomic potentials that are consistent with the experimental data for all of the compositions. Through the combination of MC-EPSR and minimal constraints we have produced a set of interatomic potentials that are consistent with experimental techniques and are transferable to new glass compositions. In agreement with previous glass structure studies 27-28 we find that including
a lone-pair is required to constrain the model to the expected interatomic arrangement and coordination numbers. Investigation of the structures taken from the MC-EPSR analysis of the arsenic-sulfur-selenium glasses suggests that the changes with composition of the non-linear refractive indices, n2, can be attributed to the distances between
chalcogen atoms in the glass. Se…S distances are very similar to those of S…S, while Se…Se atoms distances tend to be ~0.2 Å longer. When the weighted partial radial distribution functions are added, the average Ch…Ch distance changes non-linearly with As40Se60 content correlating with the changes observed in 𝑛2.
Supporting Information
Supporting information includes: Experimental neutron and X-ray data for each glass composition shown with traditional EPSR simulations. The As-Ch partial correlation functions for each glass composition produced by traditional EPSR simulations. Experimental neutron and X-ray data for each glass composition shown with multi-component EPSR simulations without dummy lone-pair atoms. The As-Ch partial correlation functions for each glass composition produced by multi-component EPSR simulations without dummy lone-pair atoms. Experimental neutron and X-ray data for each glass composition shown with multi-component EPSR simulations with dummy lone-pair atoms. The As-Ch partial correlation functions for each glass composition produced by multi-component EPSR simulations with dummy lone-pair atoms. The angular distribution of arsenic atoms around each chalcogen atom, along with the mean, modal and standard deviations for the bond angles, for each glass composition produced by multi-component EPSR simulations with dummy lone-pair atoms. The mean (black crosses) and modal (red circles) averages and standard deviations for bond angles. The partial correlation functions generated using Lone-Pair MC-EPSR for As40S60, As40S30Se30
and As40Se60. The chalcogen-chalcogen coordination numbers, 𝑛𝐶ℎ𝐶ℎ, for each glass composition calculated using the
20
Acknowledgements
21
Tables
Table 1. The density (ρ) and atomic composition of the xAs40Se60-(1- x)As40S60 glasses that are used as parameters for
all simulations.
x ρ (atoms Å-3) Composition
Arsenic No. Sulfur No. Selenium No.
0.000 0.0391 2,000 3,000 0
0.250 0.0384 2,000 2,250 750
0.333 0.0379 2,000 2,000 1,000
0.500 0.0372 2,000 1,500 1,500
0.667 0.0363 2,000 1,000 2,000
1.000 0.0354 2,000 0 3,000
Table 2. Lennard-Jones parameters, Coulomb charges and masses that define the reference potentials for each of the MC-EPSR configurations. Here, As is used for the atomic configuration and As’ and qAs are used for the lone pair configuration.
Label ε (kJ mol-1) σ (Å) q (e) Mass (a.m.u)
As 0.80 2.45 0.60 75.00
S 0.80 2.35 -0.40 32.00
Se 0.80 2.55 -0.40 79.00
As’ 0.80 2.45 0.90 37.50
[image:21.595.171.426.374.502.2]qAs 0.00 0.00 -0.30 37.50
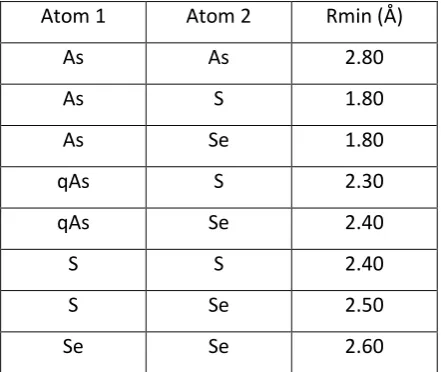
Table 3. Minimum atomic separations (Rmin) used for the MC-EPSR simulations. Pairs not listed have Rmin = 0.90 Å.
Atom 1 Atom 2 Rmin (Å)
As As 2.80
As S 1.80
As Se 1.80
qAs S 2.30
qAs Se 2.40
S S 2.40
S Se 2.50
[image:21.595.188.409.543.729.2]22 Table 4. The average coordination numbers of chalcogen atoms around arsenic in As40S60 and As40Se60 calculated from
the MC-EPSR simulations with Atomic and Lone-Pair configurations. The associated standard deviations (s.d.) for each of the EPSR setups is also given.
As40S60 As40Se60
Configuration As-S Coord As-S s.d. As-Se Coord As-Se s.d.
Atomic 3.20992 0.68409 3.08379 0.71266
Lone Pair 3.00291 0.34752 2.97353 0.27081
Table 5. The percentage of arsenic atoms coordinated by 2, 3 and 4 chalcogen atoms in the MC-EPSR simulations with Atomic and Lone-Pair configurations.
x Atomic MC-EPSR Lone-Pair MC-EPSR
2 3 4 2 3 4
0.000 12.0 53.9 32.4 4.5 89.4 6.2
0.250 11.5 53.7 33.2 4.9 87.9 7.2
0.333 11.4 50.0 37.0 4.1 90.7 5.2
0.500 12.6 54.0 32.1 3.9 91.1 5.1
0.667 14.3 52.6 31.6 3.9 91.6 4.5
[image:22.595.44.560.320.489.2]23
Figures
Figure 1: Experimental neutron (solid red) and X-ray (solid blue) radial distribution functions, G(r), for As40Se30S30
24 Figure 2: Partial radial distribution functions, gAs-Ch(r), for arsenic-sulphur (black) and arsenic-selenium (red)
correlations taken from (a) T-EPSR and (b) an Atomic MC-EPSR simulation of As40S30Se30. The vertical black dotted lines
at 2.28 Å indicate the position of the first peak in the G(r) for As40S60 and the red vertical dotted lines at 2.40 Å indicate
[image:24.595.94.527.61.249.2]26 Figure 4. The distribution of arsenic (a and c) and selenium (b and d) coordination numbers taken from the MC-EPSR analysis of As40Se60 are shown with results from previously published simulations. The data from the MC-EPSR
28 Figure 6: A comparison of the partial correlation functions, gαβ(r), obtained from the lone pair simulation of amorphous
As2Se3 (solid lines) with those generated for crystalline As2Se3 (dashed lines).
2
4
6
8
10
0
2
4
6
8
10
12
r (Å)
g
(r
)
29 Figure 7. Experimental a) 𝐹(𝑄) and b) 𝐺(𝑟) for As40Se6011 (solid red line) plotted with the simulated structure factors
and 𝐺(𝑟)s generated using the MC-EPSR Lone-Pair configuration (black dotted line) and MD 12 (black dashed line). The
30 Figure 8 Experimental 𝐺(𝑟) for As40Se45S15 (solid red line) shown with the predicted 𝐺(𝑟) (black dotted line) produced
31 Figure 9 The chalcogen-chalcogen partial radial distribution functions, 𝑔𝐶ℎ𝐶ℎ(𝑟), taken from MC-EPSR using the Lone-Pair configuration; a) 𝑔𝑆𝑆(𝑟) (blue), 𝑔𝑆𝑆𝑒(𝑟) (red) and b) 𝑔𝑆𝑆𝑒(𝑟) (red) and 𝑔𝑆𝑒𝑆𝑒(𝑟) (black). c) the average chalcogen-chalcogen separation (black) and the non-linear refractive indices, 𝑛2 (red) 11. d) 𝑛2 plotted against the average
32 Scheme 1: Traditional EPSR begins with a Monte Carlo simulation of the structure of the system being studied (i). The simulated structure factor is then compared to the experimental data and a difference function is calculated. An empirical potential is produced based on this function and is added to the reference potentials. This is repeated until the simulation is in agreement with the experiment. An ensemble of structures is extracted once agreement is reached.
33
6.
References
1. Seddon, A. B., Phys Status Solidi B 2013, 250, 1020-1027. 2. Seddon, A. B., Int J Appl Glass Sci 2011, 2, 177-191.
3. Grant, W. B.; Kagann, R. H.; Mcclenny, W. A., J Air Waste Manage 1992, 42, 18-30. 4. Medhurst, L. J., Journal of Chemical Education 2005, 82, 278-281.
5. Wong, P. T. T.; Goldstein, S. M.; Grekin, R. C.; Godwin, T. A.; Pivik, C.; Rigas, B., Cancer Res 1993, 53, 762-765. 6. Lachenmeier, D. W., Food Chem 2007, 101, 825-832.
7. Cardinal, T.; Richardson, K. A.; Shim, H.; Schulte, A.; Beatty, R.; Le Foulgoc, K.; Meneghini, C.; Viens, J. F.; Villeneuve, A., J Non-Cryst Solids 1999, 256, 353-360.
8. Drabold, D. A.; Li, J.; Tafen, D., J. Phys.: Condens. Matter 2003, 15, S1529-S1536.
9. Harbold, J. M.; Ilday, F. O.; Wise, F. W.; Sanghera, J. S.; Nguyen, V. Q.; Shaw, L. B.; Aggarwal, I. D., Opt Lett 2002, 27, 119-121.
10. Lin, F. Y.; Gulbiten, O.; Yang, Z. Y.; Calvez, L.; Lucas, P., J Phys D Appl Phys 2011, 44 045404.
11. Barney, E. R.; Abdel-Moneim, N. S.; Towey, J. J.; Titman, J.; McCarthy, J. E.; Bookey, H. T.; Kar, A.; Furniss, D.; Seddon, A. B., Phys Chem Chem Phys 2015, 17, 6314-6327.
12. Bauchy, M.; Micoulaut, M., J. Non-Cryst. Solids 2013, 377, 34-38.
13. Fabian, M.; Svab, E.; Pamukchieva, V.; Szekeres, A.; Todorova, K.; Vogel, S.; Ruett, U., J Phys Chem Solids 2013,
74, 1355-1362.
14. Kaban, I.; Jovari, P.; Wagner, T.; Frumar, M.; Stehlik, S.; Bartos, M.; Hoyer, W.; Beuneu, B.; Webb, M. A., J.
Phys.: Condens. Matter 2009, 21 395801.
15. Mauro, J. C.; Varshneya, A. K., J Non-Cryst Solids 2007, 353, 1226-1231. 16. Shimojo, F.; Hoshino, K.; Zempo, Y., J. Phys. Soc. Jap. 2005, 74, 621-625.
17. Simdyankin, S. I.; Elliott, S. R.; Hajnal, Z.; Niehaus, T. A.; Frauenheim, T., Phys. Rev. B 2004, 69 144202. 18. Li, J.; Drabold, D. A., Phys. Rev. B 2000, 61, 11998-12004.
19. Li, J.; Drabold, D. A., Phys Rev B 2001, 64, 104206.
20. Hosokawa, S.; Koura, A.; Berar, J. F.; Pilgrim, W. C.; Kohara, S.; Shimojo, F., Epl-Europhys Lett 2013, 102, 66008. 21. Aniya, M.; Shimojo, F., J Non-Cryst Solids 2006, 352, 1510-1513.
22. Inui, M.; Kajihara, Y.; Kimura, K.; Fukumaru, T.; Matsuda, K.; Yao, M., J Non-Cryst Solids 2013, 366, 22-29. 23. Zhu, X. F.; Chen, L. F., Physica B 2008, 403, 3302-3306.
34 26. Fabian, M.; Svab, E.; Pamukchieva, V.; Szekeres, A.; Vogel, S.; Ruett, U., J Phys Conf Ser 2010, 253 012053. 27. Alderman, O. L. G.; Hannon, A. C.; Holland, D.; Feller, S.; Lehr, G.; Vitale, A. J.; Hoppe, U.; von Zimmerman, M.; Watenphul, A., Physical Chemistry Chemical Physics 2013, 15, 8506-8519.
28. Barney, E. R.; Hannon, A. C.; Laorodphan, N.; Holland, D., J Phys Chem C 2011, 115, 14997-15007. 29. Soper, A. K., Chemical Physics 1996, 202, 295-306.
30. Towey, J. J.; Soper, A. K.; Dougan, L., Faraday Discuss 2013, 167, 159-176. 31. Soper, A. K., J Phys-Condens Mat 2011, 23, 365402.
32. Bowron, D. T., Mater Sci Eng B-Adv 2008, 149, 166-170. 33. Soper, A. K., J. Phys.: Condens. Matter 2007, 19 41508.
34. Weigel, C.; Cormier, L.; Calas, G.; Galoisy, L.; Bowron, D. T., J. Non-Cryst. Solids 2008, 354, 5378-5385. 35. Bernasconi, A.; Dapiaggi, M.; Pavese, A.; Bowron, D. T.; Imberti, S., J. Phys. Chem. B 2012, 116, 13114-13123. 36. Hannon, A. C., Nucl Instrum Meth A 2005, 551, 88-107.
37. Soper, A. K., RAL Technical Reports 2011, RAL-TR-2011-013.
38. Hannon, A. C.; Howells, W. S.; Soper, A. K., Inst Phys Conf Ser 1990, 107, 193-211. 39. Hammersley, A. P., ESRF Internal Report 1998, ESRF98HA01T.
40. Hammersley, A. P.; Svensson, S. O.; Hanfland, M.; Fitch, A. N.; Hausermann, D., High Pressure Research 1996,
14, 235-248.
41. Skinner, L. B.; Benmore, C. J.; Parise, J. B., Nucl Instrum Meth A 2012, 662, 61-70. 42. Kroghmoe, J., Acta Crystallogr 1956, 9, 951-953.
43. Norman, N., Acta Crystallogr 1957, 10, 370-373.
44. Soper, A. K.; Barney, E. R., J Appl Crystallogr 2011, 44, 714-726. 45. Lorch, E., J. Phys. C 1969, 2, 229.
46. Soper, A. K., Mol. Phys. 2001, 99, 1503-1516. 47. Soper, A. K., Phys Rev B 2005, 72 104204.
48. Soper, A. K., J Phys-Condens Mat 2010, 22 404210.
49. Rhys, N. H.; Soper, A. K.; Dougan, L., J Phys Chem B 2012, 116, 13308-13319.
50. Hayes, R.; Imberti, S.; Warr, G. G.; Atkin, R., Phys Chem Chem Phys 2011, 13, 3237-3247.
51. Busch, S.; Pardo, L. C.; O'Dell, W. B.; Bruce, C. D.; Lorenz, C. D.; McLain, S. E., Phys Chem Chem Phys 2013, 15, 21023-21033.
35 54. Stergiou, A. C.; Rentzeperis, P. J., Z Kristallogr 1985, 173, p185-p191.
55. Mullen, D. J. E.; Nowacki, W., Z Kristallogr 1972, 136 46-56. 56. Gillespie, R. J., Chem. Soc. Rev. 1992, 21, 59-69.
57. Hannon, A. C.; Barney, E. R.; Holland, D.; Knight, K. S., J Solid State Chem 2008, 181, 1087-1102. 58. Hannon, A. C., Rutherford Appleton Laboratory: RAL-93-063, 1993.
59. Stergiou, A. C.; Rentzeperis, P. J., Z Kristallogr 1985, 173, 185-191. 60. Xin, S. Q.; Liu, J.; Salmon, P. S., Phys Rev B 2008, 78 064207.
61. Li, W. Y.; Seal, S.; Rivero, C.; Lopez, C.; Richardson, K.; Pope, A.; Schulte, A.; Myneni, S.; Jain, H.; Antoine, K.; Miller, A. C., J Appl Phys 2005, 98 053503.