Elsevier Editorial System(tm) for NeuroImage: Clinical Manuscript Draft
Manuscript Number: NICL-15-50R2
Title: Abnormal visuomotor processing in schizophrenia Article Type: Regular Article
Section/Category: Psychiatry
Corresponding Author: Prof Peter G Morris,
Corresponding Author's Institution: University of Nottingham First Author: Siân Ellen Robson, PhD
Order of Authors: Siân Ellen Robson, PhD; Matthew J Brookes; Emma L Hall; Lena Palaniyappan; Jyothika Kumar; Michael Skelton; Nikolaos G Christodoulou; Ayaz Qureshi; Fiesal Jan; Mohammad Z Katshu; Elizabeth B Liddle; Peter F Liddle; Peter G Morris
UNITED KINGDOM • CHINA • MALAYSIA
Dear Editor
Abnormal visuomotor processing in schizophrenia: An MEG study
Please find attached our revised paper for consideration for publication in NeuroImage Clinical. We thank you and the reviewers for your time and effort in reviewing our manuscript. We have revised our manuscript in accordance with the second round of reviewer comments, and we feel it is significantly improved as a result. We look forward to your response.
Yours sincerely
Professor Peter Morris
Sir Peter Mansfield Magnetic Resonance Centre,
School of Physics & Astronomy University Park
Nottingham NG7 2RD
Tel +44(0)115 951 4750 Fax +44(0)115 951 5166
Email: [email protected] www.magres.nottingham.ac.uk
Professor Peter G Morris Head of Sir Peter Mansfield Magnetic Resonance Centre
NeuroImage Clinical Editor
Manuscript: Abnormal visuomotor processing in schizophrenia
Highlights:
Visual and motor deficits in schizophrenia are rarely investigated.
We use MEG to non-invasively assess the neural basis of these deficits.
Patients showed abnormalities in neuronal oscillations in motor cortex.
Beta band power, reflecting cortical inhibition, was reduced after movements.
Increased movement frequency may be a behavioural compensation for this reduction.
Abnormal visuomotor processing in schizophrenia
S. Robson, M. Brookes, E. Hall, L. Palaniyappan, J. Kumar, M. Skelton, N. Christodoulou, A. Qureshi, F. Jan, M. Katshu, E. Liddle, P. Liddle and P. Morris
Response to Reviewer
We thank the reviewer for their comments. In what follows, text from our manuscript is in bold typeface; additions to our manuscript are in bold italic typeface.
The referee raises the important point that the relationship between the deficit in post-movement beta rebound and a composite score for illness severity might be mediated by a selective association with specific clinical features. We had tested the association with a factor score representing a weighted combination of clinical features that we had previously identified as features that persist during a stable phase of illness, and had shown to be related to disordered connectivity (Palaniyappan et al, 2013). We reported association with this single measure to avoid the problem of multiple comparisons. This composite score included measures of symptoms, and cognitive, occupational and social function.
Although much evidence from prior studies suggests that distinguishable pathological processes are involved in the three symptom clusters characteristic of schizophrenia, all three clusters of symptoms are associated with impairment of cognitive, occupational and social function in the stable phase of illness, and furthermore, a composite score of these clinical features is associated with disordered connectivity (Palaniyappan et all, 2013) suggesting that they are associated with a shared pathological feature that predisposes to persistence. Nonetheless we agree that an examination of the degree to which different clinical features contribute to the factor is warranted.
We have added a clause to the description of the patient sample (section 2.1) to emphasise that they were studied during a stable phase of illness.
All patients were in a stable phase of illness with no change in antipsychotic, antidepressant, or mood- stabilizing medications, nor a change of more than 10 points in occupational and social function scored according to the Social and Occupational Function Assessment Scale (SOFAS) (APA 1994), in the 6 weeks prior to the study.
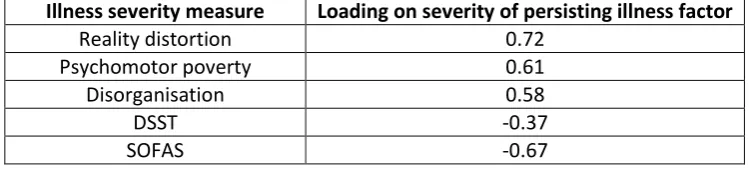
In the results section we have included a table giving the loadings of the various clinical features on the factor score.
Table 4: Loadings on the first factor derived from factor analysis of clinical features hypothesised to reflect current severity of illness: reality distortion, psychomotor poverty and disorganisation syndromes from the Signs and Symptoms of Psychotic Illness (SSPI) scale (Liddle, 2002); and scores from the Digit Symbol Substitution Test (DSST; Wechsler, 1944) and the Social and Occupational Function Assessment Scale (SOFAS; APA, 1994).
Illness severity measure
Loading on severity of persisting illness factor
Reality distortion 0.72 Psychomotor poverty 0.61 Disorganisation 0.58
DSST -0.37
We have also modified the caption to figure 5 to emphasize that the clinical features represent a score for severity of persisting clinical features.
Figure 5: Correlation between PMBR and severity of persisting psychotic illness. The amplitude of the post-movement beta rebound showed a significant negative correlation with a measure of overall psychotic illness severity persisting during a stable phase of illness in the patient group.
We have modified the discussion as follows.
The PMBR was inversely correlated with a score of overall severity of psychotic illness assessed during a stable phase of the illness. The scores for the three core syndromes of schizophrenia loaded positively on the illness severity measure, while social, occupational and cognitive function loaded negatively on it (Table 4). The magnitude of the DSST loading is lower than for the other items, but DSST score was retained because the set of items were selected a priori as a measure of illness severity (Palaniyappan et al., 2013) and a meta-analysis of cognitive impairments in schizophrenia has shown that the DSST quantifies an inefficiency of information processing that is an important feature of schizophrenia (Dickinson et al, 2007).
Similar to previous studies (e.g. Liddle, 1987b), the three syndrome scores showed low mutual correlations (0.033 to 0.33; p<.05), but all three loaded heavily on a single factor, along with the SOFAS and DSST scores, indicating that they are associated with a latent variable likely to reflect severity of illness. Scores on this composite measure of overall current severity of psychotic illness exhibited a significant negative Pearson correlation with the PMBR in the patient group (R=-0.52; p=.015; Figure 5), with no correlation between illness severity and ERBD or visual gamma (R=-.18 and .06 respectively; p=ns). Therefore, those patients with higher severity scores had stronger core symptoms and lower levels of function and these were also the patients who showed the smallest beta rebound.
Additional references
Liddle PF (1987b) The symptoms of chronic schizophrenia: a re-examination of the positive-negative dichotomy. British Journal of Psychiatry, 151: 145-151.
1
Title
Abnormal visuomotor processing in schizophrenia
Author names and affiliations
Siân E. Robson1, Matthew J. Brookes1*, Emma L. Hall1, Lena Palaniyappan2, Jyothika Kumar2,
Michael Skelton2, Nikolaos G. Christodoulou2, Ayaz Qureshi3, Fiesal Jan4, Mohammad Z.
Katshu2, Elizabeth B. Liddle2, Peter F. Liddle2 and Peter G. Morris1
1
Sir Peter Mansfield Imaging Centre, School of Physics and Astronomy, University of
Nottingham, University Park, Nottingham, NG7 2RD, UK.
2
Centre for Translational Neuroimaging in Mental Health, Institute of Mental Health, School
of Medicine, University of Nottingham, Jubilee Campus, Triumph Road, Nottingham, NG7
2TU, UK.
3
Kevin White Unit, Smithdown Health Park, Smithdown Road, Liverpool, L15 2HE, UK.
4
Herschel Prins Centre, Glenfield Hospital, Leicestershire Partnership NHS Trust, Groby
Road, Leicester, LE3 9QP, UK.
Corresponding author
Prof Peter Morris, Sir Peter Mansfield Magnetic Resonance Centre, School of Physics and
Astronomy, University of Nottingham, University Park, Nottingham, NG7 2RD, UK.
E-mail: [email protected]
*7. Manuscript
2
Abstract
Subtle disturbances of visual and motor function are known features of schizophrenia and
can greatly impact quality of life; however, few studies investigate these abnormalities using
simple visuomotor stimuli. In healthy people, electrophysiological data show that beta band
oscillations in sensorimotor cortex decrease during movement execution (event-related
beta desynchronisation (ERBD)), then increase above baseline for a short time after the
movement (post movement beta rebound (PMBR)); while in visual cortex, gamma
oscillations are increased throughout stimulus presentation. In this study, we used a
self-paced visuomotor paradigm and magnetoencephalography (MEG) to contrast these
responses in patients with schizophrenia and control volunteers. We found significant
reductions in the peak-to-peak change in amplitude from ERBD to PMBR in schizophrenia
compared with controls. This effect was strongest in patients who made fewer movements,
whereas beta was not modulated by movement in controls. There was no significant
difference in the amplitude of visual gamma between patients and controls. These data
demonstrate that clear abnormalities in basic sensorimotor processing in schizophrenia can
be observed using a very simple MEG paradigm.
Key words
3
1. Introduction
Schizophrenia is a psychiatric disorder characterised by a range of symptoms including
hallucinations, delusions, disorganised thought and behaviour, and reduced cognitive and
emotional capacity. Research tends to focus on these core symptoms; however, patients
also experience impairments in more basic sensorimotor processes (Bombin et al., 2005;
Butler et al., 2001; Vrtunski et al., 1986). Abnormalities in motor function have been noted
since the earliest descriptions of the disorder (Kraepelin, 1919) and are a well-accepted
feature of schizophrenia, with the vast majority of patients exhibiting at least one type of
motor symptom (Peralta et al., 2010; Walther et al., 2012). These symptoms include
involuntary movements, catatonia, Parkinsonism and deficits in the production of both
simple and complex movements such as coordination, reflexes and motor sequencing
(Bombin et al., 2005; Kraepelin, 1919; Vrtunski et al., 1989). Similarly, patients with
schizophrenia exhibit deficits in low-level visual function, particularly in processing stimuli of
low spatial frequencies, as evidenced by reduced contrast sensitivity, centre-surround
interference and abnormal motion perception (Butler et al., 2001; Cadenhead et al., 2013;
Keri et al., 2002; Slaghuis, 1998).
There is significant evidence that these subtle abnormalities in basic sensorimotor
processing are present in childhood, at the onset of core symptoms and in relatives of
individuals with schizophrenia (Chen et al., 2000; Walther et al., 2012; Whitty et al., 2009),
indicating that they are likely to be inherent to the disorder rather than being a
consequence of long-term exposure to medication. Importantly, visual and motor deficits,
as well as other neurological abnormalities, correlate with the primary symptoms of
4 Jahn et al., 2006; Liddle, 1987; Peralta et al., 2010) , and with illness severity (Jahn et al.,
2006), social functioning (Dickerson et al., 1996; Jahn et al., 2006; Lehoux, 2003) and
functional outcome (Boden et al., 2014; Javitt, 2009), suggesting they could be used as a
biomarker for the disorder.
Understanding the neuronal basis of these symptoms could therefore ultimately contribute
to development of treatments permitting improved quality of life; however, at present the
neuronal mechanisms underlying sensorimotor processing deficits in schizophrenia are not
known. It is likely that different types of symptoms have different aetiologies (Chen et al.,
2000). Visual deficits have been reported to be due to abnormalities in lower-level visual
pathways, particularly in magnocellular neurons (Butler et al., 2001). These neurons rely on
N-methyl-D-aspartate (NMDA)-type glutamate receptors, which may show dysfunctional
transmission in schizophrenia (Javitt, 2009). A review of motor symptoms and their
potential aetiology by Walther and Strik (2012) describes reductions in volume of the
anterior cingulate cortex and midbrain structures (putamen, caudate and thalamus), and
disturbed gamma-aminobutyric acid (GABA)-ergic neurotransmission in these areas and the
primary motor cortex. Neuroimaging techniques are of great use in measuring the
structural and physiological abnormalities that may contribute to sensorimotor
abnormalities in schizophrenia.
Magnetoencephalography (MEG) allows non-invasive inference of current flow in neuronal
cell assemblies through measurement of extracranial magnetic fields. MEG signals are
dominated by oscillations, which result from rhythmic activity in large populations of
5 characterised in healthy volunteers: in motor cortex, the amplitude of beta (13-30Hz)
oscillations decreases during movement (event-related beta desynchronisation (ERBD)) and
increases above baseline on movement cessation (post-movement beta rebound (PMBR)),
returning to baseline ~4s after movement offset (Pfurtscheller et al., 1999). In visual cortex,
a decrease in alpha (8-12Hz) oscillatory amplitude occurs alongside a concomitant increase
in gamma (30-70Hz) oscillations (Siegel et al., 2010). Notably, individual differences in the
amplitude of motor beta oscillations correlate with electromyogram measures of muscle
control (Jain et al., 2013; Mima et al., 2000), whilst visual gamma oscillations correlate with
orientation discrimination performance (Edden et al., 2009). Measurement of these
electrophysiological features is therefore likely to offer insight into the neuronal basis of
motor and visual deficits in schizophrenia.
Previous studies have identified electrophysiological visuomotor abnormalities in
schizophrenia and related disorders: Wilson et al (2011) showed that adolescents with
early-onset psychosis exhibit enhanced ERBD and reduced PMBR while conducting a motor task.
Since beta oscillations are thought to reflect inhibition (Cassim et al., 2001; Gaetz et al.,
2011), reduced amplitude may reflect a greater degree of processing required to plan and
execute movements in patients. In visual cortex, either no change (Uhlhaas et al., 2006) or a
reduction in amplitude (Grutzner et al., 2013) and frequency (Spencer et al., 2004) of
gamma oscillations have been reported in schizophrenia. However, available data are
sparse and typically relate to complex stimuli (e.g. faces or Gestalt stimuli) that require
integration of visual features. The question therefore remains of whether patients with
schizophrenia show abnormalities in oscillations reflecting low-level visual and motor
6 oscillations in visual cortex during a simple visuomotor task, to test the hypothesis that
these well characterised phenomena are perturbed in schizophrenia.
2. Methods
2.1. Participants. The study received ethical approval from the National Research Ethics
Service and all participants gave written informed consent. The patient group was recruited
from community-based mental health teams in Nottinghamshire, Derbyshire and
Lincolnshire, United Kingdom. Diagnoses were made in clinical consensus meetings through
a review of case files and a standardized clinical interview (Signs and Symptoms of Psychotic
Illness or SSPI (Liddle, 2002)) in accordance with the procedure of Leckman et al. (1982). All
patients were in a stable phase of illness with no change in antipsychotic, antidepressant, or
mood- stabilizing medications, nor a change of more than 10 points in occupational and
social function scored according to the Social and Occupational Function Assessment Scale
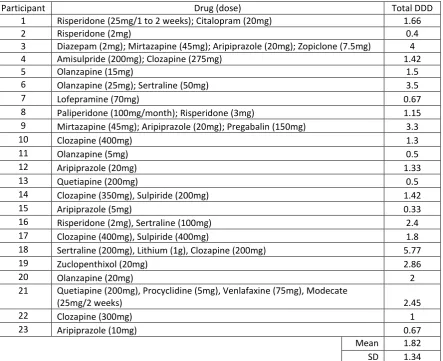
(SOFAS) (APA 1994), in the 6 weeks prior to the study. Patients were taking a range of
psychotropic medication, with a mean defined daily dose (DDD) of 1.8 (SD 1.3). Controls
were selected to match the patient group in terms of demographic variables. There were
seventeen male and six female patients with schizophrenia and the same number of male
and female controls. There was no significant difference between the ages of the two
groups (patients and controls’ mean age 26.8 (SD 7.0) and 26.7 (SD 7.2), respectively;
U=264.5, p=1.0). Groups were also matched for socio-economic background using the
National Statistics Socio-Economic Classification (NS-SEC) self-coded method. NS-SEC scores
are given in Table 1 and did not differ significantly between groups (χ2(4, N=46)=2.3, p=.69).
7 NSSEC score 1 2 3 4 5 Mean SD
Number of participants
[image:12.595.67.444.73.119.2]Schizophrenia 13 1 4 1 4 2.2 1.6 Controls 11 2 5 3 2 2.3 1.4 Table 1. National Statistics Socio-Economic Classification (NS-SEC) scores.
Participant Drug (dose) Total DDD
1 Risperidone (25mg/1 to 2 weeks); Citalopram (20mg) 1.66
2 Risperidone (2mg) 0.4
3 Diazepam (2mg); Mirtazapine (45mg); Aripiprazole (20mg); Zopiclone (7.5mg) 4
4 Amisulpride (200mg); Clozapine (275mg) 1.42
5 Olanzapine (15mg) 1.5
6 Olanzapine (25mg); Sertraline (50mg) 3.5
7 Lofepramine (70mg) 0.67
8 Paliperidone (100mg/month); Risperidone (3mg) 1.15 9 Mirtazapine (45mg); Aripiprazole (20mg); Pregabalin (150mg) 3.3
10 Clozapine (400mg) 1.3
11 Olanzapine (5mg) 0.5
12 Aripiprazole (20mg) 1.33
13 Quetiapine (200mg) 0.5
14 Clozapine (350mg), Sulpiride (200mg) 1.42
15 Aripiprazole (5mg) 0.33
16 Risperidone (2mg), Sertraline (100mg) 2.4
17 Clozapine (400mg), Sulpiride (400mg) 1.8
18 Sertraline (200mg), Lithium (1g), Clozapine (200mg) 5.77
19 Zuclopenthixol (20mg) 2.86
20 Olanzapine (20mg) 2
21 Quetiapine (200mg), Procyclidine (5mg), Venlafaxine (75mg), Modecate
(25mg/2 weeks) 2.45
22 Clozapine (300mg) 1
23 Aripiprazole (10mg) 0.67
Mean 1.82 SD 1.34 Table 2. Details of patients’ pharmacological treatment including the drug, its dose and the
total defined daily dose (DDD) of psychotropic medication for each participant. Doses are
per day unless given as a depot, in which case the frequency is specified.
2.2 Symptom severity measurement. In order to derive a score for overall severity of
psychotic illness in the patient group, we followed the procedure employed by Palaniyappan
et al. (2013). We computed the first principle component of: the scores for the three
[image:12.595.77.521.168.529.2]8 disorganization) assessed using the SSPI; speed of cognitive processing assessed using a
variant of the Digit Symbol Substitution Test (Wechsler, 1944); and scores from the Social
and Occupational Function Scale (SOFAS; (APA, 1994)). Unlike Palaniyappan et al. (2013),
who focussed on chronic symptom burden, we did not include duration of illness in our
measure of current illness severity.
2.3. Paradigm. The task comprised visual stimulation with a centrally-presented maximum
contrast vertical square wave grating (3 cycles per degree), which subtended an 8° visual
angle and was displayed behind a red fixation cross on a mean luminance background. The
grating was presented for two seconds followed by a seven second fixation only baseline
period. Participants were instructed to press a button with their right index finger regularly
but as many times as they chose during the 2s presentation of the grating, though ensuring
that they didn’t press so vigorously as to cause their arm to move. There were 45 trials,
giving a total task length of seven minutes. A short practice of the task was given outside
the scanner. Stimuli were generated on a PC using MATLAB (The Mathworks, Inc., Natick,
MA) and were back-projected via a mirror system onto a screen inside a magnetically
shielded room at a viewing distance of 46cm. All participants were scanned in a supine
position. Right index finger button presses were recorded via a response pad (Lumitouch
Photon Control Response System).
2.4. Data acquisition and analysis. MEG data were obtained using a 275 channel whole
head CTF system (MISL, Coquitlam, Canada), with four channels switched off due to
excessive sensor noise. Twenty-nine reference channels were also recorded for noise
9 gradiometer measurements (Vrba et al., 2001). Data were acquired at a sampling frequency
of 600Hz with a 150Hz low-pass anti-aliasing hardware filter. The position of the head
within the MEG helmet was measured continuously during the recording by energising three
electromagnetic head position indicator coils located at the nasion and left and right
pre-auricular points, allowing continuous head movement tracking throughout the acquisition.
A 3-dimensional digitisation of the head shape and fiducial locations was obtained using an
Isotrak (Polhemus Inc., Vermont) system prior to the MEG measurement. All participants
also underwent an anatomical MRI scan, acquired using a Philips Achieva 7T system with a
volume transmit and 32 channel receive head coil. A 1mm isotropic image was obtained
using an MPRAGE sequence (TE/TR = 3/7ms, FA=8°). Coregistration of the MEG sensor
geometry to the anatomical MR image was achieved by fitting the digitised head surface to
the equivalent head surface extracted from the anatomical MR image.
Initially, MEG data were inspected visually. Common sources of interference, for example
the magnetomyogram, magnetooculogram and magnetocardiogram, have well
characterised neuromagnetic signatures which are easily identified by an experienced
operator. Here, any trials deemed to contain excessive interference generated via such
sources were removed from that individual’s data (see also Gross et al. (2013)). Head
movement was assessed via continuous head localisation and any trials in which the head
was found to be more than 7mm (Euclidean distance) from the starting position were
excluded. This left an average of 42 trials (SD 3.6) in controls and 38 (SD 4.9) trials in
patients. Lead fields were computed individually for each participant using a
multiple-local-sphere head model (Huang et al., 1999) and the dipole model derived by Sarvas (1987). A
10 project extracranial field signals into source space. Images showing the spatial signature of
task induced oscillatory power change were computed in the beta (13-30Hz) and gamma
(30-70Hz) ranges. In both cases, an active window of 0.5-1.8s was compared to a control
window spanning 7.0-8.3s, relative to stimulus onset. Covariance matrices for beamformer
reconstruction were calculated individually for the active and control windows, giving even
amounts of data and thus ensuring equivalent accuracy (Brookes et al., 2008). The resulting
pseudo-t-statistical images were used to derive the locations of the peak decrease in beta
band oscillations in left motor cortex and the peak increase in gamma oscillations in visual
cortex in each participant, which were used for further analyses (see Figures 1e and f for a
representative example). Note that since both peaks were identified from the active period
contrasted with the baseline, the motor cortex (ERBD) peak was also used for analysis of the
PMBR.
Virtual sensor timecourses were constructed for these peak locations also using a
beamformer spatial filter. Beamforming was applied to data filtered into the 1-150Hz band
and the covariance matrix was generated using data spanning the entire experiment. The
spatially filtered (virtual sensor) timecourses were sequentially filtered (temporally) into 23
overlapping frequency bands in the range of 1-100Hz using a firls filter implemented in
NUTMEG (http://nutmeg.berkeley.edu). For each band, the Hilbert envelope was calculated
and averaged across task trials. A resting baseline signal was estimated as the mean Hilbert
envelope within the 7.0-8.3s window, relative to stimulus onset, and the percentage
difference in signal from this baseline was calculated across the trial averaged timeseries for
all frequency bands. These individual frequency bands were then concatenated to generate
11 control groups (Figure 1). The percentage change from baseline for the beta
desynchronisation was taken from the 0.5-1.8s window, during which participants were
moving, but which allowed time for participants to react to the stimulus onset. The beta
rebound signal was taken from the 2.3-4.3s window, based on the observed signal in a time
frequency spectrogram averaged over all patients and controls. In both cases a 13-30Hz
frequency range was used. To test gamma band amplitude in visual cortex, the percentage
change from baseline was computed in the 30-70Hz frequency window in the 0.5-1.8s time
window, in order to obtain only the sustained gamma response and not the initial gamma
spike. These data are shown in Figure 2. Pseudo t-statistical images for Figure 1 were
visualised using mri3dX (Singh, CUBRIC, Cardiff). Statistical analysis was carried out in SPSS
(Armonk, NY: IBM Corp.) and MATLAB (The Mathworks Inc., Natick, MA).
3. Results
The task was well tolerated by all patients and controls. Across all 46 participants, two
patients and two controls failed to show a well localised beta desynchronisation peak in the
motor cortex and one patient did not show a clear gamma peak in visual cortex. These
participants were excluded from analysis of these voxels, giving a total of 21 patients and
controls contributing to analysis of motor beta, and 22 patients and 23 controls for visual
12
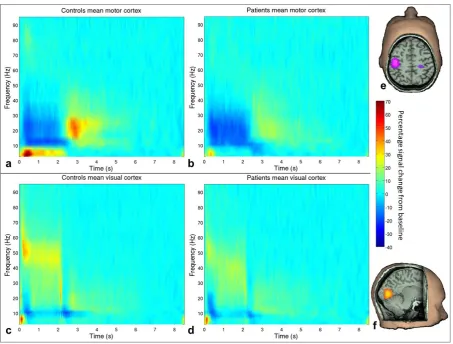
Figure 1: Time frequency spectrograms. Percentage change from baseline in the
trial-averaged signal at the locations of individuals’ peak decrease in motor beta (a&b) and
increase in visual gamma (c&d) during stimulation. Data are averaged across controls (a&c)
and patients (b&d). Visual stimulation and motor responses were from 0-2s. On the right
are example pseudo t-statistical images from a single representative subject showing the
spatial signature of the beamformed signal in the stimulus window (0.5-1.8s) contrasted
with a baseline window (7-8.3s) in the beta (13-30Hz ) band (e) and gamma (30-70Hz) band
(f).
Figure 1 shows time frequency spectrograms, averaged across task trials and participants,
for patients and controls at the motor and visual locations of interest. Both groups exhibit
[image:17.595.72.526.68.412.2]13 trial: in motor cortex, beta amplitude decreases during stimulation with a PMBR on
movement cessation; and in visual cortex, there is a decrease in alpha oscillatory amplitude
and a concomitant increase in gamma amplitude during stimulation. As hypothesised, there
were differences between patients and controls in features of these typical response
profiles.
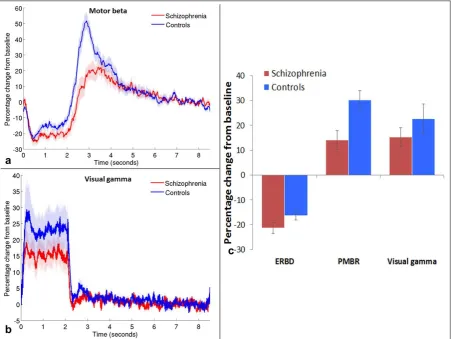
Figure 2: Beta and gamma band responses. Mean timecourse of beta band amplitude in
motor cortex (a) and gamma band amplitude in visual cortex (b), measured as a percentage
difference from baseline (7-8.3s); shaded areas show standard error of the mean (SEM)
across participants. c) Mean percentage signal change from baseline in motor cortex during
[image:18.595.74.526.248.587.2]14 (PMBR; 2.3-4.3s); and in visual gamma oscillations during stimulation (0.5-1.8s). Error bars
represent SEM.
Figures 2a and 2b show the timecourses of percentage signal change in oscillatory
amplitude from baseline (7.0-8.3s) for the beta band (13-30Hz) in the motor cortex (a) and
the gamma band (30-70Hz) in the visual cortex (b) for patients (red) and controls (blue). The
mean percentage changes during ERBD, PMBR and visual stimulation are shown in Figure 2c
for both groups. ERBD and visual gamma were measured in the 0.5-1.8s window, the PMBR
was measured from 2.3-4.3s. Note that the largest difference between patients and
controls is in the PMBR, which shows a 30% increase from baseline in controls, and only a
14% increase in patients.
Interestingly, behavioural data indicated that on average, patients made more button
presses per trial (mean 6.83 presses, between subjects standard deviation (SD) 2.18, within
subjects SD 1.03) than controls (mean 5.27 presses, between subjects SD 2.02, within
subjects 0.60). This difference in these ‘button press counts’ was statistically significant
(t(44)=-2.52; p=.016). However, the mean time of the last button press in each trial was
similar for patients (1.92s, SD 0.34) and controls (1.89s, SD 0.19) (U=33; p=.156). These
results indicate that on average, patients with schizophrenia pressed the button more
frequently in the allocated time period than controls but not for longer; therefore patients
tended to press faster than controls. In order to investigate MEG data from groups with
comparable behaviour, participants who pressed on average between four and eight times
per trial were selected for initial analyses, based on the overlap of the distributions of
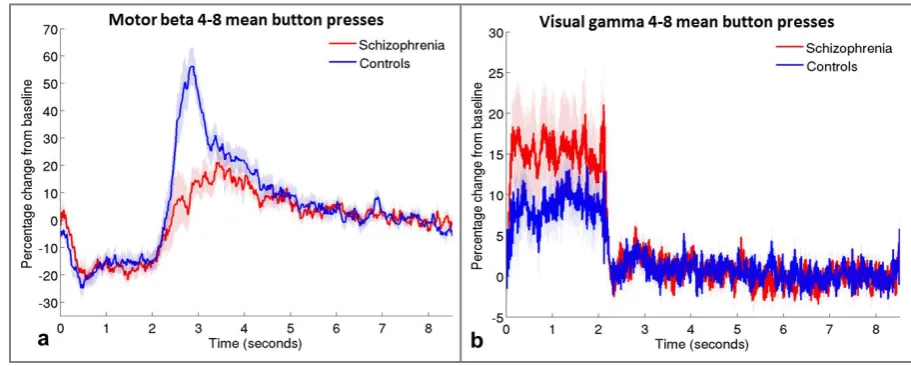
15 patients. Responses from these subgroups are presented in Figure 3. Note that the
difference between groups in the PMBR remains, suggesting qualitatively that this effect is
[image:20.595.68.524.188.371.2]not simply accounted for by the different numbers of button presses in the two groups.
Figure 3: Timecourses for groups with equivalent numbers of button presses. Mean motor
beta (a) and visual gamma (b) timecourses in groups of patients (red, N=12) and controls
(blue, N=13) who made similar numbers of button presses (mean of 4-8 presses per trial).
Shaded areas are SEM across participants.
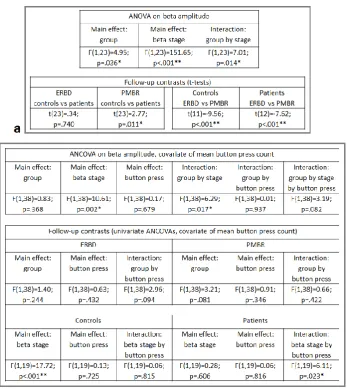
Statistical analysis of these behaviourally comparable data was conducted with a repeated
measures analysis of variance (ANOVA), the results of which are shown in Table 3a. This
analysis indicated that when beta amplitude was summed across both stages of the
response, patients showed a slightly lower amplitude response than controls. However, the
difference in beta amplitude between the groups was dependent on the stage (ERBD or
PMBR) of the response, in that the two groups showed very similar ERBD but the PMBR was
significantly reduced in patients. As expected, the PMBR was significantly greater than the
16 using a Mann-Whitney U-test, because these data were not normally distributed. There
was no significant difference in gamma amplitude in visual cortex between the two groups
(U=83; p=.810).
Table 3. Results of a repeated measures ANOVA on beta amplitude in the subgroup with
comparable behavioural responses (a), with the between subjects factor of group (patients
and controls) and within subjects factor of beta stage (ERBD and PMBR). The same
contrasts but with the covariate of mean button press count are presented in the ANCOVA
[image:21.595.86.435.185.575.2]17 The difference between groups in the mean number of button presses made per trial (the
button press count) warranted further investigation in relation to its impact on the MEG
data from the full cohort of participants. An analysis of covariance was therefore conducted
on the beta responses of all participants with button press count included as a covariate.
The results of this analysis are presented in Table 3b. In this analysis, the overall difference
between groups in the sum of beta amplitude across the two stages was not statistically
significant; however, again there was a difference between the way in which the two groups
responded at the two stages of the beta response (shown by the significant group by stage
statistical interaction). Follow-up univariate ANCOVAs conducted on each group separately
and on each stage separately indicated that while the mean amplitudes of ERBD and PMBR
were not significantly different between the groups, controls showed a significant increase
from ERBD to PMBR (the peak-to-peak ‘beta difference’), irrespective of the number of
button presses, whereas in patients, the beta difference was related to button press count:
individuals who pressed the button more often showed a greater increase from ERBD to
PMBR (correlation between beta difference and button press count R2=0.23; p=.029). This
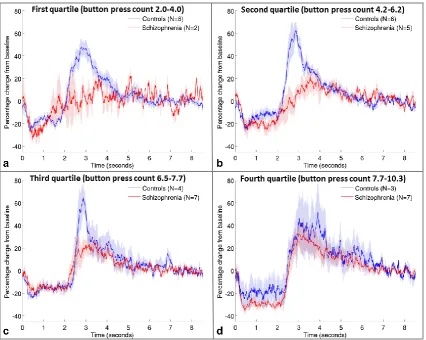
effect can be observed in Figure 4, which shows that for patients in the lowest quartile of
mean button press counts, there is little change between the two beta stages, but as button
press count increases, the beta difference in patients increases and the timecourse becomes
more similar to controls. Controls show similar timecourses regardless of how many times
they press the button (correlation of beta difference with button press count R2=0.02;
p=.494). Figure 4 again suggests that the PMBR is more affected by schizophrenia than
ERBD; however there are insufficient numbers of participants to statistically test the group
18
Figure 4: Effect of number of button presses. Mean beta timecourses for groups of patients
(red) and controls (blue), defined by the quartiles of mean button press count across all
volunteers, from lowest (a) to highest (d). Shaded areas represent SEM across all trials.
Visual gamma was analysed using a univariate ANCOVA with mean button presses as a
covariate. There was no significant difference between patients and controls’ visual gamma
amplitude (F(1,41)=.08; p=.780) and the button press count did not influence visual gamma
(main effect of button presses: F(1,41)=1.45; p=.236, and interaction between group and
button presses: F(1,41)=.64; p=.428).
To investigate the influence of medication on the electrophysiological measures obtained, in
19 of psychotropic medication was considered as an additional covariate in the contrast
between beta stages. Taking DDD into consideration did not alter the results: patients with
lower button press counts showed a smaller beta difference than those with higher button
press counts, regardless of their dose of antipsychotic medication (significant beta
stage*button press count interaction (F(1,17)=5.04; p=.038); non-significant main effects of
beta stage, button press count and DDD, and all other interactions between these variables
(all F(1,17)<1.89); p>.187). To assess the relationship between DDD and gamma, the
correlation between 10,000 randomly paired gamma and DDD values was obtained, and the
measured correlation was compared with the upper and lower 2.5% of values in the
resulting distribution of correlations, to assess the probability of obtaining a correlation of
the measured strength. DDD did not relate significantly to gamma amplitude in patients
(R=-0.07; p=ns; 95% CI [-0.367 and 0.486]). These findings indicate that medication did not
have a significant effect on motor beta or visual gamma oscillations.
Scores of overall severity of persisting psychotic illness exhibited a significant negative
Pearson correlation with the PMBR in the patient group (R=-0.52; p=.015; Figure 5), with no
correlation between illness severity and ERBD or visual gamma (R=-.18 and .06 respectively;
p=ns). The scores for the three core syndromes of schizophrenia loaded positively on the
illness severity measure, while social, occupational and cognitive function loaded negatively
on it (see table 4), so those patients with higher severity scores had stronger core symptoms
and lower levels of function. These were also the patients who showed the smallest beta
20
Figure 5: Correlation between PMBR and severity of persisting psychotic illness. The
amplitude of the post-movement beta rebound showed a significant negative correlation
with a measure of overall psychotic illness severity persisting during a stable phase of illness
in the patient group.
Illness severity measure Loading on severity of persisting illness factor
Reality distortion 0.72
Psychomotor poverty 0.61
Disorganisation 0.58
DSST -0.37
SOFAS -0.67
Table 4: Loadings on the first factor derived from factor analysis of clinical features
hypothesised to reflect current severity of illness: reality distortion, psychomotor poverty and
disorganisation syndromes from the Signs and Symptoms of Psychotic Illness (SSPI) scale
(Liddle, 2002); and scores from the Digit Symbol Substitution Test (DSST; Wechsler, 1944)
and the Social and Occupational Function Assessment Scale (SOFAS; APA, 1994).
An additional interesting feature of the time-frequency spectrograms (Figure 1) was the
[image:25.595.75.293.69.259.2] [image:25.595.75.453.428.513.2]21 hypothesis, but were contrasted in non-planned post-hoc comparisons of the stimulation
period (0.5-1.8s). Patients showed significantly reduced theta in motor cortex (U=78;
p<.001), while the difference in visual cortex was not significant (t(43)=.62; p=.542).
In summary, the results indicate that in groups of participants matched for performance on
a self-paced button press task, the amplitude of post-movement beta oscillations is reduced
in patients with schizophrenia compared with controls. Beta reactivity, reflected in the
change from the desynchronisation during movement to synchronisation following
movement was reduced in patients who pressed the button less often. Visual gamma did
not differ significantly between groups. Theta oscillations were reduced in patients’ motor
but not visual cortex.
4. Discussion
Deficits in sensorimotor function have been a well-established feature of schizophrenia
since the earliest descriptions of the disease; however, despite their prevalence and impact,
few studies have probed the neuronal mechanisms underlying these symptoms. In this
study, we measured the electrophysiological signature of visual and motor processing in
patients with schizophrenia and matched healthy control subjects using MEG. Our results
show that the characteristic profiles of oscillatory responses to visual and motor stimulation
are preserved in schizophrenia. However, significant differences in neuronal dynamics are
observed in patients relative to controls. Specifically, the well-characterised temporal
signature of beta oscillations in motor cortex during finger movement differs between the
two groups: when matched for behaviour, patients showed a reduced PMBR, while their
22 in our self-paced motor task showed significantly less of a difference between the ERBD and
PMBR stages of the trial than those who pressed very rapidly. Patients who pressed rapidly
showed beta timecourses that were similar to controls, in whom clear ERBD and PMBR
responses were present regardless of their mean button press count. There was no
significant difference in visual gamma oscillations between groups. Our results therefore
indicate abnormalities in basic sensorimotor processing in patients with schizophrenia.
The differences in beta oscillatory response profiles between patients and controls provide
a potential neuronal correlate of known motor disturbances in schizophrenia. There are
various theories as to the roles that beta desynchronisation and rebound play in the
generation and inhibition of movement. At rest, beta oscillations in motor cortex may
control tonic contractions involved in maintenance of posture, while simultaneously
inhibiting additional movements (Gilbertson et al., 2005). Decreases in beta synchrony
during or preceding a movement may therefore reflect a switch to a state in which a greater
range of movements can be made, since reduced synchrony allows greater flexibility to
encode information in cellular assemblies (McIntosh et al., 2008). The increase in beta
power following a movement has been suggested to reflect inhibition of motor activity:
voluntary movements are slowed both during periods of beta oscillations as measured using
electrocorticograms (Gilbertson et al., 2005), and when beta rhythms are entrained using
transcranial alternating-current stimulation (Pogosyan et al., 2009). This post-movement
inhibition may facilitate motor control by preventing repetition or generation of further
movements and returning postural stability. Evidence for this theory comes from findings
that the PMBR is almost absent in young children but increases through development (Gaetz
23 poorly controlled, both ERBD and PMBR are reduced in amplitude compared with controls
(Heinrichs-Graham et al., 2014; Pollok et al., 2012). Beta oscillations may also reflect
long-range communication between brain regions, whereas gamma oscillations reflect more local
processing (Donner et al., 2011). In the context of these theories, the reduced reactivity of
motor cortex in schizophrenia observed in this study may reflect maintenance of tonic
contractions and reduced flexibility of responses during movements; reduced inhibitory
control allowing efficient termination of the movement; and/or limited ability to switch
between long-range and local communication between neurons.
Growing evidence suggests that both beta and gamma oscillations in the cortex depend
upon a delicate balance between excitation and inhibition (Brunel et al., 2003; Kopell et al.,
2000), governed largely but not exclusively by glutamate and gamma-aminobutyric acid
(GABA), which are the principal excitatory and inhibitory neurotransmitters, respectively.
There is a large amount of evidence for disruption to this balance in schizophrenia caused by
GABAergic abnormalities (Lewis, 2014; Rowland et al., 2008), including reductions in levels
of GAD, the enzyme necessary for synthesis of GABA from glutamate, and in the mRNA that
codes for GAD and for the GABA transporter and receptors (Shin et al., 2011). There are
also reductions in the volume of pyramidal neurons (Sweet et al., 2004) and in the number
of parvalbumin expressing GABAergic inhibitory interneurons, which are involved in the
generation of gamma oscillations (Lewis, 2014). Deletion of a gene coding for a receptor for
neuroregulin molecules, which are involved in regulating neuronal development in
parvalbumin interneurons, causes reorganisation of cortical networks, increases oscillatory
activity particularly in the gamma frequency and leads to schizophrenia-like symptoms
24 Pino et al., 2013). Restoring normal levels of neuroregulin reverses these symptoms (Marin
et al., 2013). These animal studies strongly suggest a link between abnormalities in
parvalbumin interneurons and schizophrenia.
In contrast with previous findings (Grutzner et al., 2013; Shin et al., 2011; Spencer et al.,
2004; Sun et al., 2013), our study did not show significant reductions in gamma oscillations
in the visual cortex of patients with schizophrenia, although the difference observed was in
this direction. The link between GABAergic inhibition and beta oscillations has been
assessed by an in vitro study showing generation of beta oscillations in neuronal assemblies
of cortical layer V (Roopun et al., 2006), a magnetic resonance spectroscopy (MRS) study
showing a positive correlation between GABA and PMBR power (Gaetz et al., 2011) and a
pharmacological study showing that blocking GABA uptake increases ERBD and decreases
PMBR amplitude (Muthukumaraswamy et al., 2012). Impaired GABAergic
neurotransmission in schizophrenia may therefore contribute to the decrease in amplitude
of beta oscillations observed in patients in our study.
In patients, the difference between beta desynchronisation and rebound was greater and
more similar to controls when they pressed the button at a faster rate (Figure 4). PMBR in
response to median nerve stimulation is reduced by ERBD generated during simultaneous
movement, and this effect is greater as the amount of motor activity increases (e.g. passive
stretch compared with exploratory finger movement (Salenius et al., 1997), or imagined
compared with performed movement (Schnitzler et al., 1997)), but direct measurement of
the effects of movement complexity or frequency on the movement-related beta response
25 of the patients with schizophrenia in this study may arise from the observed abnormalities
in beta reactivity. Such an effect could be due to impaired communication between motor
cortex and higher order cortical regions, and/or to altered neurotransmission; however,
these suggestions are speculative and would require further study using measures of
functional connectivity and transmitter concentration or cycling rates. On average, patients
tended to exhibit a higher button press count compared with controls. It is not clear why
this was the case; it may represent a form of coping strategy, given that with higher button
press counts, the beta timecourse became more similar to controls. This behaviour
somewhat masked abnormalities in beta oscillations that would likely have been more
striking had only one button press been required.
Use of a task with self-paced movements and subsequent analysis of data taking into
consideration the button press count has revealed interesting differences in the beta
oscillatory profiles between the two groups that would not otherwise have been evident.
Another significant advantage of the paradigm presented here is that it is short, simple and
is suitable for individuals of all cognitive abilities. The ability to measure differences
between patients with schizophrenia and controls in such a basic paradigm is promising for
eventual translation of similar approaches into clinical practice. This MEG approach, which
permits investigation of neuronal activity within brain networks of patients and healthy
volunteers, also reduces the need to conduct similar studies in animal models of mental
health disorders.
It is important to consider the effect of medication on the electrophysiological measures
26 dopaminergic function (Castle et al., 2013) and some were taking antidepressants, which
enhance serotonergic or noradrenergic mechanisms (Feighner, 1999). Because dopamine
has an inhibitory effect on cortical activity (Ciccone, 2015), antipsychotics tend to shift the
balance of activity towards cortical excitation. There is evidence from preclinical studies
that chronic administration of antipsychotics can reduce steady state oscillatory power in
the gamma frequency (Anderson et al., 2014), while non-invasive neuroimaging has shown
enhanced steady state delta and theta but reduced alpha and beta amplitude after
administration of antipsychotics in healthy volunteers (Galderisi et al., 1996; Hubl et al.,
2001). The observation that taking into account patients’ daily dose of psychotropic
medication did not alter the results, together with evidence from other studies indicating
that oscillatory abnormalities are present in unmedicated patients with schizophrenia
(Boutros et al., 2008; Gallinat et al., 2004; Sun et al., 2013) and in first degree relatives
(Hong et al., 2012) suggests that the abnormalities observed in our study are unlikely to be
attributable to medication. Nevertheless, further investigation into the impact of
medication on the responses measured in this study is warranted.
The PMBR was inversely correlated with a score of overall severity of psychotic illness
assessed during a stable phase of the illness. The scores for the three core syndromes of
schizophrenia loaded positively on the illness severity measure, while social, occupational
and cognitive function loaded negatively on it (Table 4). The magnitude of the DSST loading
is lower than for the other items, but DSST score was retained because the set of items were
selected a priori as a measure of illness severity (Palaniyappan et al., 2013) and a
27 inefficiency of information processing that is an important feature of schizophrenia
(Dickinson et al, 2007).
Similar to previous studies (e.g. Liddle, 1987b), the three syndrome scores showed low
mutual correlations (0.033 to 0.33; p<.05), but all three loaded heavily on a single factor,
along with the SOFAS and DSST scores, indicating that they are associated with a latent
variable likely to reflect severity of illness. Scores on this composite measure of overall
current severity of psychotic illness exhibited a significant negative Pearson correlation with
the PMBR in the patient group (R=-0.52; p=.015; Figure 5), with no correlation between
illness severity and ERBD or visual gamma (R=-.18 and .06 respectively; p=ns). Therefore,
those patients with higher severity scores had stronger core symptoms and lower levels of
function and these were also the patients who showed the smallest beta rebound.
In conclusion, abnormalities in perceptual processing and psychomotor performance are key
aspects of the pathophysiology that influences functional outcome in schizophrenia (Boden
et al., 2014; Javitt, 2009). Electrophysiological biomarkers for these deficits can be
identified using non-invasive neuroimaging techniques (Javitt et al., 2008) and they can be
modified using targeted training (Adcock et al., 2009). We have used a simple visuomotor
task and MEG imaging to show abnormalities in the dynamics of beta oscillations in motor
cortex, giving direct electrophysiological evidence to support theories of impaired cortical
inhibition in schizophrenia. Consistent with our current understanding of GABA-glutamate
dysfunction in this illness, our findings raise the possibility of targeting the visuomotor
system for behavioural training and pharmacological treatments in patients with
28
Acknowledgments
The authors acknowledge the Medical Research Council (MRC) and the Dr Hadwen Trust for
Humane Research, the UK's leading medical research charity funding exclusively non-animal
research techniques to replace animal experiments, for funding Dr Robson and contributing
to scan costs. Additional funding was also provided by the University of Nottingham Faculty
Research Strategy Fund. Dr Brookes was funded by a Medical Research Council New
Investigator Research Grant (MR/M006301/1). Dr Palaniyappan is supported by the
Wellcome Trust. Dr Katshu is supported by a Medical Research Council Clinical Research
Fellowship. The authors also acknowledge Barbara Keogh, Jon Lander, Claire Litherland and
Graham Spencer for assistance with recruitment. The authors have no conflicts of interest
to declare.
References
Adcock RA, Dale C, Fisher M, Aldebot S, Genevsky A, Simpson GV, Nagarajan S,
Vinogradov S (2009). When top-down meets bottom-up: auditory training enhances verbal memory in schizophrenia. Schizophr Bull 35:1132-1141.
Anderson PM, Pinault D, O'Brien TJ, Jones NC (2014). Chronic administration of
antipsychotics attenuates ongoing and ketamine-induced increases in cortical gamma oscillations. Int J Neuropsychopharmacol 17:1895-1904.
APA (1994). Diagnostic and statistical manual of mental disorders (4 ed.). Washington, DC: American Psychiatric Association.
Boden R, Abrahamsson G, Holm G, Borg J (2014). Psychomotor and cognitive deficits as predictors of 5-year outcome in first-episode schizophrenia. Nordic Journal of Psychiatry 68:282-288.
Bombin I, Arango C, Buchanan RW (2005). Significance and meaning of neurological signs in schizophrenia: two decades later. Schizophr Bull 31:962-977.
Boutros NN, Arfken C, Galderisi S, Warrick J, Pratt G, Iacono W (2008). The status of spectral EEG abnormality as a diagnostic test for schizophrenia. Schizophr Res 99:225-237.
Brookes MJ, Vrba J, Robinson SE, Stevenson CM, Peters AM, Barnes GR, Hillebrand A, Morris PG (2008). Optimising experimental design for MEG beamformer imaging. Neuroimage 39:1788-1802.
29
Butler PD, Schechter I, Zemon V, Schwartz SG, Greenstein VC, Gordon J, Schroeder CE, Javitt DC (2001). Dysfunction of early-stage visual processing in schizophrenia. The American Journal of Psychiatry 158:1126-1133.
Cadenhead KS, Dobkins K, McGovern J, Shafer K (2013). Schizophrenia spectrum participants have reduced visual contrast sensitivity to chromatic (red/green) and luminance (light/dark) stimuli: new insights into information processing, visual channel function, and antipsychotic effects. Front Psychol 4:535.
Cassim F, Monaca C, Szurhaj W (2001). Does post-movement beta synchronization reflect an idling motor cortex? NeuroReport 12:3859-3863.
Castle D, Keks N, Newton R, Schweitzer I, Copolov D, Paoletti N, Burrows G, Tiller J (2013). Pharmacological approaches to the management of schizophrenia: 10 years on. Australas Psychiatry 21:329-334.
Chen Y, Chen Y, Mak F (2000). Soft neurological signs in schizophrenic patients and their nonpsychotic siblings. The Journal of Nervous and Mental Disease 188:84-89. Ciccone CD (2015). Pharmacology in Rehabilitation (5 ed.). Philadelphia: F.A. Davis
Company.
Del Pino I, Garcia-Frigola C, Dehorter N, Brotons-Mas JR, Alvarez-Salvado E, Martinez de Lagran M, Ciceri G, Gabaldon MV, Moratal D, Dierssen M, Canals S, Marin O, Rico B (2013). Erbb4 deletion from fast-spiking interneurons causes schizophrenia-like phenotypes. Neuron 79:1152-1168.
Dickerson F, Boronow JJ, Ringel N, Parente F (1996). Neurocognitive deficits and social functioning in outpatients with schizophrenia. Schizophrenia Research 21:75-83. Dickinson D, Ramsey ME, Gold JM. (2007) . Overlooking the obvious: a meta-analytic
comparison of digit symbol coding tasks and other cognitive measures in schizophrenia. Archives of General Psychiatry. 64(5):532-42.
Donner TH, Siegel M (2011). A framework for local cortical oscillation patterns. Trends Cogn Sci 15:191-199.
Edden RA, Muthukumaraswamy SD, Freeman TC, Singh KD (2009). Orientation discrimination performance is predicted by GABA concentration and gamma oscillation frequency in human primary visual cortex. J Neurosci 29:15721-15726. Feighner JP (1999). Mechanism of action of antidepressant medications. Journal of Clinical
Psychiatry 60:4-11.
Gaetz W, Edgar JC, Wang DJ, Roberts TPL (2011). Relating MEG measured motor cortical oscillations to resting γ-Aminobutyric acid (GABA) concentration. Neuroimage 55:616-621.
Gaetz W, Macdonald M, Cheyne D, Snead OC (2010). Neuromagnetic imaging of movement-related cortical oscillations in children and adults: age predicts post-movement beta rebound. Neuroimage 51:792-807.
Galderisi S, Mucci A, Bucci P, Mignone M, Maj M (1996). Multilead quantitative EEG profile of clozapine in resting and vigilance-controlled conditions. Psychiatry Research 67:113-122.
Gallinat J, Winterer G, Herrmann CS, Senkowski D (2004). Reduced oscillatory gamma-band responses in unmedicated schizophrenic patients indicate impaired frontal network processing. Clin Neurophysiol 115:1863-1874.
Gilbertson T, Lalo E, Doyle L, Di Lazzaro V, Cioni B, Brown P (2005). Existing motor state is favored at the expense of new movement during 13-35 Hz oscillatory synchrony in the human corticospinal system. J Neurosci 25:7771-7779.
30
JM (2013). Good practice for conducting and reporting MEG research. Neuroimage 65:349-363.
Grutzner C, Wibral M, Sun L, Rivolta D, Singer W, Maurer K, Uhlhaas PJ (2013). Deficits in high- (>60 Hz) gamma-band oscillations during visual processing in schizophrenia. Front Hum Neurosci 7:88.
Heinrichs-Graham E, Wilson TW, Santamaria PM, Heithoff SK, Torres-Russotto D, Hutter-Saunders JA, Estes KA, Meza JL, Mosley RL, Gendelman HE (2014). Neuromagnetic evidence of abnormal movement-related Beta desynchronization in Parkinson's
disease. Cereb Cortex 24:2669-2678.
Hong LE, Summerfelt A, Mitchell BD, O'Donnell P, Thaker GK (2012). A shared low-frequency oscillatory rhythm abnormality in resting and sensory gating in schizophrenia. Clin Neurophysiol 123:285-292.
Huang MX, Mosher JC, Leahy RM (1999). A sensor-weighted overlapping-sphere head model and exhaustive head model comparison for MEG. Physics in Medicine and Biology 44:423-440.
Hubl D, Kleinlogel H, Frolich L, Weinandi T, Maurer K, Holstein W, Czekalla J, Dierks T (2001). Multilead quantitative electroencephalogram profile and cognitive evoked potentials (P300) in healthy subjects after a single dose of olanzapine.
Psychopharmacology (Berl) 158:281-288.
Jahn T, Hubmann W, Karr M, Mohr F, Schlenker R, Heidenreich T, Cohen R, Schroder J (2006). Motoric neurological soft signs and psychopathological symptoms in schizophrenic psychoses. Psychiatry Res 142:191-199.
Jain S, Gourab K, Schindler-Ivens S, Schmit BD (2013). EEG during pedaling: evidence for cortical control of locomotor tasks. Clin Neurophysiol 124:379-390.
Javitt DC (2009). Sensory processing in schizophrenia: neither simple nor intact. Schizophr Bull 35:1059-1064.
Javitt DC, Spencer KM, Thaker GK, Winterer G, Hajos M (2008). Neurophysiological biomarkers for drug development in schizophrenia. Nat Rev Drug Discov 7:68-83. Keri S, Antal A, Szekeres G, Benedek G, Janka Z (2002). Spatiotemporal Visual Processing
in Schizophrenia. Journal of Neuropsychiatry and Clinical Neuroscience 14:190-196. Kopell N, Ermentrout GB, Whittington MA, Traub RD (2000). Gamma rhythms and beta
rhythms have different synchronization properties. Proc Natl Acad Sci U S A 97:1867-1872.
Kraepelin E (1919). Dementia praecox and paraphrenia (R Barclay, Trans.). Edinburgh: E&S Livingstone.
Leckman J, Sholomskas D, Thompson D, Belanger A, Weissman M (1982). Best estimate of lifetime psychiatric diagnosis: A methodological study. Archives of General
Psychiatry 39:879-883.
Lehoux C (2003). Fine motor dexterity is correlated to social functioning in schizophrenia. Schizophr Res 62:269-273.
Lewis DA (2014). Inhibitory neurons in human cortical circuits: substrate for cognitive dysfunction in schizophrenia. Curr Opin Neurobiol 26:22-26.
Liddle PF (1987). Schizophrenic syndromes, cognitive performance and neurological dysfunction. Psychological Medicine 17:49-57.
Liddle PF (1987b) The symptoms of chronic schizophrenia: a re-examination of the positive-negative dichotomy. British Journal of Psychiatry, 151: 145-151.
Liddle PF (2002). Signs and Symptoms of Psychotic Illness (SSPI): a rating scale. The British Journal of Psychiatry 180:45-50.
31
McIntosh AR, Kovacevic N, Itier RJ (2008). Increased brain signal variability accompanies lower behavioral variability in development. PLoS Comput Biol 4:e1000106.
Methodology WHOCCfDSa (2012). Guidelines for ATC classification and DDD assignment 2013. Oslo, Norway.
Mima T, Steger J, Schulman AE, Gerloff C, Hallett M (2000). Electroencephalographic measurement of motor cortex control of muscle activity in humans. Clin Neurophysiol 111:326-337.
Muthukumaraswamy SD, Myers JF, Wilson SJ, Nutt DJ, Lingford-Hughes A, Singh KD, Hamandi K (2012). The effects of elevated endogenous GABA levels on movement-related network oscillations. Neuroimage 66C:36-41.
Palaniyappan L, Al-Radaideh A, Mougin O, Gowland P, Liddle PF (2013). Combined white matter imaging suggests myelination defects in visual processing regions in
schizophrenia. Neuropsychopharmacology 38:1808-1815.
Palaniyappan L, Simmonite M, White TP, Liddle EB, Liddle PF (2013). Neural primacy of the salience processing system in schizophrenia. Neuron 79:814-828.
Peralta V, Campos MS, De Jalon EG, Cuesta MJ (2010). Motor behavior abnormalities in drug-naive patients with schizophrenia spectrum disorders. Mov Disord 25:1068-1076.
Pfurtscheller G, Lopes da Silva FH (1999). Event-related EEG/MEG synchronization and desynchronization: Basic principles. Clinical Neurophysiology 110:1842-1857. Pogosyan A, Gaynor LD, Eusebio A, Brown P (2009). Boosting cortical activity at Beta-band
frequencies slows movement in humans. Curr Biol 19:1637-1641.
Pollok B, Krause V, Martsch W, Wach C, Schnitzler A, Sudmeyer M (2012). Motor-cortical oscillations in early stages of Parkinson's disease. J Physiol 590:3203-3212.
Robinson SE, Vrba J (1998). Functional neuroimaging by synthetic aperture magnetometry. In T Yoshimoto, M Kotani, S Kuriki, H Karibe, N Nakasato (Eds.), Recent Advances in Biomagnetism (pp. 302-305). Sendai: Tohuku University Press.
Roopun AK, Middleton SJ, Cunningham MO, LeBeau FE, Bibbig A, Whittington MA, Traub RD (2006). A beta2-frequency (20-30 Hz) oscillation in nonsynaptic networks of somatosensory cortex. Proc Natl Acad Sci U S A 103:15646-15650.
Rowland LM, Shadmehr R, Kravitz D, Holcomb HH (2008). Sequential neural changes during motor learning in schizophrenia. Psychiatry Res 163:1-12.
Salenius S, Schnitzler A, Salmelin R, Jousmäki V, Hari R (1997). Modulation of human cortical rolandic rhythms during natural sensorimotor tasks. Neuroimage 5:221-228. Sarvas J (1987). Basic mathematical and electromagnetic concepts of the biomagnetic inverse
problem. Physics in Medicine and Biology 32:11-22.
Schnitzler A, Salenius S, Salmelin R, Jousmäki V, Hari R (1997). Involvement of primary motor cortex in motor imagery: A neuromagnetic study. NeuroImage 6:201-208. Shin YW, O'Donnell BF, Youn S, Kwon JS (2011). Gamma oscillation in schizophrenia.
Psychiatry Investig 8:288-296.
Siegel M, Donner TH (2010). Linking Band-Limited Cortical Activity to fMRI and Behavior. In M Ulsperger, S Debener (Eds.), Simultaneous EEG and fMRI - Recording,
Analysis, and Application (pp. 1-23). New York: Oxford University Press.
Slaghuis WL (1998). Contrast sensitivity for stationary and drifting spatial frequency gratings in positive- and negative-symptom schizophrenia. Journal of Abnormal Psychology 107:49-62.
32
Sun L, Castellanos N, Grutzner C, Koethe D, Rivolta D, Wibral M, Kranaster L, Singer W, Leweke MF, Uhlhaas PJ (2013). Evidence for dysregulated high-frequency
oscillations during sensory processing in medication-naive, first episode schizophrenia. Schizophr Res 150:519-525.
Sweet RA, Bergen SE, Sun Z, Sampson AR, Pierri JN, Lewis DA (2004). Pyramidal cell size reduction in schizophrenia: evidence for involvement of auditory feedforward circuits. Biol Psychiatry 55:1128-1137.
Uhlhaas PJ, Linden DE, Singer W, Haenschel C, Lindner M, Maurer K, Rodriguez E (2006). Dysfunctional long-range coordination of neural activity during Gestalt perception in schizophrenia. J Neurosci 26:8168-8175.
Vrba J, Robinson SE (2001). Signal processing in magnetoencephalography. Methods 25:249-271.
Vrtunski PB, Simpson DM, Meltzer HY (1989). Voluntary movement dysfunction in schizophrenics. Biological Psychiatry 25:529-539.
Vrtunski PB, Simpson DM, Weiss KM, Davis GC (1986). Abnormalities of fine motor control in schizophrenia. Psychiatry Research 18:275-284.
Walther S, Strik W (2012). Motor symptoms and schizophrenia. Neuropsychobiology 66:77-92.
Wechsler D (1944). The measurement of adult intelligence (3 ed.). Baltimore: Williams and Wilkins.
Whitty PF, Owoeye O, Waddington JL (2009). Neurological signs and involuntary
movements in schizophrenia: intrinsic to and informative on systems pathobiology. Schizophr Bull 35:415-424.
9. Figure
9. Figure
9. Figure
9. Figure
9. Figure