Elsevier Editorial System(tm) for Additive Manufacturing
Manuscript Draft
Manuscript Number: ADDMA-D-16-00022
Title: Understanding the Effect of Laser Scan Strategy on Residual Stress in Selective Laser Melting through Thermo-Mechanical Simulation
Article Type: Research paper
Keywords: Selective Laser Melting, SLM, Residual Stress, Simulation, Additive Manufacturing
Corresponding Author: Prof. Ian Anthony Ashcroft, Corresponding Author's Institution:
First Author: Luke Parry
Order of Authors: Luke Parry; Ian Anthony Ashcroft; Ricky Wildman Abstract: Selective laser melting (SLM) is an attractive technology, enabling the manufacture of customised, complex metallic designs, with minimal wastage. However, uptake by industry is currently impeded by several technical barriers, such as the control of residual stress, which have a detrimental effect on the manufacturability and integrity of a component. Indirectly, these impose severe design restrictions and reduce the reliability of components, driving up costs. This paper uses a
thermo-mechanical model to better understand the effect of laser scan strategy on the generation of residual stress in SLM. A complex
interaction between transient thermal history and the build-up of residual stress has been observed in the two laser scan strategies investigated. The temperature gradient mechanism was discovered for the creation of residual stress. The greatest stress component was found to develop parallel to the scan vectors, creating an anisotropic stress distribution in the part. The stress distribution varied between laser scan strategies and the cause has been determined by observing the
1 2 3 4 5 6 7 8 9 10 11 12 13 14 15 16 17 18 19 20 21 22 23 24 25 26 27 28 29 30 31 32 33 34 35 36 37 38 39 40 41 42 43 44 45 46 47 48 49 50 51 52 53 54 55 56 57 58 59 60 61
Understanding the Effect of Laser Scan Strategy on Residual
Stress in Selective Laser Melting through Thermo-Mechanical
Simulation
L. Parry, I. A. Ashcroft*, R. D. Wildman
Faculty of Engineering, University of Nottingham, Nottingham, NG7 2RD, UK
* Corresponding author email: [email protected]
Keywords: Selective Laser Melting, SLM, Residual Stress, Simulation, Additive Manufacturing
Abstract:
Selective laser melting (SLM) is an attractive technology, enabling the manufacture of customised, complex metallic designs, with minimal wastage. However, uptake by industry is currently impeded by several technical barriers, such as the control of residual stress, which have a detrimental effect on the manufacturability and integrity of a component. Indirectly, these impose severe design restrictions and reduce the reliability of components, driving up costs. This paper uses a thermo-mechanical model to better understand the effect of laser scan strategy on the generation of residual stress in SLM. A complex interaction between transient thermal history and the build-up of residual stress has been observed in the two laser scan strategies investigated. The temperature gradient mechanism was discovered for the creation of residual stress. The greatest stress component was found to develop parallel to the scan vectors, creating an anisotropic stress distribution in the part. The stress distribution varied between laser scan strategies and the cause has been determined by observing the thermal history during scanning. Using this, proposals are suggested for designing laser scan strategies used in SLM.
Nomenclature:
Specific heat capacity[kJ/kg K] Young’s modulus [GPa]
Spot point overlap factor
Enthalpy [J]
Heat transfer coefficient [W/m2 K] Plastic Tangent Modulus [GPa] Thermal conductivity [W/m K] Power of laser input [W] Surface heat flux [W/m2] Volumetric heat flux [W/m3] Temperature [°C]
Temperature (ambient) [°C] Temperature (liquidus) [°C] Temperature (solidus) [°C] Thermal diffusivity [m2/ s]
1 2 3 4 5 6 7 8 9 10 11 12 13 14 15 16 17 18 19 20 21 22 23 24 25 26 27 28 29 30 31 32 33 34 35 36 37 38 39 40 41 42 43 44 45 46 47 48 49 50 51 52 53 54 55 56 57 58 59 60
Linear thermal expansion coefficient of thermal expansion [1/K]
Strain
Emissivity
Poisson’s ratio Density [g/cm3] Stress [MPa]
Stefan-Boltzmann constant (5.67x10⁻⁸ W/m2K4)
1
Introduction
Selective Laser Melting (SLM) as an Additive Manufacturing technology has proliferated in interest through enabling designers to realise geometrically complex metallic structures [1], with a rapid design to manufacture cycle compared with conventional manufacturing methods [2]. Owing to its ability to incorporate advanced design techniques, such as topology optimisation [3,4] and lattice structures into components [5], and individual customisation, SLM has gained significant attention from many industrial sectors, in particular aerospace and automotive. Despite its great potential, technical barriers prevent manufacture ‘right first time’ and impose several manufacturing constraints that reduce design freedoms and design optimization unnecessarily.
1 2 3 4 5 6 7 8 9 10 11 12 13 14 15 16 17 18 19 20 21 22 23 24 25 26 27 28 29 30 31 32 33 34 35 36 37 38 39 40 41 42 43 44 45 46 47 48 49 50 51 52 53 54 55 56 57 58 59 60 61
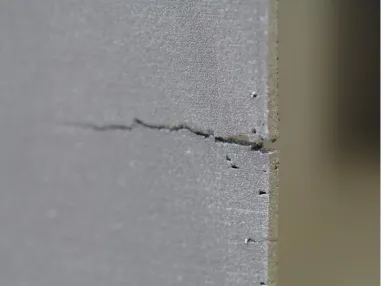
Figure 1 - Failure during manufacturing of a Ti-6Al-4V component caused by the build-up of residual stress.
Parts produced by SLM generally require additional support structures to constrain the part to restrict ‘curling’ or distortion during manufacture. After manufacture, the relief of residual stress requires further post processing either by heat treatment or hot isostatic pressing (HIP) [8].
A method to mitigate the need for support structures was proposed in [9] by utilising the eutectic point of a zinc alloy (Bi3Zn) to minimise the melt temperature required thereby reducing the direct energy input. This enabled them to build parts without support structures although they did not report the effects of distortion caused by residual stress. This method is, however, considerably limited in the choice of alloys usable.
The correct choice of laser scan strategy is critical in generating the desired microstructure [10,11] and is also known to affect the build-up of residual stress in components [12]. Previous studies have observed that the largest planar residual stress component is generated parallel to the scan vector and increases with scan vector length [12–14]. Another study investigated the effect of material properties on the creation of residual stress, however, failed to reveal any systematic correlations [15]. Despite this previous work indicating the importance of residual stress generation in SLM, the underlying mechanisms for the generation of residual stress remains little understood. In order to better determine the factors influencing the build-up of residual stress, thermo-mechanical models for simulating SLM are potentially valuable, although this is challenging due to the complexity of the physics involved in the SLM process and the multiple analytical scale lengths.
1 2 3 4 5 6 7 8 9 10 11 12 13 14 15 16 17 18 19 20 21 22 23 24 25 26 27 28 29 30 31 32 33 34 35 36 37 38 39 40 41 42 43 44 45 46 47 48 49 50 51 52 53 54 55 56 57 58 59 60
developing modelling techniques. Observations from such simulations have included the reporting of an asymmetric melt-pool and that the largest stress component was generated parallel to the scanning direction, agreeing with previous experimental studies [14]. Another approach that has been proposed is applying an instantaneous, uniform heat flux to the entire cross-sectional surface, rather than simulating the motion of the laser path [20,21]. However, this method is limited by its inability to resolve the effect of laser scan strategy on residual stress. To overcome this limitation, a layer based model using a characteristic strain determined using a macro scale model has been proposed [22].
Computational Fluid Dynamics (CFD) coupled with a FE analysis has been used to account for thermo-fluid effects inside the melt pool but due to their inherent computational cost are limited to mesoscale simulations for small time scales [23–26]. Hodge et al. [18] advanced this area by
incorporating a multi-phase stress term using volumetric fractions, and a phase expansion term to account for volumetric shrinkage during phase change between powder and consolidated form.
Current models have not identified the geometrical relationship between the choices of laser scan strategy with the generation of residual stress. Also, there is a lack of knowledge relating the temperature field created with the residual stress generated by the choice of laser scan strategy. Currently this information is not available in a way that would enable the prediction of distortion and failure, and consequently, the reliable manufacture of components in SLM.
In this paper, a coupled thermo-mechanical finite element model is established to determine the mechanisms that cause the generation residual stress during SLM. The model is then used to determine the implications of the temperature history, created by the choice of laser scan strategy and scan area size, on the development of residual stress during selective laser melting. This work sets the basis for the development of optimal scan strategies to mitigate residual stress effects in SLM built components.
2
Model Definition
2.1
Simulation Overview
This work uses a coupled thermo-mechanical finite element (FE) analysis for the simulation of the SLM of Ti-6Al-4V with laser parameters chosen specifically for manufacture on a Realizer SLM-50 [27]. A commercial FE solution was deemed sufficient to provide a robust solution whilst reducing development time required. MSC Marc [28]was chosen because of its competency in modelling non-linear multi-physics manufacturing processes and the ability to extend models and functionality with user defined Fortran subroutines
1 2 3 4 5 6 7 8 9 10 11 12 13 14 15 16 17 18 19 20 21 22 23 24 25 26 27 28 29 30 31 32 33 34 35 36 37 38 39 40 41 42 43 44 45 46 47 48 49 50 51 52 53 54 55 56 57 58 59 60 61
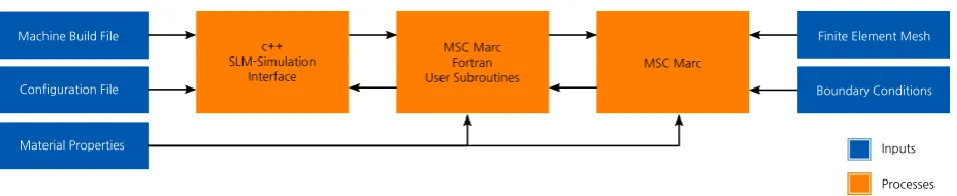
Figure 2 - An overview of inputs required by the simulation and the interdependency of processes
The simulation process interacts between Fortran user subroutines and an external c++ interface to control the simulation behaviour whilst running (Figure 3). The c++ interface has several
responsibilities. Firstly, it parses the machine build file and controls the laser position, laser power and state at a given simulation time. Secondly, it manages the adaptive time-stepping procedure ensuring that a consistent time step is used for varying laser scan speeds (Section 2.3). Finally, it provides an interface for managing the state variable of each element. This functionality is
integrated separately with a general purpose, multi-physics FE solver to enable future additions of more complex modelling.
Figure 3 - The interaction between c++ interface, Fortran user subroutines and MSC Marc.
2.2
Thermal Definition
The thermal problem is governed by the enthalpy within a system, defined as
∫
(1)
with the heat transfer defined by the heat equation in a volume, Ω, as given in equation (2).
[image:6.595.91.498.364.546.2]
1 2 3 4 5 6 7 8 9 10 11 12 13 14 15 16 17 18 19 20 21 22 23 24 25 26 27 28 29 30 31 32 33 34 35 36 37 38 39 40 41 42 43 44 45 46 47 48 49 50 51 52 53 54 55 56 57 58 59 60
The volumetric heat input term, , is the heat input from the laser source defined in equation (6). The surface heat source term, , is the sum of the convective and radiation terms defined in equation (3), which was applied to the exposed powder bed surface , Γ, having a surface normal
such that
( )
( ) ( ) . (3)
The values of emissivity used in equation (3) in this work were compiled using two sources, as
shown in Table 1 and a heat convection coefficient, W/m2K [29] was used.
Temperature [°C] Emissivity
25 0.121
100 0.155
200 0.178
300 0.205
400 0.228
500 0.331
600 0.561
700 0.591
900 0.600
1500 0.600
1650 0.405
1900 0.402
2100 0.400
2300 0.398
[image:7.595.197.395.230.516.2]2600 0.395
Table 1 - Temperature dependent emissivity values used for both powder and solid compiled from two sources [30,31].
Three material phases were considered in the simulation: powder, solid and liquid. Both the liquid and solid state represent the ‘consolidated’ form. A unidirectional transformation occurs during consolidation from powder to liquid and there is a bidirectional transformation between solid and liquid during (re)melt. Each state requires a set of temperature dependent material properties, with the powder state having an assumed packing factor of 0.6 [19].
In order to assign appropriate material properties, a state variable was used to track the state of each element, using a discrete variable with the three exclusive conditions
{
(4)
1 2 3 4 5 6 7 8 9 10 11 12 13 14 15 16 17 18 19 20 21 22 23 24 25 26 27 28 29 30 31 32 33 34 35 36 37 38 39 40 41 42 43 44 45 46 47 48 49 50 51 52 53 54 55 56 57 58 59 60 61
Independent measurements of thermal diffusivity were gathered for Ti-6Al-4V powder and solid AM samples. Both samples were tested using a Netzsch LFA 427 laser flash analysis machine under a vacuum atmosphere purged with an argon backflow from room temperature up to 1400 °C. A cylindrical specimen with a diameter of 12.7 mm and 2 mm depth was prepared using the Realizer SLM 50 to measure the diffusivity of the solid specimen. The powder sample was placed inside an 85 μL sapphire crucible and spray coated with graphite on the top and bottom surfaces to increase absorptivity and emissivity of the sample. Thermal conductivity values were calculated from the measured thermal diffusivity in conjunction with density and specific heat capacity according to
. (5)
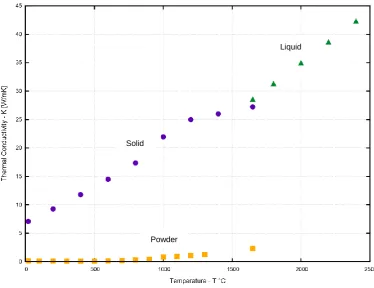
Thermal conductivity values for the liquid state were taken from experiments performed by
Bovineau et al. [31]. The thermal conductivity values for all states are presented in Figure 4 and the supporting properties required for its calculation are listed in Table 2 and Table 3.
Temperature [°C]
Specific heat capacity
[J/kgK]
Density
[g/cm3]
Thermal Diffusivity
[m2/s]
Thermal conductivity
[W/m K]
20 520 2.65 0.11 0.145
100 516 2.65 0.09 0.125
200 505 2.64 0.08 0.104
300 492 2.63 0.07 0.092
400 480 2.62 0.07 0.083
500 473 2.61 0.06 0.078
600 472 2.60 0.14 0.167
700 483 2.59 0.17 0.216
800 507 2.58 0.21 0.279
900 548 2.57 0.31 0.430
1000 610 2.56 0.52 0.813
1100 696 2.55 0.53 0.934
1200 808 2.54 0.53 1.09
[image:8.595.117.482.605.773.2]1300 951 2.53 0.53 1.27
Table 2 -Temperature dependent material properties used for the powder form of Ti-6Al-4V. Specific heat capacity and density taken from [32].
Temperature [°C]
Specific heat capacity
[J/kgK]
Density
[g/cm3]
Thermal Diffusivity
[m2/s]
Thermal conductivity
[W/m K]
20 543 4.42 2.95 7.07
200 566 4.39 3.74 9.28
400 599 4.36 4.51 11.8
600 636 4.33 5.25 14.5
800 675 4.30 5.98 17.4
1000 713 4.27 7.22 22.0
1 2 3 4 5 6 7 8 9 10 11 12 13 14 15 16 17 18 19 20 21 22 23 24 25 26 27 28 29 30 31 32 33 34 35 36 37 38 39 40 41 42 43 44 45 46 47 48 49 50 51 52 53 54 55 56 57 58 59 60
1400 770 4.21 8.02 26.0
[image:9.595.108.483.149.437.2]Table 3 - Temperature dependent material properties used for solid Ti-6Al-4V. Specific heat capacity and density taken from [32].
Figure 4 - Compiled thermal conductivity values for the powder, solid and liquid states of Ti-6Al-4V.
2.3
Laser Heat Input
The laser heat input was modelled using the volumetric Gaussian heat source proposed by Goldak [33] with the definition
√ √
(6)
with a variable laser power P, laser spot radii , , and , and a lumped efficiency term to account for the relative absorption of laser energy into the material. Caution is expressed when choosing because these values vary widely between experimental studies for both powder and solid medium [19]. For powder, this is assumed to be the same as pure titanium powder [34] and for the solid substrate is assumed to be [35]. Normally, to account for latent heat, the specific heat is modified in a finite interval between the solidus and liquidus temperatures. This was excluded in this work because accounting for latent heat requires a small enough time-step to ensure the temperature change does not overshoot this interval and is relatively insignificant compared with loss of heat through radiation.
Liquid
Solid
1 2 3 4 5 6 7 8 9 10 11 12 13 14 15 16 17 18 19 20 21 22 23 24 25 26 27 28 29 30 31 32 33 34 35 36 37 38 39 40 41 42 43 44 45 46 47 48 49 50 51 52 53 54 55 56 57 58 59 60 61
The transmission efficiency of the laser source in SLM has not been accurately measured, both in general and specifically for the Realizer SLM 50. It is expected that many factors during the build will affect this, such as the release of a metal condensate into the path of the laser [36] or the lens focal position. Hence, the inclusion of empirical laser absorption efficiency term in this work.
A constant point overlap factor was used to control the relative position of the laser point
between each simulation time step, as shown in equation (7). This ensures that irrespective of the laser speed, , and the fixed laser spot size, , the heat flux traverses across the whole scan path without any intermittent gaps.
(7)
2.4
Mechanical Definition
The structural analysis assumes a small strain and small deformation formulation using an elasto-plastic constitutive model with the standard relation
* + , -* + (8)
with Cauchy stress , and the element stiffness matrix. The total strain tensor, , is the superposition of three strains terms
(9)
which are the elastic strain, , plastic strain, , and the thermal strain, . The latter defined as
( ) ∫ ( )
(10)
The linear coefficient of thermal expansion, , is listed in Table 4 for Ti-6Al-4V. The Poisson’s ratio
is assumed to be and in the elastic and plastic regimes, respectively [37,38].
For modelling time-independent plasticity, a kinematic plasticity model with a von Mises yield criterion was chosen as this captures the cyclic non-linear work hardening (Baushinger) effect [39]. Temperature dependent properties for the yield stress and the plastic tangent modulus are listed in Table 4.
Temperature [°C]
Linear CTE x10-6 [1/K]
Young’s modulus
E [GPa]
Yield stress [MPa]
Plastic tangent modulus
[GPa]
24 8.78 125 1000 0.7
94 9.83 110 630 2.2
205 10.0 100 630 2.2
317 10.7 100 525 2.2
428 11.1 80 500 1.9
539 11.2 74 446 1.9
1 2 3 4 5 6 7 8 9 10 11 12 13 14 15 16 17 18 19 20 21 22 23 24 25 26 27 28 29 30 31 32 33 34 35 36 37 38 39 40 41 42 43 44 45 46 47 48 49 50 51 52 53 54 55 56 57 58 59 60
761 12.2 27 45 2
872 12.3 20 25 2
1094 12.4 5 5 2
[image:11.595.100.489.72.142.2]1650* 12.5 0.1 0.1 0.1
Table 4 - Temperature dependent mechanical properties for bulk Ti-6Al-4V [40]. * linearly extrapolated values
The structural pass is performed once the element state has been set and the element connectivity has been calculated to prevent the activation of rigid bodies. Activation of elements during the mechanical pass are only considered for solid elements ( ) and have connectivity with the base plate. If remelting of a previously consolidated elements does occur, the previously accumulated strains for the element are reset to zero and are removed subsequently from the structural analysis pass.
3
Methodology
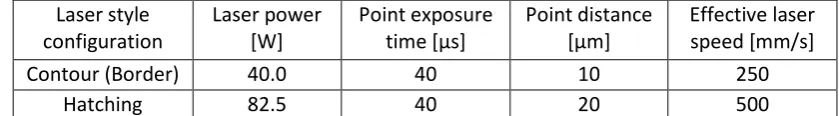
In order to investigate the importance of the chosen laser scan strategy on the residual stresses in the built component, two scan strategies were chosen: unidirectional and alternating (meander). Both laser paths were generated with a custom Matlab script using compatible laser machine parameters, listed in Table 5, and scan parameters in Table 6.
Laser style configuration
Laser power [W]
Point exposure time [μs]
Point distance [μm]
Effective laser speed [mm/s]
Contour (Border) 40.0 40 10 250
[image:11.595.85.505.383.441.2]Hatching 82.5 40 20 500
Table 5 - Laser style parameters used by a Realizer SLM 50 for Ti-6Al-4V used to generate the machine build files.
Hatch distance [mm] 0.09 Border offset [mm] 0.07 Spot compensation [mm] 0.14 Layer Thickness [mm] 0.04
Table 6 - Parameters used by a Realizer SLM 50 for Ti-6Al-4V to generate the laser geometry in the machine build files.
[image:11.595.95.486.603.732.2]The hatched region is scanned first followed by the scan of a single outer contour for each case, as illustrated in Figure 5. A direct comparison of the two scanning strategies can be made since the total scanning times are equivalent.
1 2 3 4 5 6 7 8 9 10 11 12 13 14 15 16 17 18 19 20 21 22 23 24 25 26 27 28 29 30 31 32 33 34 35 36 37 38 39 40 41 42 43 44 45 46 47 48 49 50 51 52 53 54 55 56 57 58 59 60 61
The single layer simulations were scanned directly over a solid substrate to enable a comparison with previous work. For each simulation, the domain consisted of a powder bed composed of uniform 0.02 mm 8 noded hexahedral elements and a substrate region with an overall thickness of 1.56 mm. The spot overlap factor was set to 0.8. The entire domain had an initial temperature
set to 200 °C with a cooling time of 5 seconds. Six simulation cases were chosen: two scan strategies with three different cross-sectional widths each (1-3 mm).
To validate the thermal simulation, a study was conducted to compare the melted track widths observed experimentally with those found in the simulation results. A 3 mm x 3 mm square region was processed on a Realizer SLM 50 for a single layer using the same parameters as the simulation. An evenly distributed layer was created by manually spreading the powder on the surface of the base plate. Optical measurements were then taken for the melted track widths to be compared with the results obtained from the simulation.
4
Results
A validation of the thermal analysis with experiment is presented first, in Section 4.1. The effect of scan area size and scan strategy on thermal history is then discussed in Section 4.2, the mechanical response is evaluated in Section 4.3 and, finally, a comparison between the two laser scan strategies is made in Section 4.4.
4.1
Validation of Thermal Analysis with Experiment
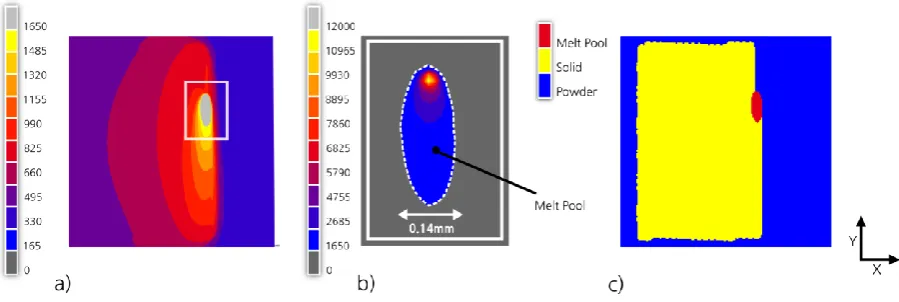
[image:12.595.73.523.531.682.2]The surface temperature for a single scan vector in Figure 6(a) shows an approximate melt-pool width of 0.14 mm. The peak temperature is an isolated singularity inside the melt pool region above the vaporisation temperature of Ti-6Al-4V. A micrograph was taken for the single layer experiment described in Section 3, as shown in Figure 7. It can be seen from comparing Figures 7(a) and 7(b) that the track width in simulation and experiment varies by approximately 14%, taking into account of adjacent track re-melting due to overlap. This provides confidence in the modelling approach and material parameters used in the simulations.
1 2 3 4 5 6 7 8 9 10 11 12 13 14 15 16 17 18 19 20 21 22 23 24 25 26 27 28 29 30 31 32 33 34 35 36 37 38 39 40 41 42 43 44 45 46 47 48 49 50 51 52 53 54 55 56 57 58 59 60
Figure 7 – a) Single layer laser scan on a base plate using Ti-6Al-4V of adjacent tracks and b) diagram illustrating the calculated overlap of adjacent scan tracks for the simulation.
4.2
Thermal Analysis of Single Layer Sections
Due to the inclusion of multiple material phases, non-symmetric thermal behaviour is seen, as illustrated in Figure 6(a). A resulting asymmetric melt pool is formed during the laser scan in the hatched area due to the position of powder and solid regions on each side of the scan vector, as shown in Figure 6(c). The melt pool becomes asymmetric through preferential heat conduction into the previously scanned consolidated region which has a higher conductivity than the neighbouring powder region.
1 2 3 4 5 6 7 8 9 10 11 12 13 14 15 16 17 18 19 20 21 22 23 24 25 26 27 28 29 30 31 32 33 34 35 36 37 38 39 40 41 42 43 44 45 46 47 48 49 50 51 52 53 54 55 56 57 58 59 60 61
[image:14.595.63.511.307.500.2]Figure 8 – Average solidified element temperature over time for different scan area sizes cases (CS – Start of the Contour Scan and ES – End of Scanning) for a) alternating and b) unidirectional scan strategy.
Figure 9 - Temperature profile for a single node taken at top left corner of the hatch region for the unidirectional and alternating scan strategies.
[image:14.595.144.450.544.715.2]1 2 3 4 5 6 7 8 9 10 11 12 13 14 15 16 17 18 19 20 21 22 23 24 25 26 27 28 29 30 31 32 33 34 35 36 37 38 39 40 41 42 43 44 45 46 47 48 49 50 51 52 53 54 55 56 57 58 59 60
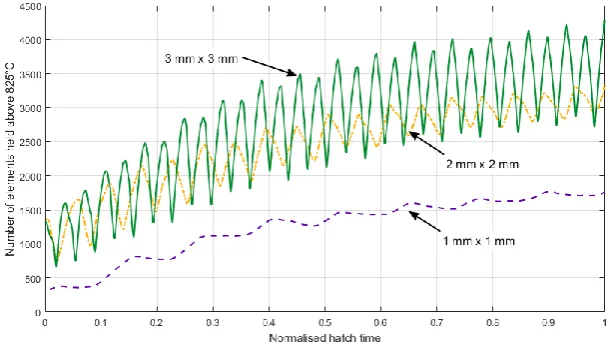
In Figure 10, the total area held above 825°C, the point at which Ti-6Al-4V begins to acquire superplastic behaviour [41], increases with time. This indicates the accumulation of heat into the part since the power is kept constant throughout scanning the hatched region.
[image:15.595.53.549.267.525.2]The probability density distribution ( ) in Figure 11 shows the current temperature state throughout the scanning history of the hatched regions. A skewed distribution is present, with the presence of oscillations (ridges) throughout the scanning history in all cases. When scanning the smallest region, as shown in Figure 11(a,d), a large proportion of elements are held above 825°C. Towards the end of scanning, the distributions in the larger regions become narrower, with the peak centred at approximately 500°C. During the early phase of scanning using the alternate strategy, as shown in Figure 11(a,b,c), the troughs in the temperature are lower compared to the unidirectional strategy.
Figure 11 - Transient probability density distribution P(T,t) for consolidated elements normalised to the scanning time of the hatched region. Distributions are shown for the alternating strategy with sizes a) 1 mm x 1 mm, b) 2 mm x 2 mm and c) 3 mm x 3 mm, and unidirectional strategy with sizes d) 1 mm x 1 mm, e) 2 mm x 2 mm and f) 3 mm x 3 mm.
[image:15.595.79.523.582.731.2]1 2 3 4 5 6 7 8 9 10 11 12 13 14 15 16 17 18 19 20 21 22 23 24 25 26 27 28 29 30 31 32 33 34 35 36 37 38 39 40 41 42 43 44 45 46 47 48 49 50 51 52 53 54 55 56 57 58 59 60 61
end of contour scan.
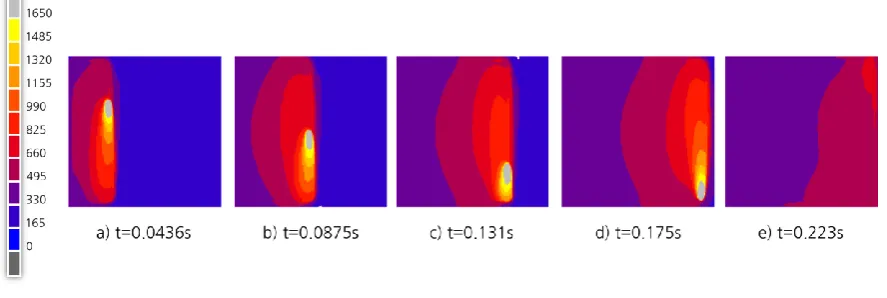
The temperature history for the 3 mm x 3 mm test case with the alternating scan strategy, as illustrated in Figure 12, shows a localised heat tail in the direction of the scan vector, situated near recently scanned tracks. Over time, heat becomes uniformly dissipated into previously consolidated regions.
4.3
Stress Analysis of Single Layer Regions
The state of a single scan vector track at an instance is shown in Figure 13. It can be seen that longitudinal stress, σyy,,as shown in Figure 13(d), is generated as consolidated material behind the
melt pool cools and contracts. The transverse stress, σxx,, shown in Figure 13(d) is lower due to the
[image:16.595.61.536.271.479.2]lack of solid material inhibiting thermal expansion and a lower temperature gradient perpendicular than parallel to the scan vector, respectively shown in Figure 13(b) and Figure 13(c)
1 2 3 4 5 6 7 8 9 10 11 12 13 14 15 16 17 18 19 20 21 22 23 24 25 26 27 28 29 30 31 32 33 34 35 36 37 38 39 40 41 42 43 44 45 46 47 48 49 50 51 52 53 54 55 56 57 58 59 60
Figure 14 - Profile views of a) temperature b) temperature gradient, c) σxx [MPa] and d) total equivalent plastic strain
whilst scanning the 3 mm x 3 mm unidirectional test case at t = 0.092s. Dashed line indicates position of the melt pool region.
Upon the accumulation of several tracks, there is a progressive build-up of transverse stress, as shown in Figure 14(c), due to material inhibiting thermal expansion in the previously scanned track. The thermal expansion in the region surrounding the melt pool creates a compressive stress in the neighbouring region. Due to the high temperature in the HAZ, yielding occurs, which creates regions of plastic strain between each adjacent scan track in the hatch region, as shown in Figure 14(d).
A non-uniform, anisotropic stress distribution in the component is generated, as shown in Figure 15 and Figure 16. The stress distributions in the XY plane are mostly dominated by the σyy component
which decreased in magnitude from the start to the end of the hatched region, as shown in Figure 16(a). The largest σyy stresses were situated centrally along the hatch region and decrease towards
1 2 3 4 5 6 7 8 9 10 11 12 13 14 15 16 17 18 19 20 21 22 23 24 25 26 27 28 29 30 31 32 33 34 35 36 37 38 39 40 41 42 43 44 45 46 47 48 49 50 51 52 53 54 55 56 57 58 59 60 61
Figure 15 - Profiles views of von Mises stress distribution for 3 mm x 3 mm test case when using a) unidrectional, and b) alternating scan strategies.
Figure 16 - Profile view of surface normal stresses a) σyy and b) σxx when using unidirectional (left) and alternating
[image:18.595.53.516.307.716.2]1 2 3 4 5 6 7 8 9 10 11 12 13 14 15 16 17 18 19 20 21 22 23 24 25 26 27 28 29 30 31 32 33 34 35 36 37 38 39 40 41 42 43 44 45 46 47 48 49 50 51 52 53 54 55 56 57 58 59 60
[image:19.595.30.559.193.401.2]To identify the cause for the longitudinal stress varying in the X direction for both scan strategies, a series of comparisons were made near the beginning and the end of scanning the hatch region, as shown in Figure 17. Towards the end of scanning the hatched zone, the surrounding region was held at a higher temperature, as shown in Figure 17(a) and exhibited a smaller temperature gradient behind the melt pool region, illustrated in Figure 17(b). During the initial development of the longitudinal stress behind the melt pool, as shown in Figure 17(c), the magnitude of these stresses were found to be lower towards the end of scanning for the hatched region.
Figure 17 – Mirrored profile views of a) the temperature, b) the temperature gradient in the Y direction, and c) σyy taken
at t = 0.0320s (left half) and at t = 0.156s (right half).
4.4
Comparison between Laser Scan Strategies
To enable comparison of the different scan areas sizes and scan strategies on the mechanical
response, the mean values were calculated for the normal strain and stress components and the von Mises stress, which are listed in Table 7. The average values of these measurements were sampled from all consolidated elements on the final time step of the simulation.
Scan Area Scan Strategy Total Strain Component x10-3
Stress Components [MPa] Von Mises Stress [MPa]
εxx εyy εzz σxx σyy σzz
1 mm x 1 mm Alternate -13.5 -9.0 -22.9 151.8 189.3 0.0 236.0 Unidirectional -13.8 -9.1 -22.5 145.1 183.6 0.0 221.0
2 mm x 2 mm Alternate -13.5 -6.2 -23.7 161.8 270.1 0.0 289.0 Unidirectional -13.5 -6.1 -23.4 166.8 273.5 0.0 289.3
3 mm x 3 mm Alternate -13.9 -4.5 -23.6 140.2 302.0 0.0 307.0 Unidirectional -13.8 -4.4 -23.5 143.9 305.2 0.0 307.0
Table 7 - Average values for von Mises stress and normal strain and stress components calculated from solid elements located in the first layer for multiple simulation cases
The greatest strain component was εzz followed by εxx and εyy. The von Mises stress increases with
the scan area size. Throughout each test case, the largest magnitude of stress exists in the σyy
component, followed by σxx with a small value for the σzz component. Measuring the average for
[image:19.595.67.561.534.657.2]1 2 3 4 5 6 7 8 9 10 11 12 13 14 15 16 17 18 19 20 21 22 23 24 25 26 27 28 29 30 31 32 33 34 35 36 37 38 39 40 41 42 43 44 45 46 47 48 49 50 51 52 53 54 55 56 57 58 59 60 61
A comparison of the temperature at the start and the end of scan vectors between scan strategies is shown in Figure 18, to better understand the difference in the distribution of stress components during the process. When the alternating scan strategy was used, the next scan vector began in a higher temperature region compared to the unidirectional scan due to the prior scan vector finishing nearby. The elevated temperature in the alternate scan reduces the magnitude of the temperature gradient for the alternating scan, as shown in Figure 19(b), which is less at the start of the scan vector compared to the unidirectional scan shown in Figure 20(b). After the duration of 2 ms, the distributions of the temperature gradients become independent of their position along the scan vector for both scan strategies. The transverse stress at the start of the scan vectors differed
[image:20.595.156.447.266.483.2]between strategies. At the beginning of the scan vector, a larger region is subjected to a compressive transverse stress when using the alternating strategy, as shown in Figure 19(a), compared to the unidirectional strategy shown in Figure 20(a).
Figure 18 - Profile view of temperature distribution at the approach and exit of the laser scan vector when using a) alternating scan strategy and b) unidirectional scan strategy.
Figure 19 - Profile views of a) σxx stress and b) temperature gradient for solid elements at the beginning of the scan
[image:20.595.31.564.544.734.2]1 2 3 4 5 6 7 8 9 10 11 12 13 14 15 16 17 18 19 20 21 22 23 24 25 26 27 28 29 30 31 32 33 34 35 36 37 38 39 40 41 42 43 44 45 46 47 48 49 50 51 52 53 54 55 56 57 58 59 60
Figure 20 – Profile views of a) σxx stress and b) temperature gradient for solid elements at the beginning of the scan
vector using the unidirectional strategy
The previously described temperature effect also caused a difference in the distribution of plastic strain between scan strategies. When using the unidirectional scan strategy, a uniform distribution of plastic strain is present throughout the hatch region, as shown in Figure 21(b), whereas the alternating scan strategy features decreased levels of plastic strain towards the end of the scan vectors, as shown in Figure 21(a).
Figure 21 - Profile view of total equivalent plastic strain fields for a) alternating strategy and b) unidirectional strategy
5
Discussion
[image:21.595.61.524.441.640.2]1 2 3 4 5 6 7 8 9 10 11 12 13 14 15 16 17 18 19 20 21 22 23 24 25 26 27 28 29 30 31 32 33 34 35 36 37 38 39 40 41 42 43 44 45 46 47 48 49 50 51 52 53 54 55 56 57 58 59 60 61
Nevertheless, the peak temperature is in good agreement with another work that used a similar smaller spot size of 50 µm [37]. Currently, this work excludes the effect of vaporization although it is acknowledged that accounting for this effect will influence the melt pool depth and geometry, and limit the maximum surface temperature. This is not expected to cause a significant change in the thermal and stress values reported by the simulation because the effect will be isolated to the temperature singularity inside the melt pool, as shown in Figure 6.
The temperature history shown in Section 4.2 reveals the importance of the sizing effect in the physical problem. It was found the temperature distribution achieved and length of time sustained is dependent on the size of scan area, as shown in Figure 8 and Figure 11. The smallest scan area sustains a high temperature for a short period but due to its size cools rapidly after scanning has completed, whereas the largest region holds a lower temperature for longer with a lower cooling rate. This is caused by the accumulation of thermal energy into the consolidated regions and substrate over the duration of the scan.
A large proportion of material in the 1 mm x 1 mm test cases, as shown in Figure 11, is held above the superplastic temperature. In Table 7, this test case has the greatest longitudinal strain ( ), and
has the smallest transverse stress which indicates that plastic deformation has occured. In super plastic forming of Ti-6Al-4V, parts can be manufactured without suffering from residual stress or spring back, at low shear rates [41] and likewise shows that the formation of residuals stresses can be controlled by temperature. Depending on the substrate (powder or solid), varying the scan area size will enable control over the sustained temperature achieved in a scanned region. Potentially, this will enable control over the build-up residual stress and generation of the microstructure by elevating the temperature and reducing the rate of cooling [42].
Oscillations in the temperature exist, as shown between Figure 8 and Figure 11, and have different frequencies for the laser scan strategies due to the interval of time between adjacent scanning. The period of the oscillations is, therefore, affected directly by the scan vector length. The unidirectional strategy has a more stable minimum temperature, due to smaller time period between adjacent scans, as shown in Figure 9 and Figure 11, but this also affected by the lack of thermal mass available early in the scanning history. Also, it is evident in Figure 9 that the heating effect from the laser in previously consolidated areas diminishes between three to four adjacent scan tracks, and this is also visible in Figure 12. Potentially, a performance improvement for simulating SLM could be gained by modelling regions far from the melt-pool using a steady-state analysis, but retaining the transient behaviour in region near the melt-pool.
The analysis of stress in Section 4.3 showed the main contributor of stress is created parallel to the scan vector. Observing the behaviour in a single scan track, the longitudinal stress was considerably higher than the transverse stress, due the higher temperature gradient component parallel to the scan vector, as shown in Figure 13(c). Table 7 shows that increasing the scan area size effectively increases the overall stress in the region. This is caused by the dominating longitudinal stress which increases with scan vector length as reported by literature [43]. Therefore when designing laser scan strategies, it is important to minimise the scan vector lengths for all orientations.
1 2 3 4 5 6 7 8 9 10 11 12 13 14 15 16 17 18 19 20 21 22 23 24 25 26 27 28 29 30 31 32 33 34 35 36 37 38 39 40 41 42 43 44 45 46 47 48 49 50 51 52 53 54 55 56 57 58 59 60
al. [44] and numerically by Roberts [19]. Overall, the laser scan strategy chosen for a component should factor in the anisotropic build-up of stress created during this process. A further study is required to determine the viability of orientating the scan vectors in an optimal way to equalise the overall stress field whilst considering other processing constraints such as porosity.
Longitudinal stress tended to decrease in the X direction and was caused by a combination of a higher elevated temperature, and a lower temperature gradient, as shown in Figure 17. This corresponds with the temperature history, as shown in Figure 10 with the region of higher temperature (>825°C) increasing in area towards a plateau throughout the scanning history.
After successive scanning of tracks, as shown in Figure 14, the mechanism for the generation of transverse stress was found to be caused by the temperature gradient mechanism shown in Figure 14(b). The thermal expansion of solid material surrounding the melt pool area creates a region of compressive transverse stress (Figure 14(c)). Additionally, regions of plastic strain were created by re-melting between adjacent scan tracks occurring at high temperature ( Figure 14(d)). The distributions of the total strain components correspond to the large values in the X and Z direction for the total strains, as shown in Table 7, which includes contributions from the plastic strains. This indicates that in a full sized part distortion will occur normal to the XY plane, where the total strain component in the Z direction is greatest, which results in the ‘curling’ effect typically observed in failed builds. These findings raise concerns about mechanical testing on as-built specimens produced in SLM because they will contain geometrically dependent residual stress and plastic deformation, which will affect the bulk material strength and ductility in the final component.
The average stresses calculated in Table 7 indicate that scanning small regions with the same laser parameters for these two scan strategies do not strongly affect the magnitude of residual stress. This was suspected to be caused by the small scale of the analysis. Nevertheless, a difference was shown between the two scan strategies for the distribution of planar normal stresses, and the plastic strain towards the end of the scan vectors, as shown in Figure 16 and Figure 21. The ‘rippled’ stress distribution present in the alternating strategy is attributed to the reverse of the scan vector
direction. Both effects are caused by the high temperature and smaller temperature gradients found in this region, as shown in Figure 18 , Figure 19, when using the alternating scan strategy. Inevitably, increasing the substrate temperature prior to scanning will reduce the magnitude of residual stress and plastic deformation in a part, as reported by other researchers [9,12]. This, however, is currently not practical to perform with current commercial SLM technologies.
6
Conclusions
A coupled thermo-mechanical simulation has been established capable of predicting residual stress for two different scan strategies for single layer cross-sections of 1-3 mm. This work demonstrates that even at a macro scale, complex transient behaviour is inherent during the process of selective laser melting. It has identified the interaction between temperature history and the mechanical response and the effect of laser scan strategy on the stress distribution. Specific conclusions were drawn from the research:
1 2 3 4 5 6 7 8 9 10 11 12 13 14 15 16 17 18 19 20 21 22 23 24 25 26 27 28 29 30 31 32 33 34 35 36 37 38 39 40 41 42 43 44 45 46 47 48 49 50 51 52 53 54 55 56 57 58 59 60 61
The larger scanned regions had a lower average temperature but were sustained for a longer duration due to the accumulation of heat.
Longitudinal stress (parallel to the scan vector) increases with scan vector length and is the main contribution to stress due to presence of the larger thermal gradient parallel to the scan vector.
The process generates a non-uniform anisotropic stress field, which have regions of lower transverse and longitudinal stresses situated towards the end of the scan vectors.
No substantial difference in the magnitude of stress was observed between the two scan strategies. However, the distribution of stress and plastic strain did vary between laser scan strategies and was shown to be caused by the thermal history.
Reduced levels of stress and plastic strain are exhibited at the end of scan vectors when using the alternate scan strategy due to the reduced temperature gradients at the end of each vector.
Based on these findings, the design of laser scan strategies should avoid long scan vector lengths and orientate the direction of scan vectors uniformly to produce an isotropic stress field in the
component. The size of the hatch regions should be varied appropriately, to sustain the highest elevated temperature without causing instability in the process. By combing this knowledge,
optimising the laser scan strategy could further mitigate the effects of the residual stress and reduce support structure requirements without requiring changes to the SLM machine or design of the part manufactured.
7
References
[1] Baumers M, Tuck C, Wildman R, Ashcroft I, Hague R. Shape Complexity and Process Energy Consumption in Electron Beam Melting. Journal of Industrial Ecology 2016;20:11.
[2] Hopkinson N, Hague R, Dickens P. Rapid manufacturing: an industrial revolution for the digital age. John Wiley & Sons; 2006.
[3] Brackett D, Ashcroft I, Hague R. Topology optimization for additive manufacturing. Solid Freeform Fabrication Symposium, 2011, p. 348–62.
[4] Aremu A, Ashcroft I, Wildman R, Hague R, Tuck C, Brackett D. The Effects of Bidirectional Evolutionary Structural Optimization Parameters on an Industrial Designed Component for Additive Manufacture. Proceedings of the Institution of Mechanical Engineers, Part B: Journal of Engineering Manufacture 2013;227:794–807. doi:10.1177/0954405412463857.
[5] Maskery I, Aremu AO, Simonelli M, Tuck C, Wildman RD, Ashcroft IA, et al. Mechanical Properties of Ti-6Al-4V Selectively Laser Melted Parts with Body-Centred-Cubic Lattices of Varying cell size. Experimental Mechanics 2015:1–12. doi:10.1007/s11340-015-0021-5.
[6] ASTM. ASTM F2924-14, Standard Specification for Additive Manufacturing Titanium-6 Aluminum-4 Vanadium with Powder Bed Fusion. ASTM Standards 2014;10.04.
doi:10.1520/F2924.
[7] Edwards P, Ramulu M. Fatigue Performance Evaluation of Selective Laser Melted Ti-6Al-4V. Materials Science and Engineering: A 2014;598:327–37. doi:10.1016/j.msea.2014.01.041.
1 2 3 4 5 6 7 8 9 10 11 12 13 14 15 16 17 18 19 20 21 22 23 24 25 26 27 28 29 30 31 32 33 34 35 36 37 38 39 40 41 42 43 44 45 46 47 48 49 50 51 52 53 54 55 56 57 58 59 60
doi:http://dx.doi.org/10.1016/j.cirp.2007.10.004.
[9] Mumtaz K, Vora P, Hopkinson N. A METHOD TO ELIMINATE ANCHORS/SUPPORTS FROM DIRECTLY LASER MELTED METAL POWDER BED PROCESSES. SFF, 2011, p. 55–64.
[10] Simonelli M, Tse YY, Tuck C. On the texture formation of selective laser melted Ti-6Al-4V. Metallurgical and Materials Transactions A: Physical Metallurgy and Materials Science 2014;45:2863–72. doi:10.1007/s11661-014-2218-0.
[11] Aboulkhair NT, Everitt NM, Ashcroft I, Tuck C. Reducing porosity in AlSi10Mg parts processed by selective laser melting. Additive Manufacturing 2014;1-4:77–86.
doi:10.1016/j.addma.2014.08.001.
[12] Mercelis P, Kruth J-P. Residual stresses in selective laser sintering and selective laser melting. Rapid Prototyping Journal 2006;12:254–65. doi:10.1108/13552540610707013.
[13] Hauser C, Chillds T, Dalgarno KW. Selective Laser Sintering of Stainless Steel 314S HC processed using room temperature powder beds. Proceedings of the SFF Symposium 1999:273–80.
[14] Pohl H, Simchi A, Issa M, Dias H. Thermal stresses in direct metal laser sintering. Proceedings of the Solid Freeform … 2001:366–72.
[15] Vrancken B, Wauthle R, Kruth J, Humbeeck J Van. Study on the influence of material properties on residual stress in selective laser melting. Lirias.kuleuven.be 2013.
[16] Dai K, Shaw L. Thermal and mechanical finite element modeling of laser forming from metal and ceramic powders. Acta Materialia 2004;52:69–80. doi:10.1016/j.actamat.2003.08.028.
[17] Riedlbauer D, Steinmann P, Mergheim J. Thermomechanical finite element simulations of selective electron beam melting processes: performance considerations. Computational Mechanics 2014;54:109–22. doi:10.1007/s00466-014-1026-0.
[18] Hodge NE, Ferencz RM, Solberg JM. Implementation of a thermomechanical model for the simulation of selective laser melting. Computational Mechanics 2014;54:33–51.
doi:10.1007/s00466-014-1024-2.
[19] Roberts IA. Investigation of Residual Stresses in the Laser Melting of Metal Powders in Additive Layer. University of Wolverhampton, 2012.
[20] Zaeh MF, Branner G. Investigations on residual stresses and deformations in selective laser melting. Production Engineering 2009;4:35–45. doi:10.1007/s11740-009-0192-y.
[21] Neugebauer F, Keller N, Xu H, Kober C, Ploshikhin V. Simulation of Selective Laser Melting Using Process Specific Layer Based Meshing. Proceedings of the Fraunhofer Direct Digital Manufacturing Conference, Bremen: 2014.
[22] Keller N, Ploshikhin V. New Method for Fast Predictions of Residual Stress and Distortion of AM Parts. Solid Freeform Fabrication Symposium, Austin, Texas: 2014, p. 1229–37.
[23] Jamshidinia M, Kong F, Kovacevic R. The Coupled CFD-FEM Model of Electron Beam Melting (EBM). ASME District F - Early Career Technical Conference Proceedings, Birmingham: 2013.
[24] Marimuthu S, Eghlio RM, Pinkerton AJ, Li L. Coupled Computational Fluid Dynamic and Finite Element Multiphase Modeling of Laser Weld Bead Geometry Formation and Joint Strengths. Journal of Manufacturing Science and Engineering 2013;135:11004.
1 2 3 4 5 6 7 8 9 10 11 12 13 14 15 16 17 18 19 20 21 22 23 24 25 26 27 28 29 30 31 32 33 34 35 36 37 38 39 40 41 42 43 44 45 46 47 48 49 50 51 52 53 54 55 56 57 58 59 60 61
[26] Khairallah S, Anderson A. Mesoscopic simulation model of selective laser melting of stainless steel powder. Journal of Materials Processing Technology 2014;214:2627–36.
doi:10.1016/j.jmatprotec.2014.06.001.
[27] Realizer SLM 50. Realizer GmbH. Borchen, Germany: 2015
[28] MSC Marc 2014.2. MSC Software Corporation. Newport Beach, California, USA: 2015
[29] Liu B. Further Process Understanding and Prediction on Selective Laser Melting of Stainless Steel 316L. University of Loughborough, 2013.
[30] Wood RA, Favor RJ, (U.S.) AFML. Titanium alloys handbook. Columbus, Ohio: Metals and Ceramics Information Center; 1972.
[31] Boivineau M, Cagran C, Doytier D, Eyraud V, Nadal M-H, Wilthan B, et al. Thermophysical Properties of Solid and Liquid Ti-6Al-4V (TA6V) Alloy. International Journal of Thermophysics 2006;27:507–29. doi:10.1007/s10765-005-0001-6.
[32] Alderson NA. Thermal Modeling and Simulation of Electron Beam Melting for Rapid Prototyping on Ti6Al4V Alloys. North Carolina State University, 2012.
[33] Goldak J, Chakravarti A, Bibby M. A new finite element model for welding heat sources. Metallurgical Transactions B 1984;15:299–305. doi:10.1007/BF02667333.
[34] Tolochko NK, Khlopkov Y V., Mozzharov SE, Ignatiev MB, Laoui T, Titov VI. Absorptance of powder materials suitable for laser sintering. Rapid Prototyping Journal 2000;6:155–61. doi:10.1108/13552540010337029.
[35] Fischer P, Romano V, Weber HP, Karapatis NP, Boillat E, Glardon R. Sintering of commercially pure titanium powder with a Nd:YAG laser source. Acta Materialia 2003;51:1651–62.
doi:10.1016/S1359-6454(02)00567-0.
[36] Simonelli M, Tuck C, Aboulkhair NT, Maskery I, Ashcroft I, Wildman RD, et al. A Study on the Laser Spatter and the Oxidation Reactions During Selective Laser Melting of 316L Stainless Steel, Al-Si10-Mg, and Ti-6Al-4V. Metallurgical and Materials Transactions A 2015.
doi:10.1007/s11661-015-2882-8.
[37] Fu CH, Guo YB. Three-Dimensional Temperature Gradient Mechanism in Selective Laser Melting of Ti-6Al-4V. Journal of Manufacturing Science and Engineering 2014;136:061004. doi:10.1115/1.4028539.
[38] Chakrabarty J. Applied plasticity. 2nd Ed. Boston: Springer; 2010.
[39] Deng D, Murakawa H, Liang W. Numerical and experimental investigations on welding residual stress in multi-pass butt-welded austenitic stainless steel pipe. Computational Materials Science 2008;42:234–44. doi:10.1016/j.commatsci.2007.07.009.
[40] Rangaswamy P, Choo H, Prime MB, Bourke MAM, Larsen JM. High Temperature Stress Assessment in SCS-6/Ti-6Al-4V Composite using Neutron Diffraction and Finite Element Modeling. International Conference on Processing & Manufacturing of Advanced Material, Los Alamos: 2000.
[41] Liu J, Tan M-J, Aue-u-lan Y, Guo M, Castagne S, Chua B-W. Superplastic-like forming of Ti-6Al-4V alloy. The International Journal of Advanced Manufacturing Technology 2013;69:1097– 104. doi:10.1007/s00170-013-5101-z.
1 2 3 4 5 6 7 8 9 10 11 12 13 14 15 16 17 18 19 20 21 22 23 24 25 26 27 28 29 30 31 32 33 34 35 36 37 38 39 40 41 42 43 44 45 46 47 48 49 50 51 52 53 54 55 56 57 58 59 60
[43] Gibson I, Rosen DW, Stucker B. Additive Manufacturing Technologies. vol. 54. Boston, MA: Springer US; 2010. doi:10.1007/978-1-4419-1120-9.
![Table 1 - Temperature dependent emissivity values used for both powder and solid compiled from two sources [30,31]](https://thumb-us.123doks.com/thumbv2/123dok_us/8655144.374276/7.595.197.395.230.516/table-temperature-dependent-emissivity-values-powder-compiled-sources.webp)