MODELLING AND SIMULATION OF RAIL PASSENGERS TO EVALUATE
METHODS TO REDUCE DWELL TIMES
Adam Perkins (a), Brendan Ryan (b), Peer-Olaf Siebers (c)
(a),(b)Faculty of Engineering, University of Nottingham, UK (c)Intelligent Modelling and Analysis Group, University of Nottingham, UK
(a)[email protected], (b)[email protected], (c)[email protected]
ABSTRACT
The paper outlines a feasibility study using modelling and simulation to reduce dwell times and increase rail network capacity. We use agent based modelling, where passengers are treated as a separate entities, basing their movements on rules from the Social Force Model (SFM), proposed by Helbing to model pedestrian dynamics. Implementing this SFM, together with a novel decision making system for passengers' door choices, a mesoscopic model is produced of the platform, train and passengers. An outline of the modelling process is presented, along with a critical analysis of the final model. Analyses are conducted to evaluate novel concepts in train and platform design, to reduce loading times, using passengers with a range of attributes. In a simulation experiment, four concepts (wider doors, designated boarding/alighting doors, and an active passenger information system) are assessed, with the latter two giving reductions in loading times of 7.0% and 7.3%.
Keywords: agent-based modelling, simulation, rail passengers, dwell time reduction.
1. INTRODUCTION
The rail network in the UK is fast approaching maximum capacity and passenger numbers are growing 6-7% per year. The current transport secretary, The Rt Hon Justine Greening has even said expressly "without investment in new capacity, our main rail arteries will grind to a halt during the 2020s, with disruption, overcrowding and damage to our economy" (Department for Transport 2012). It is stated in the Rail Technical Strategy (RTS 2012), an outline of a plan for the next 30 years of the rail industry, that even before 2020, East Croydon station would be too crowded to function successfully. This is one of many examples within a network approaching its capacity.
One relatively simple (and therefore cheap) way to increase capacity of the rail network is to reduce loading/unloading times (dwell time); this allows more frequent services while not requiring additional rolling stock. In their study on international dwell times, Harris and Anderson (2007) proposed examples to reduce dwell times. These included wider platforms, separate
boarding and alighting platforms and "step aside" signs in front of doors. They found that "function time", where doors are closing and the train is preparing for departure is equally important as boarding/alighting time; however this varied widely between stations and countries. The study also identified that some of these dwell time reducing methods succeeded, but failed to quantify by how much. When displaying results, they did not identify the stations and reasons for their relative success or failure. Harris (2000) also performed a study on station capacity at Norreport, Denmark, which interestingly found that military style music helped speed up the boarding/alighting process.
Our project tests the ability of simulation to assess a number of these and other novel methods for reducing dwell times, as well as the impact each method would have across a number of different scenarios.
2010). This research group has also produced a report for the Department for Transport (DfT) on train dwell times (Fujiyama et al. 2008). This type of study is carried out at great expense in both time and money, and can only hope to study a small section of the platform or train at any one time, ignoring any interactions between sections. This is acknowledged in the DfT report, and suggests that the train and the platform should be "considered as one connected system".
In order to test strategies to reduce train dwell time, it is proposed that modelling and simulation of the platform-train interface as a holistic system would provide a relatively cheap, easy and extremely flexible solution to assess strategies and concepts in reducing dwell times, also with opportunities to take account of the attributes of different types of passengers. The following strategies to reduce dwell times were assessed:
Wider doors (1.5x and 2x the standard size)
Designated boarding and alighting doors
Novel passenger information systems, such as those proposed by Network Rail and Thameslink, and currently in a limited trial in a Dutch station (Fast Co. Design 2014).
While we acknowledge that there are several simulation tools that enable similar studies (e.g. Sourd et al. 2011; Nash et al. 2007; Zhang et al. 2008), the novelty of our approach lies in the application of the Extended Social Force Model (ESFM) (Xi et al. 2011) in the context of dwell time optimisation, as well as the fact that we are able to define a specific heterogeneous population when we develop our scenarios. The aim of this paper is to introduce our novel Agent-Based Modelling (ABM) approach and to demonstrate the feasibility of it for assessing potential methods of reducing rail passenger dwell times for different passenger populations.
2. MODELLING THEORY
ABM is the current state of the art in modelling and simulation for pedestrian dynamics (Castle and Crooks 2006) and is based on treating each pedestrian as an individual "Agent" that bases its decisions on a set of predetermined rules. This naturally lends itself to modelling of pedestrians in a heterogeneous crowd. ABM was first used extensively in the Social Sciences (Dowie and Schelling 1980; Axelrod 1997) to show emergent collective behaviour; how a number of microscopic decisions lead to much larger macroscopic level emergent behaviour of a crowd. It was in the Social Sciences that the Social Force Model (SFM) was first proposed (Helbing 1991). The SFM treats each agent as if it had an electrical charge, and so as two agents move towards each other they feel a repulsive effect. They also receive an attractive force from their destination point (usually an area). The resultant force acts on the agent, and gives it an acceleration (or deceleration), adjusting the speed of each agent. In addition to these psychological forces, when agents are
physically touching two physiological forces are produced, based on granular interaction forces: a tangential force, and a frictional force. The same combination of psychological and physiological forces is produced with interactions with walls and barriers (boundaries).
3. MODEL DEVELOPMENT
For the model design and implementation we used AnyLogic 7.1.2 (University Edition). AnyLogic is a multi-paradigm Eclipse-based commercial drag and drop modelling and simulation IDE. It can be programmed and extended using Java and supports GUI design.
3.1. Base Model
In starting to create a computational model, it was important to start with a small scale, simple model to test the SFM. The SFM was implemented by computing the force on an agent at each time step, using the Equations 1-3, provided by Xi et al. (2010).
𝑚𝑖 𝑑𝒗𝑖
𝑑𝑡 = 𝑚𝑖
𝑣𝑖0(𝑡)𝒆𝑖0(𝑡)− 𝒗𝑖(𝑡)
𝜏𝑖 +
∑
𝑗(≠𝑖)𝒇𝑖𝑗+∑
𝑊𝒇𝑖𝑊 (1)𝒇𝑖𝑗= 𝒇𝑖𝑗𝑝𝑠𝑦+ 𝒇𝑖𝑗𝑝ℎ𝑦, 𝒇𝑖𝑗𝑝𝑠𝑦 = 𝐴𝑖exp ( 𝑟𝑖𝑗− 𝑑𝑖𝑗
𝐵𝑖 )𝒏𝑖𝑗 (2)
𝒇𝑖𝑗𝑝ℎ𝑦 = 𝑘𝑔
(
𝑟𝑖𝑗− 𝑑𝑖𝑗)
𝒏𝑖𝑗+ 𝜅𝑔(𝑟𝑖𝑗− 𝑑𝑖𝑗)Δ𝑣𝑗𝑖𝑡𝒕𝑖𝑗 (3)Using this force, it is possible to update the velocity, and position of the agent at each time step. From this the parameters used in the SFM could be calibrated in order to produce realistic behaviour. The four behaviours that are to be expected were outlined in Helbing's papers (Helbing and Molnar 1995; Helbing et al. 2000). These are:
Clogging at bottlenecks
Lane formation
Oscillations at doorways
Freezing by heating
The "Freezing by Heating" behaviour refers to pedestrians' high desired velocities resulting in slower overall movements. For the calibration we used a trial and error approach. All four behaviours were visible once parameters were set to the values shown in Table 1; column 1. Most of these are quite different to the ones from Helbing shown in Table 1; column 2. In our implementation the diameter of each agent is set by a uniform distribution between 0.45 and 0.75m, and their mass related to this, with a range of 60-100kg.
Table 1: Parameters Used in Both Models
Initial values Helbing's values Final values
A [N] 200 2000 30000
B [m] 1.5 x combined
radii (approx. 1.5) 0.08 0.6
k [kgm-1s-1)] 390 2500000 9500
K [kgs-2] 300 1200000 30000
τ [s] 0.5 0.5 0.5
It was also necessary to consider another set of parameters for the interactions with the walls or other boundaries. This is due firstly, to the large amount of agents and the nature of waiting for doors to open and secondly, because of agents near to the walls of the train
or the closed doors, which feel a large force from the passengers behind them. A large reactionary force is then needed from the wall to counteract this and stop passengers "jumping through walls". This required larger parameter values, particularly for the physical forces. Even after these changes some passengers do not stop at the walls but we decided to leave this as further work. The final parameter values are shown in Table 1; column 3.
3.2. Passenger Types
boarders do not wait for alighters before they start moving. Instead it is left to the social force model to decide which group moves, hopefully oscillating, depending on relative group sizes.
After the passengers' movements and decision making were modelled, tested, calibrated and de-bugged, the AnyLogic 3D engine was employed to give a more realistic visualisation. One significant bug fixed was agents getting "trapped" in corners. When an agent has to go through a door, a temporary waypoint or target had to be added in the doorway, to ensure they went through the door before heading towards their overall target.
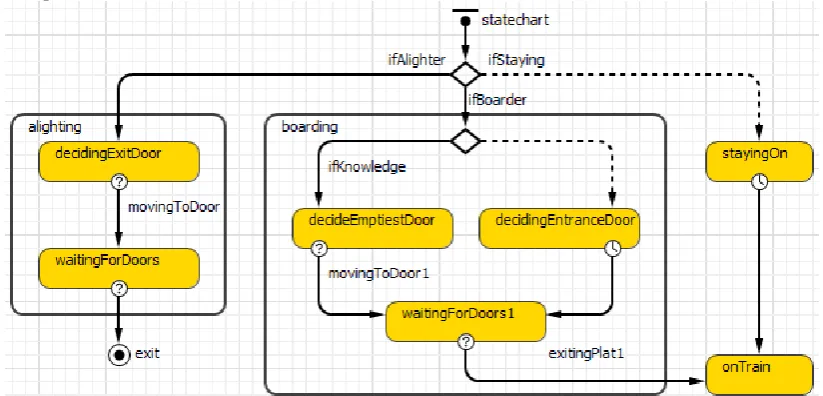
3.3. Passenger States
During the simulation a passenger can be in different states. This was captured by producing a UML state machine diagram which is then translated into source code by AnyLogic. In this kind of diagram states are represented by ovals and transitions between states are represented by arrows (Siebers and Onggo 2014). Events will trigger state changes. There are different types of events, the key ones are: timeouts (triggered when a specific time has elapsed), rates (triggered at a certain rate which usually depends on a distribution), and conditions (a condition has become true). Such a state chart is embedded in every passenger object so that each passenger has its own current state depending on their type (i.e. the current settings of his attributes) and their environment. The passenger state machine diagram is shown in Figure 1. This sets the variables and targets for each passenger in the beginning of a simulation run, and provides information about the state they are in during the simulation run (on platform, deciding door, exiting etc.).
4. MODEL IMPLEMENTATION
4.1. Simulation Platform
The model has been implemented using the AnyLogic IDE. The complete model is available for download at
http://www.cs.nott.ac.uk/~pos/publications/mas2015mo del.zip. Although AnyLogic comes with a pedestrian library which uses the SFM and could be used to build simple models, we found this library to be limited and inflexible. Therefore we developed our own SFM implementation, considering the form factor coefficient and our novel decision making algorithm within our agent template. In the end we only used the library for providing the 3D animation of the passenger agents.
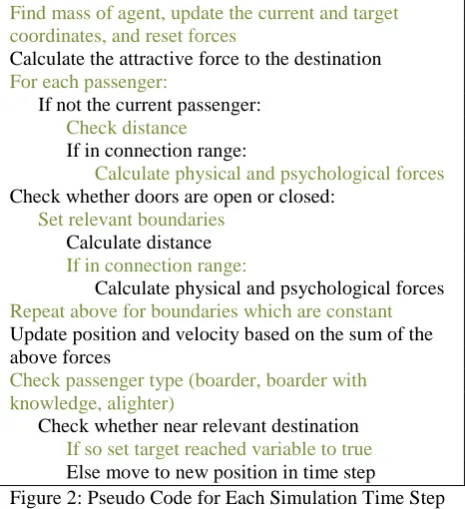
4.2. Simulation Execution Algorithm
The overall simulation runs in time steps. Throughout the time horizon at each time step a certain algorithm is executed. The pseudo code for this algorithm is provided in Figure 2.
4.3. Verification and Validation
Six model verification and validation techniques, originally described by Law and Kelton (1982), have been applied to validate the model. These included continuous debugging, independent review, reasonable output, trace, model run with known characteristics, and animation. At each stage of building the model any bugs were identified and debugged. At various points throughout the project experts in human factors and agent-based simulation were consulted to verify any assumptions and observations made and to assess the state of the model. The base case outputs of the simulation model were compared both qualitatively and quantitatively to previously observed and expected outputs. Decision making processes, scenarios and strategies were all derived from observation and assumptions of real stations. Real data were used for input parameters, for both agents and the environment. The simulation has both 2D and 3D animations to provide a visualised output, in both static images and video which could lead to further analysis. After applying all these verification and validation techniques we are confident that our simulation model is sufficiently accurate for the purpose at hand.
[image:4.595.91.503.543.741.2]Find mass of agent, update the current and target coordinates, and reset forces
Calculate the attractive force to the destination For each passenger:
If not the current passenger: Check distance
If in connection range:
Calculate physical and psychological forces Check whether doors are open or closed:
Set relevant boundaries Calculate distance If in connection range:
Calculate physical and psychological forces Repeat above for boundaries which are constant Update position and velocity based on the sum of the above forces
Check passenger type (boarder, boarder with knowledge, alighter)
[image:5.595.49.282.73.328.2]Check whether near relevant destination If so set target reached variable to true Else move to new position in time step
Figure 2: Pseudo Code for Each Simulation Time Step
5. EXPERIMENTATION
5.1. Scenarios
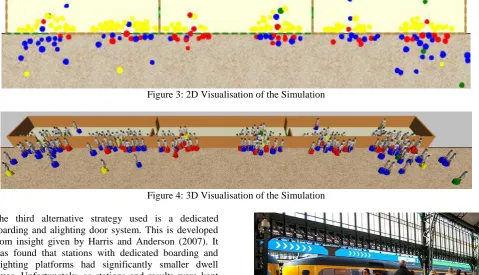
There are four different scenarios which are examined in the experimentation. In all scenarios a three carriage train was used, with carriages based on the British Rail Class 456, deemed to be a fairly generic train design. Each carriage is 20m long, and has two doors facing the platform, as well as the opposing side (however these are ignored in the model as they do not have an influence on the boarding and alighting). The platform is also modelled to be fairly generic, with no particular features such as barriers or narrow areas. It was modelled to be 90m long and approximately 15m wide, perhaps wider than the average. In each simulation 100 boarding passengers are distributed randomly in two areas of the platform (near to the track awaiting the train and in a waiting area at the rear of the platform) at the beginning of the simulation, with additional passengers arriving from two entrances during the run time of the simulation. Boarders base their door decision on where they predict the nearest door to be. Images of the simulation in both 2D and 3D can be seen in Figure 3 and Figure 4.
The attributes for the different scenarios are as follows:
Scenario 1: The "standard" generic scenario: 600 passengers (2/3 capacity, split evenly between boarders, alighters, and 200 ignored in the simulation but assumed to be staying on train); Normal Distribution (ND) of desired walking speeds, with Mean (M) 1.3m/s and
Standard Deviation (SD) 0.2m/s (Fitzpatrick et al. 2006); 10% of passengers have "knowledge" of the emptiest door
Scenario 2: The "rush hour" scenario in which the majority of the passengers are expected to be middle-aged commuters: 1200 passengers (4/3 capacity, deemed to be "overcrowded" (Rail Technical Web Pages 2011), and split equally between boarders, alighters and 400 staying on the train); ND, with M 1.47m/s (Fitzpatrick et al. 2006) and SD 0.2m/s; 50% of passengers have "knowledge" of the emptiest door
Scenario 3: "OAP day out" in which a large number of passengers are elderly passengers. This may somewhat represent a daytime situation, but is mainly for curiosity, as to the effects of a number of slower passengers on the system as a whole: 600 passengers (same even split as the "standard" situation, at 2/3 of capacity); ND, with M 1m/s and SD 0.5m/s (Oxley et al. 2004); 10% of passengers have "knowledge"
Scenario 4: The "Emergency" scenario, to assess how well the train and platform can be cleared, including a higher desired velocity representing panic: 400 passengers, 44% of capacity, and all of which being alighters; ND, with M 3m/s and SD 1m/s; 10% of passengers have "knowledge".
5.2. Strategies
In each of the four scenarios, the standard strategy (as currently used) is compared to four alternative strategies in order to reduce dwell time. The standard strategy uses the standard doors, 1600mm in width (Rail Technical Web Pages 2011). Doors are used for both boarding and alighting, and it is assumed that boarders do not wait for all alighters to exit the train before entering. The direction of crowd movement through doors is left to the SFM.
The first alternative strategy for reducing dwell time is a slightly wider door, at 2400mm (1.5x standard door width). If a standard door is classed as a double door, this would be a triple width. It is chosen so that we can have some insight as to whether this allows for more "lanes" of traffic through the door (e.g. three lanes), or whether people avoid an additional middle lane, for example, due to social forces.
Figure 3: 2D Visualisation of the Simulation
Figure 4: 3D Visualisation of the Simulation
The third alternative strategy used is a dedicated boarding and alighting door system. This is developed from insight given by Harris and Anderson (2007). It was found that stations with dedicated boarding and alighting platforms had significantly smaller dwell times. Unfortunately, as stations and results were kept anonymous, it is impossible to give a quantitative percentage decrease from this paper. They do acknowledge the weakness in dedicated platforms (i.e. the large amounts of infrastructure needed to have two platforms on every track). This would be almost impossible to achieve on the current British rail network (either increasing the numbers of platforms per track, or the number of tracks would need to be reduced). This would not give the network capacity increase that is needed. Thus dedicated doors for boarding and alighting on the same platform are proposed. These allow the separation of passenger flows, similar to dedicated platforms, but without the costly infrastructure changes. This strategy is modelled by adapting the execution algorithm presented in Figure 2, to only allow boarding and alighting at their designated doors. The fourth alternative strategy is used to represent a novel passenger information system. This was first proposed by a Dutch design company, and is a long LED screen, placed above the edge of the platform. By using infrared sensors, the screen is updated with real-time information on the number of passengers in each carriage and the locations of the waiting points for the doors for the less crowded carriages. An image of this in a small-scale test at a single station is shown in Figure 5. This information system is modelled computationally by every passenger in the scenario having "knowledge" of the station and the least busy door.
5.3. Experiment execution
Each of the strategies and scenarios were tested (four factors with five levels respectively). Each combination was tested three times and means for loading times for three repetitions were then calculated.
Figure 5: The Novel Passenger Information System (Above the Train) during a Pilot Test at the Den Bosch Rail Station (Fast Co. Design 2014)
5.4. Results and Discussion
The quantitative output in this particular experiment was total loading time, taken when 90% of passengers had either alighted or boarded. 90% was chosen to overcome some of the bugs still in the model, ignoring those passengers who became stuck within the simulation. Despite the main focus on loading time in this experiment, there are a number of other numerical outputs that could be available from this simulation. Boarding and alighting times could be measured separately. Within the simulation window a plot of the door utilisation is shown in real time. This information could be noted at a number of time steps, producing a plot of each door use against time to provide an insight as to when each door is fully, over, or underutilized, as in the example from the standard simulation in Figure 6.
[image:6.595.317.537.655.734.2]When the doors are first opened, all doors are similarly utilised (11 to 17 passengers), whereas 60 seconds after this, the end doors have on average 172% more passengers than the inner doors, with a range of 5 to 19 passengers at each door.
The average loading times for each strategy in each scenario is shown in Figure 7. From this, analysis can be performed on the effectiveness of each strategy. In the standard scenario, with no loading strategy, an average loading time was 70 seconds, and other strategies are compared to this standard. For the 400 boarding and alighting passengers this seems realistic. Wiggenraad (2001) found that each alighting passenger going through any one door takes 1.1s, while each boarding passenger takes 0.85s. For this standard scenario with 200 boarders and 200 alighters, this would amount to 65s.
Using a mean reduction in total loading time as the measure of a strategy's efficiency, the best strategy seems to be the novel passenger information system, with a reduction of 7.3%. The dedicated boarding and alighting doors also performed well, with a 7.0% reduction. However, these were less efficient during the emergency scenario, due to a modelling assumption that would likely be ignored in a real emergency (i.e. that only the designated alighting doors could be used, despite the emergency). This effectively halved the number of exit doors available, and it would be hoped that common sense would prevail and this would not apply in an actual emergency.
The information system did not seem to be effective in the rush hour scenario. This could also be due to a ruling made during the modelling stage. By assuming boarding passengers do not allow alighting passengers to get off the train first, pressure builds up around the doors, particularly with the high passenger numbers seen in rush hour. When doors are less well used by boarding passengers, a release of this pressure is triggered as the alighting passengers have a clear exit door. When all doors are used more equally, as with the passenger information system, there are few opportunities for this social pressure to be released. One suggestion would then be to use a combination of the designated boarding/alighting doors and this passenger information system.
Wider doors led to a 1.5% and 3.5% reduction respectively. This is less than perhaps could be expected. Wiggenraad (2001) found an 11.8% reduction with 18% wider doors. He also found a diminishing returns effect that is not seen in this simulation; a 72.7% wider door only gave a 13.7%
reduction. Part of the reason for this may be the differing definitions of "standard" width. When Wiggenraad performed his experiment the standard was 1100mm, whereas now, in this model it was taken as 1600mm. This means the same percentage increase is now a larger actual increase in width, potentially allowing a whole additional lane of traffic through the door.
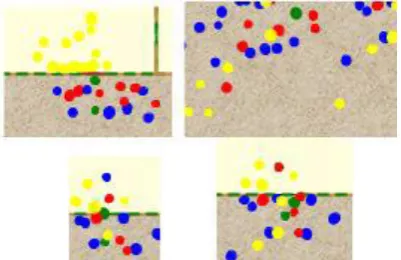
Qualitatively, the model performed well. Within each simulation there were a number of expected behaviours shown. Crowding around doors, lane formation and oscillations in the direction of movement through doors can all be viewed in Figure 8 (see the expected behaviours from Helbing's papers 1995, 2000).
6. LIMITATIONS AND FURTHER WORK
6.1. Limitations
While the results above show that the model, in its current state, can give very useful and direct real-world outputs, some weaknesses remain. One potential weakness of multi agent simulation is the time taken to run large simulations with many agents. In the "rush hour" scenarios, it took approximately 20 minutes to run a 4 minute simulation, using an Intel Pentium 2.1GHz with 1GB RAM. However, while this is a long time period for a short simulation, when added to the development and modelling time, this would still be quicker than developing and building a physical experiment. There is also a compounding issue with higher numbers of agents. Higher forces are seen and therefore smaller time steps are needed to maintain realistic movement, adding to the slow performance. One remaining bug, agents "bouncing" unrealistically long distances in short spaces of time, also becomes a greater issue with larger numbers of agents. When this occurs, agents initialise overlapping other agents, causing their repulsive forces to be unnaturally high. These are not physically possible or realistically expected. This also tends to occur in the first few seconds of the simulation starting, for the same reason of agents overlapping when initialising. It also occurs when the alighters initialise in the confined space of the train, forcing some to get stuck in the train. These have to be ignored in the results and outputs, but still produce a computational strain. This also limited the emergency simulation to 400 alighters, as adding more caused most of the agents to be forced out through the walls of the train, producing unnatural results.
Figure 8: Clockwise from Top Left: Crowding Around Doors/Bottlenecks; Lane Formation and Oscillations Through Doorways; Alighters Going Out in YELLOW; Boarders Going Through in GREEN, BLUE and RED)
6.2. Further work
In this project we have conducted a feasibility study. There is much further work that could be done with this model in order to give it better real-world application. The first, and perhaps most important potential improvement, is to iron out more of the issues and bugs affecting the current iteration. In particular a rule should be applied so that no agent can be initialised within touching distance of an existing agent, in order to avoid the unnatural "bouncing". This seems to also be the major cause of passengers "jumping through walls". The next potential step is applying the model to the interior of the train. This has a large effect on flow through the doors and therefore on boarding and alighting times. Currently, there are no known studies into modelling this aspect. This would also fit with the philosophy of looking at the holistic train-platform system. It remains to be seen if the social force model would be applicable in this situation. Having so many obstacles in such a confined space, the forces related to these may sum to be so great as to produce unrealistic behaviour, forcing passengers to bounce around, or to be pushed backwards or through walls. This could be avoided by incorporating another set or parameters for internal obstacles, or a smaller connection range, ignoring all but the closest of obstacles in social force calculations. It would also require an additional state for sitting, though sitting passengers would take up a different floor area than those standing or walking. New concepts in the design of this could also be evaluated. This could also be applied to the environments on the platform (e.g. in relation to benches or seats for waiting at the rear of the platform). Some of the passengers that are randomly distributed at the rear of the platform at the beginning of the simulation would be assumed to be sitting.
Another potential improvement could be through more detailed input data, with particular use in validation and calibration. Input data from a specific platform, train, or scenario (a train dwell) at a station, including the numbers and the characteristics of passengers, could be compared to a simulation of the scenario. This could be used to produce a wider range of outputs and results, such as a passenger density map as a direct qualitative
output, and flows at doors or entrances/exits. These could also be compared to outputs from similar simulations (e.g. Legion SpaceWorks). Once the agent-based model and simulation outputs are empirically validated against a number of real-world scenarios, we can be confident that the outputs with the differing dwell-time reducing strategies are sufficiently accurate for the purpose at hand.
Groups have been proposed and implemented before as part of the social force model (Xi et al. 2010). This requires a socially attractive force between group members, as opposed to the socially repulsive forces between unrelated agents. This is relatively simple mathematically, with one additional term in the social force equation. However, the difficulty comes in keeping track computationally of group members, and initialising them within these groups.
In this model, it was not assumed that all alighters are allowed off the train before boarders start getting on. In Britain, in particular, this is expected in most occasions, and so further tests could be performed with this social rule assumed. In many other countries (e.g. Germany or China) this is not the case, and it would be useful to have an option that allows parallel alighting and boarding at different levels.
7. CONCLUSIONS
The study presented in this paper has demonstrated the potential for using ABM, incorporating the Extended SFM, to assess methods of reducing dwell time at stations. A train / platform environment has been created that is capable of being adapted to represent new design ideas (e.g. providing wider doors or train carriages with different door configurations). A set of scenarios have been developed that reflect a range of real world situations, including different densities and attributes of people that interact with the station environment. These scenarios have been tested, producing some preliminary findings on boarding and alighting time. For example, from this model, it has been highlighted that using dedicated boarding and alighting doors and a novel passenger information system are promising strategies for reducing dwell times. Further work could be performed to see if this can give similar physical results to the reductions seen in this experiment (i.e. 7% and 7.3%). A combination of these strategies could be very effective.
[image:8.595.56.257.72.202.2]REFERENCES
Anylogic.com, 2015a. AnyLogic Tackles Eiffel Tower Crowds. Available from: http://www.anylogic.com/case-studies/anylogic-tackles-eiffel-tower-crowds [Accessed 4 May 2015].
Anylogic.com, 2015b. Choosing the Best Concept for a Passenger Rail Car. Available from: http://www.anylogic.com/case-studies/choosing-the-best-concept-for-a-passenger-rail-car [Accessed 4 May 2015].
Anylogic.com, 2015c. Passenger Flow Simulation at Frankfurt Airport. Available from: http://www.anylogic.com/case-studies/simulation-of-the-frankfurt-airport [Accessed 4 May 2015]. Apel, M., 2004. Simulation of Pedestrian Flows Based
on the Social Force Model Using the Verlet Link Cell Algorithm. Masters. Poznan University of Technology.
Axelrod, R., 1997. The Dissemination of Culture: A Model with Local Convergence and Global Polarization. Journal of Conflict Resolution, 41(2), 203-226.
Berrou, J., Beecham, J., Quaglia, P., Kargarlis, M. and Gerodimos, A., 2007. Calibration and validation of the Legion simulation model using empirical data. In: N. Waldau, P. Gattermann, H. Knoflacher and M. Schreckenberg, ed., Pedestrian and Evacuation Dynamics 2005, 1st ed. Springer Berlin Heidelberg, pp.167-181. Available from: http://citeseerx.ist.psu.edu/viewdoc/download?doi =10.1.1.12 7.559&rep=rep1&type=pdf [Accessed 4 May 2015].
Castle, C. and Crooks, A., 2006. Principles and Concepts of Agent-Based Modelling for Developing Geospatial Simulations. CASA Working Papers. London. Available from: http://discovery.ucl.ac.uk/3342/1/3342.pdf
[Accessed 4 May 2015].
Department for Transport, 2012. Making HS2 happen.
Available from:
https://www.gov.uk/government/speeches/making-hs2-happen [Accessed 4 May 2015].
Dowie, J. and Schelling, T., 1980. Micromotives and Macrobehaviour. The Economic Journal, 90(359), 648.
European Commission. 2015. European Commission : CORDIS : Publications : Final Report - AVATARS (Advanced Virtual Agents for Testing the Accessibility of Rail Stations). Available from: http://cordis.europa.eu/publication/rcn/11030_en.h tml [Accessed 4 May 2015].
Farkas, I., Heibing, D. and Vlosek, T., 2000. Simulating dynamical features of escape panic. Emmitsburg, MD: National Emergency Training Center. Fast Co. Design, 2014. Ingenious Signs Ensure You
Always Get A Seat On The Train. Available from: http://www.fastcodesign.com/3033147/terminal- velocity/these-ingenious-signs-ensure-you-always-get-a-seat-on-the-train [Accessed 4 May 2015].
Fitzpatrick, K., Brewer, M. and Turner, S., 2006. Another Look at Pedestrian Walking Speed. Transportation Research Record, 1982(1), 21-29. Fujiyama, T. and Tyler, N., 2010. Predicting the
walking speed of pedestrians on stairs. Transportation Planning and Technology, 33(2), 177-202.
Fujiyama, T., Nowers, J. and Tyler, N., 2008. Investigation into train dwell time, research report submitted to UK Department for Transport.
Available from:
http://discovery.ucl.ac.uk/1363563/ [Accessed 4 May 2015].
Fujiyama, T., Tyler, N., Childs, C. and Boampong, D., 2014. Investigating ramp gradients for humps on railway platforms. Proceedings of the ICE - Municipal Engineer, 1-11.
Grontmij and Carl Bro, n.d.. Grontmij / Carl Bro and Legion Real-Time 3D Simulation Model of the Station: General Overview and Conclusions.
Available from:
http://www.bentleyuser.dk/sites/default/files/b6_-_crowd__pedestrian_simulation_norreport_station. pdf [Accessed 4 May 2015].
Harris, N., 2000. Station capacity at Nørreport. Report for Danish Government, 2000, The Railway Consultancy Ltd., London, http://www.trm.dk/en/publications/2000/station-capacity-at-norreport [Accessed 14 May 2015] Harris, N. and Anderson, R., 2007. An international
comparison of urban rail boarding and alighting rates. Proceedings of the Institution of Mechanical Engineers, Part F: Journal of Rail and Rapid Transit, 221(4), 521-526.
Helbing, D., 1991. A mathematical model for the behavior of pedestrians. Behavioral Science, 36(4), 298-310.
Helbing, D., and Molnar, P., 1995. Social force model for pedestrian dynamics. Physical Review E, 51(5), 4282.
Helbing, D., Farkas, I., and Vicsek, T., 2000. Simulating dynamical features of escape panic. Nature, 407(6803), 487-490.
Johansson, A., Helbing, D. and Shukla, P., 2007. Specification of the Social Force Pedestrian Model by Evolutionary Adjustment to Video Tracking Data. Advs. Complex Syst., 10(supp02), pp.271-288.
Law, A. and Kelton, W., 1982. Simulation modeling and analysis. New York: McGraw-Hill.
Li, X., Zhang, W., Chen, F. and Li, Z., 2013. Analysis of Rail Transit Station Passenger Capacity Based on System Dynamics. AMM, 409-410, 1277-1286. Ministry of Transport, Denmark, 2000. Station Capacity
at Norreport. 14, 18.
Transportation Research Board, Washington DC. 17-25.
Network Rail, 2011. Station Capacity Assessment Guidelines. Station Design Principles. Network Rail.
Network Rail, 2015. Station design principles for Network Rail, Document no. BLDG-SP80-002, Network Rail, UK.
Oxley, J., Fildes, B. and Dewar, R., 2004. Safety of older pedestrians. In: National Research Council (U.S.). Transportation Research Board, ed., Transportation in an aging society: a decade of experience, 1st ed. Washington D.C.: Transportation Research Board of the National Academies, 167-191.
Rail Technical Web Pages, 2011. Railway Passenger Vehicle Capacity. 1st ed. Available from:
http://www.railway-technical.com/Infopaper%202%20Railway%20Pas senger%2 0Vehicle%20Capacity%20v3.pdf [Accessed 4 May 2015].
Reynolds, C., 1987. Flocks, herds and schools: A distributed behavioral model. ACM SIGGRAPH Computer Graphics, 21(4), 25-34.
Reynolds, C., 2015. Boids (Flocks, Herds, and Schools: a Distributed BehavioralModel). Red3d.com. Available from: http://www.red3d.com/cwr/boids/ [Accessed 4 May 2015].
RRUKA, 2013. The Academic Response the Rail Technical Strategy 2012, produced by members of the Rail Research UK Association, November 2013, UK. Available from: http://rruka.org.uk/wp-content/themes/cfrruka/flipbooks/RRUKA%20Ac ademic%2 0Response%20Booklet.html [Accessed 4 May 2015].
RTS, 2012. The Future Railway – The Industry’s Rail Technical Strategy 2012 Supporting Railway Business. Produced by RSSB on behalf of the Technical Strategy Leadership Group, UK. Shannon, R. and Johannes, J., 1976. Systems
Simulation: The Art and Science. IEEE Trans. Syst., Man, Cybern., 6(10), 723-724.
Siebers, P.O. and Onggo, B.S.S., 2014. Graphical Representation of Agent-Based Models in Operational Research and Management Science using UML. In: Proceedings of the 7th OR Society Simulation Workshop (SW14), 1-2 Apr, Worcestershire, UK.
Sourd, F., Talotte, C., Ambroise, C., Constans-Brugeais, Y., Pillon, A. and Donakian, S., 2011. Modelling of pedestrian flows during dwelling: development of a simulator to evaluate rolling stock and platform flow performance. In: Proceedings of the World Congress on Railway Research (WCRR2011), 22-26 May, Lille, France. Still, G., 2000. Crowd Dynamics. PhD. University of
Warwick.
Technical Strategy Leadership Group, 2012. The Future Railway: The Industry’s Rail Technical Strategy
2012. Available from:
http://www.futurerailway.org/Documents/RTS%2 02012%20 The%20Future%20Railway.pdf [Accessed 4 May 2015].
Thompson, E., Kazi, T., Wright, K., Woods, M. and Blakemore, R., 2013. Using technology to improve the efficient use of rail stations. Rail Human Factors, 3-12. Available from: http://www.crcnetbase.com/doi/abs/10.1201/b1382 7-3 [Accessed 4 May 2015].
Transport for London, 2006. Transport assessment best practice: Guidance document. TfL, UK.
Waldau, N., Gattermann, P., Knoflacher, H. and Schreckenberg, M., 2006. Pedestrian and Evacuation Dynamics. Dordrecht: Springer-Verlag Berlin and Heidelberg GmbH & Co. KG.
Wiggenraad, P., 2001. Alighting and boarding times of passengers at Dutch railway stations. Delft: TRAIL Research School.
Wolfram, S., 1983. Statistical Mechanics of Cellular Automata. Reviews of Modern Physics 55 (3), 601–644.
Xi, H., Son, Y. and Lee, S., 2010. An integrated pedestrian behavior model based on Extended Decision Field Theory and Social Force model. In: 2010 Winter Simulation Conference. IEEE, 824 - 836.
Zhang, Q., Han, B. and Li, D., 2008. Modeling and simulation of passenger alighting and boarding movement in Beijing metro stations. Transportation Research Part C: Emerging Technologies, 16(5), 635-649.
AUTHORS BIOGRAPHY
ADAM PERKINS is a graduate from the Mechanical Engineering Masters Programme at the Department of Mechanical, Materials and Manufacturing Engineering, University of Nottingham, UK.
BRENDAN RYAN is a lecturer in the Faculty of Engineering at the University of Nottingham, with specialist areas of research in Ergonomics / Human Factors and Transport, with particular interest in the how public behaviour can be modelled and simulated. Web: http://www.nottingham.ac.uk/engineering/people/ brendan.ryan.