Proceedings of the Fourth Arabic Natural Language Processing Workshop, pages 264–268
264
JHU System Description
for the MADAR Arabic Dialect Identification Shared Task
Tom Lippincott
Pamela Shapiro
Kevin Duh
Paul McNamee
Department of Computer Science Johns Hopkins University
Baltimore, MD 21218
Abstract
Our submission to the MADAR shared task on Arabic dialect identification (Bouamor et al.,
2019) employed a language modeling tech-nique called Prediction by Partial Match-ing, an ensemble of neural architectures, and sources of additional data for training word embeddings and auxiliary language models.1
We found several of these techniques provided small boosts in performance, though a simple character-level language model was a strong baseline, and a lower-order LM achieved best performance on Subtask 2. Interestingly, word embeddings provided no consistent benefit, and ensembling struggled to outperform the best component submodel. This suggests the variety of architectures are learning redundant information, and future work may focus on en-couraging decorrelated learning.
1 Introduction
While Modern Standard Arabic (MSA) is used across many countries for formal written com-munication, regional Arabic dialects vary sub-stantially. Dialect identification has traditionally been performed at the level of broad families of dialects—for instance grouping many dialects across the Arabian Peninsula together. However, even within a single country there is often no-ticeable variation from one city to another. The MADAR dataset and corresponding shared task aim to perform dialect identification at a finer-grained level. Subtask 1 aims to distinguish travel phrases produced between Arabic dialect speak-ers from 25 different cities, as well as MSA.
Sub-1Code available athttps://bit.ly/2Kouo5X
task 2 aims to distinguish Twitter users from dif-ferent Arabic-speaking countries. Along with the inherent difficulty of classifying short documents, highly-correlated modalities like topic and proper names can lead to overfitting, particularly for user-directed content like Twitter. Our method attempts to address the former by using a language model-ing technique that has empirically been found to perform well on extremely short documents. For the latter, we employ ensembles of heterogeneous neural architectures and aggressive dropout, with the goal of finding a broad range of features that support the task without overfitting.
2 Data
In addition to the data provided by the MADAR subtasks, we used the following data sets to train embeddings or auxiliary language models:
1. Preexisting collections of the Arabic Dialect Corpus (ADC) of 150k comments from three Arabic-language newspaper sites focused on Saudi Arabia, Jordan, and Egypt (Zaidan and Callison-Burch,2011)
2. The Twitter LID corpus of 70k Tweets in 70 languages2.
3. Crawled posts from Reddit and the Twitter 1% sample either tagged as Arabic, or having a majority of Arabic characters, amounting to 11k and 100m posts, respectively, are used.
The ADC and Twitter LID corpora were also used to train additional PPM language models,
though these proved to be ineffective in our en-sembles (see Section5)
[image:2.595.133.228.100.160.2]Split Missing Train 13076 (6%) Dev 1607 (5%) Test 5763 (12%)
Table 1: Missing tweets from the Subtask 2 data splits, absolute number and percent of total.
Table1shows how many tweets were still avail-able when we initialized Subtask 2.
3 System
3.1 PPM Language Models
Prediction by Partial Matching (PPM) was first introduced as a sequence compression algorithm (Cleary and Witten,1984) but has been found to be particularly effective as a character language model for classifying short documents (Frank et al., 2000; McNamee, 2016), using the proba-bilities directly rather than as input to a numeric encoding.
PPM is based on a variable-order Markov model that contains a parameter N known as the maxi-mal order. When compressing data files or train-ing a classification model, observations from pre-viously seen data are used to estimate the likeli-hood of observing a symbol following a given con-text of up to N characters. Longer contexts are used when available, starting with the maximal or-derN. However, PPM automatically backs off to use shorter contexts when a symbol has never been observed in a longer context. A context-dependent penalty, also known as an escape probability, is ap-plied when backing off is required.
As an example, in English, an ‘n’ is the most likely character observed after the sequence “t i o”. Other letters are observed less frequently, such as ‘l’, ‘m’, and ‘p’. However, a ‘z’ is not observed. To account for a ‘z’ after “t i o” it is necessary to back off using the estimates from shorter contexts such as “i o”. If a ‘z’ has never been observed after “i o” then the process continues, with an additional penalty and further recursive backoff for ‘z’ using the context of the single symbol (‘i’).
To use PPM for classification rather than com-pression, models M1, M2, ..., Mn are trained for
each discrete class. Then for a given textual sam-plet, choose the model that encodestin the least
number of bits. In reality the text is not com-pressed and the probabilities from the model are used to choose the model which best fits the text.
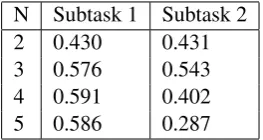
N Subtask 1 Subtask 2 2 0.430 0.431 3 0.576 0.543 4 0.591 0.402 5 0.586 0.287
Table 2: Performance of PPM models on the subtask dev sets using different values ofN.
For each labeled corpus, we trained PPM lan-guage models for distinguishing among the labels. This included each of the two subtasks, as well as the ADC and Twitter LID corpora that have a way to divide the instances into categories.
These models can either be used directly for their “native” task, or produce probabilities that may contain useful signal for a downstream task. Table 2 shows how the native models for each MADAR subtask perform with different values of maximal orderN on dev data.N = 4was best for Subtask 1, andN = 3was best for Subtask 2.
3.2 Word Embeddings
For the word-based neural models, we use 300-dimensional word embeddings trained on differ-ent amounts of data as input represdiffer-entations. First, we use randomly initialized embeddings. Then, we train fastText continuous bag of words (cbow) models with default parameters on the MADAR data (Bojanowski et al., 2017).3 Finally, we uti-lize additional data, training on MADAR in addi-tion to the datasets menaddi-tioned above (MADAR+). We provide final results (Macro-Average F1) from the ensemble model using each of these variants in Table3. We see that utilizing additional data pro-vided marginal performance gains, helping more in Subtask 2 where much of our additional data was also Twitter data, making it in-domain.
[image:2.595.351.483.112.182.2]Embedding Subtask 1 Subtask 2 Random 0.632 0.399 MADAR 0.626 0.397 MADAR+ 0.634 0.411
Table 3: Effect of different word embeddings, Macro-Average F1 for final ensemble models on dev
data.
[image:2.595.327.503.632.690.2]Padded sequence
Embedding
Con
v
olutions
Hidden
(a) CNNs over sequences
Embedding sequence
Bi-LSTM
Max
pool
Hidden
(b) RNNs over sequences
Distribution over label space
Hidden
[image:3.595.111.478.71.242.2](c) MLPs over distributions
Figure 1: The three basic types of submodels combined into the final ensemble, where the top layer is the input representation. They all produce the same-sized final hidden representation that can either be mapped directly to
the target value with a final linear layer (for individual training) or concatenated into an ensemble.
3.3 Ensemble Models
In what follows, all layers other than the final fully-connected input to softmax employ ReLU non-linearity.
We experimented with an ensemble model that combines submodels to extract signal from differ-ent features or incorporate information from non-neural methods. Figure1shows the three types of submodels: CNNs and RNNs over character and word sequences, and MLPs over probability distri-butions from language models and metadata. We integrate the metadata provided with Subtask 2 as additional distributions: the probabilities from the organizers’ 26-class model are incorporated the same way as LM scores, while the Twitter label is treated as a one-hot distribution and also incor-porated alongside the LM scores.
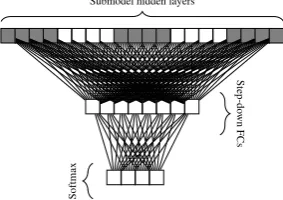
Each submodel, regardless of architecture, eventually produces a same-sized hidden repre-sentation, which are initially mapped to the target output via cross-entropy to train as an individual model. Once the submodels have converged, their parameters are frozen, their hidden layers are de-tached from the target output, and instead concate-nated into a single representation. This representa-tion is then the input to the shared ensemble archi-tecture, as shown in Figure2. Note that the “Step-down FCs” layer is actually composed of several fully-connected layers, each dividing the represen-tation size in half until it is one factor larger than the output label space.
Other specific choices for the models in this paper are: 100-dim char embeddings, char/word
CNN filter sizes 1,2,3,4,5, bidirectional 2-layer LSTMs with 32-dim states, and SGD with LR=0.1, momentum=0.9, patience of 10 for LR decay, early stop patience of 20, and minibatch size of 512.
Submodel hidden layers
Step-do
wn
FCs
[image:3.595.345.487.387.487.2]Softmax
Figure 2: The ensemble model concatenates the hidden representations produced by the submodels and
stacks one or more dense, non-linear layers, stepping down in size to a final softmax output over the label
space.
Due to a misreading of the task description, our models were designed to classify tweets individu-ally: this was handled at the submission deadline by taking a majority vote over each user’s tweets.
4 Results
Table4 reports the final precision, recall, and F1 scores for the best-performing model on each sub-task.
Subtask Model Prec Rec F1 Subtask 1 Ensemble 63.7 63.4 63.4 Subtask 2 PPM-3 74.9 46.5 54.3
Table 4: Precision, recall, and f-score of the best model for each subtask.
5 Discussion
Table 5 shows the final performance (Macro-Average F1) of the submodels of the ensemble on Subtask 1, before they were frozen, and the performance of the final ensemble model (which used the submodels). The modest 4-point im-provement of the ensemble over the PPM sub-model, and the fact that the Subtask 2 ensemble under-performed the PPM-3 model, suggests poor coordination of the representational power of the constituents. Distributions from language models trained on our other data sets unfortunately pro-vided no benefit under the ensemble, and were not included.
[image:4.595.328.511.64.220.2]Submodel F1 Score CNN 0.545 RNN 0.554 MLP-PPM 0.591 Ensemble 0.634
Table 5: F1 Scores of the submodels of the best ensemble for Subtask 1.
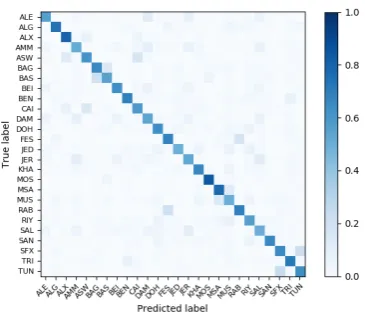
Figures3and4show the confusion matrices of the best models on Subtask 1 and 2, respectively. Our Task 1 misclassifications closely track those reported in (Salameh and Bouamor, 2018), e.g. TUN/SFX and BAS/BAG.
For Task 2, the preponderance of Saudi Ara-bian documents dominates the misclassifications, but also striking is how asymmetric the heatmap is compared to Subtask 1. This may largely be due to the small number of instances (half of the classes have counts in the single digits), but even better-represented pairs like Oman (14) and Iraq (10) are largely unidirectional, with Iraq much likelier to be misclassified as Oman than the reverse.
6 Conclusion
We experimented with a non-standard character language model (PPM) designed for classifying short text sequences, and an ensemble model that combined several neural architectures and input
Figure 3: Confusion matrix for the Subtask 1 dev set using an ensemble model with word embeddings and language model scores constructed from the full suite
of MADAR and external data sets
Figure 4: Confusion matrix for Subtask 2 dev set using a 3-gram PPM model constructed from the train set
features. The language model proved difficult to beat, even by ensembles that include the LM it-self: this under-performance indicates the ensem-bling is not optimally leveraging its inputs. Future work might focus on techniques for encouraging uncorrelated training, perhaps by sequential sub-model training that modifies the data as a function of previous submodel predictions.
References
Piotr Bojanowski, Edouard Grave, Armand Joulin, and Tomas Mikolov. 2017. Enriching word vectors with subword information. Transactions of the Associa-tion for ComputaAssocia-tional Linguistics, 5:135–146.
[image:4.595.325.513.302.459.2] [image:4.595.126.241.367.438.2]Fourth Arabic Natural Language Processing Work-shop (WANLP19), Florence, Italy.
John Cleary and Ian Witten. 1984. Data compression using adaptive coding and partial string matching.
Transactions on Communications, 32:396–402.
Eibe Frank, Chang Chui, and Ian Witten. 2000. Text categorization using compression models. In Pro-ceedings of the IEEE Data Compression Confer-ence, pages 200–209.
Paul McNamee. 2016. Language and Dialect Discrimi-nation Using Compression-Inspired Language Mod-els. Proceedings of the Third Workshop on NLP for Similar Languages, Varieties and Dialects.
Mohammad Salameh and Houda Bouamor. 2018. Fine-grained arabic dialect identification. In Pro-ceedings of the 27th International Conference on Computational Linguistics, pages 1332–1344.
Omar Zaidan and Chris Callison-Burch. 2011. The ara-bic online commentary dataset: an annotated dataset of informal arabic with high dialectal content. In