Research on Pilots Development Planning
Ruo Ding, Mingang Gao*
Institute of Policy and Management, Chinese Academy of Sciences, Beijing, China. Email: *[email protected]
Received October 25th, 2012; revised November 24th, 2012; accepted December 3rd, 2012
ABSTRACT
Pilot is one of the most important factors to ensure aviation safety. The article focuses on the Pilots Development Plan- ning (PDP) problem. It is different from other countries that pilots are developed by airways themselves in China. Pro- motion of every pilot needs specified quantity of flight experience hours which are accumulated in daily flights. In the same time, the promotion routes of pilots are diversified. So keys of PDP problem are to estimate the number of pilots who have promotion qualification in different planning period and to optimize their promotion and transfer in all routes. After analyzing characteristics of pilot training, a PDP road map is drawn which shows the typical process for pilots’ promotion and transfer. An optimization model which has promotion qualification constraints is built to solve PDP problem. According to different pilot development patterns, the method is proved to be effectively by a case study. The research has practical significance for Chinese airways.
Keywords: Aviation Safety; Pilots Development Planning; Promotion Qualification; Optimization Model
1. Introduction
It is urgent for Chinese civil aviation to train enough pi- lots in high-speed development period. It is either not easy to do so because airlines train pilots by themselves in China which is different from other countries. Based on the estimate of the future aviation market, airlines employ certain number of trainees from aviation acad- emy to meet the demand of future pilots. At the same time, pilots employed by airlines are arranged to different types of planes to accomplish flight tasks according to demand. When the pilots have enough accumulated flight experience, they can promote or transfer to other aircraft types. It takes about four to seven years for a typical trainee to become a qualified captain. The number of qualified captains is one of the most important kinds of resource which determine the flight safety and develop- ment of airlines.
In recent years, Chinese civil aviation industry devel- ops almost twice as fast as national economics. Fore- casted by Boeing, Chinese annual average passenger growth rate is 7.6% and China will become the second largest market of the world in next 20 years [1]. Along with the fast increasing fleet size, the problem of pilots’ resources shortage is always a burning question in civil aviation industry.
A scientifically reasonable plan of pilot development contributes to improve the operation economy and pro-
duction safety of airlines. The moment the trainees em- ployed by the airlines, the airlines have to spend a lot on the trainees’ training and operating. In case of pilot re- dundancy, the airlines will suffer from the increased fi- nancial burden and occupied fixed asserts. It influences airlines’ development. Since the number of captains is required by the demand of market oriented flight, when the increase of co-pilots exceeds that of flight, the pro- motion of co-pilots has to be slowed. And the delayed promotion of co-pilots may influence the motion of co- pilots, which leads to the loss of co-pilots or influence the safety of flight due to the motion impact [2,3]. Therefore, effective medium- and long-term pilot devel- opment plans is necessary due to not only the safety but also the development of airlines.
Vassiliou [4,5] has studied the foreign pilot training programming problem. By classified the pilots by their grade and discretizing the operating hour, and based on the hypothesis that the movement of different grades satisfy Markov quality [6] and statistics of history data, they established Markov analysis model. Georgiou et al.
[7] further revised and improved Markov analysis model. Markov analysis model is suitable for the pilot human resources prediction to promote with no special control. Gao et al. [8] has also proofed that when the distribution of the increase for accumulation of flight experience hours is fixed the promotion of pilots is a Markov pro- cess. In fact, flight experience hours are accumulated during production process. Its increasing is affected by
flight task, pilot-plane rate and the quality of task ar- rangement and is not always a fixed distribution.
In the field of pilot training planning, many scholars have done a lot based on optimization theory and system dynamics. Gao et al. [9] worked out the promotion esti- mate model in single type flight without considering the promotion indexes and the adjustment between fleets. Jia
et al. [10] studied the pilots programming problem and describe it as a network flow model.
In this article, characteristics of pilot training in China are analyzed and we study a mathematical programming with which we try to solve PDP problem. In Section 2, a PDP road map is drawn. An optimization model which has promotion qualification constraints is built in Section 3. A case study is present to demonstrate the effective- ness of the optimization method in section of this article. In the last part conclusions are drawn.
2. Pilots Development Planning Road Map
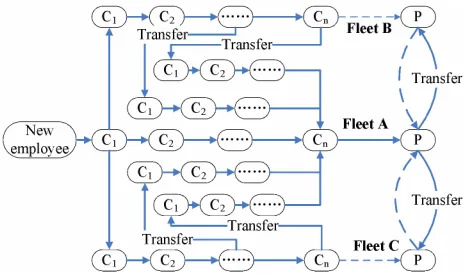
The process of a typical trainee to captain has been showed in Figure 1. After graduating from aviation aca-demy and employed by airline, trainees work on narrow- body fleet and transfer to wide-body fleet as co-pilot ca- pacity. All types of co-pilots work on their flight and pro- mote based on the accumulation of their operating hours. As for wide-body fleets, co-pilots could transfer to nar- row-body fleet to promote to captains. The more hours accumulated in wide-body fleet, the fewer hours it takes for a co-pilot gets the qualification. When necessary, co- pilots in wide-body fleets could promote to captain with- out transferring, while a higher accumulation of operat- ing hour is required.
In Figure 1, , means co-pilots with
grade i and P means captains in each fleet. Fleet A is narrow-body fleet and Fleets B and C are wide-body fleets. The solid lines stand for the normal promotion routes and pilots will not take the dashed routes unless they are allowed to do so by the decision maker.
, 1, 2, ,
i
C i n
[image:2.595.56.291.584.724.2]According to their demand every year in the future, captains are chosen from narrow-body aircrafts to be
Figure 1. Example of PDP road map.
trained and transferred to wide-body aircrafts. Then the demands of captains of all fleets are satisfied. The prior- ity levels of different fleet determine the route and num- ber of transferred pilots.
This research focuses on how to estimate the number of pilots who have promotion qualification and to opti- mize their promotion in all routes.
3. Modeling
In this part, a mathematical programming model is built to solve PDP problem.
3.1. Variable List
Set list:
I: The set of Fleets.
N: The set of co-pilots’ grades.
: The set of co-pilots who transferred from other fleets.
J: Years during planning period.
Variable list:
1, , , ,
n n i j
C : The number of co-pilots who transferred from Grade n of other fleets and will promote from grade
n− 1 to grade n in Fleet i during Year j. , , ,
n i h j
Cz : The total number of co-pilots who will trans- fer from Grade n of Fleet i to Fleet h in Year j.
, ,
i h j
Pz : The number of captains who will transfer from Fleet i to Fleet h in Year j.
,
i j
Pp : The gap of captains in Fleet i in Year j. , , , ,
ni j k
: The number of co-pilots who will transfer from k th interval of accumulated flight experience hours of Grade n to Fleet i in Year j.
, ,
i h j
gz : The number of co-pilots who have qualifica- tion to transfer from Fleet i to Fleet h in Year j.
Parameter list:
, ,
i n
a : The required accumulated flight experience hours for co-pilot with Grade n to promote in Fleet i.
,
n i u
,dn i, : The maximum and minimum estimated values of increase flight experience hours in one year for co-pilot with Grade n in Fleet i.
,
i n
Ad : The probability for co-pilot with Grade n to build dn i, flight experience hours in one year in Fleet
i. , 1,
n n i
Ra : The proportion of co-pilots who will pro- mote from Grade n to Grade n + 1 in all qualified co-pilots in Fleet i.
, ,
n i j: The cost for one co-pilot with Grade n to pro-
mote in Fleet i in Year j.
Vs
, , ,
n i h j: The cost for one co-pilot with Grade η to
transfer from Fleet i to Fleet h in Year j.
Vcz
, ,
i h j
Vpz : The cost for one captain to transfer from Fleet
i to Fleet h in Year j.
i
Vpp , : The penalty fee for one gap of captain and co-pilot.
,
i j
Rtp , : The numbers of retired captains and co-pilots. i j,
Rtc
, 1, ,
n n i j
Zg : The number of new co-pilots with grade n + 1 in Fleet i in Year j.
,
i h
: The minimum limit for co-pilots who will trans- fer from Fleet i to Fleet h every year.
,
i j
Dp , : The demands for captains and co-pilots in Fleet i in Year i j, j.
Dc
, ,i j
g : The number of co-pilots who have qualification
to promote to captains now. , , ,
n i j
Rc : The number of co-pilots with Grade n now who transferred from Grade ηin Fleet i in Year j.
,
i j Rp
fn, , , ,i j k: The number of captains in Fleet : The number of co-pilots in ik in Year th interval of j. accumulated flight experience hours with Grade n in Fleet n now who transferred from Grade ηin Year j.
,
i j
: The total number of pilots who will transfer to Fleet i in Year j.
3.2. Optimization Model
min
Vsn,i,jCn1,n,,i,j
Vczn.i.h.jCzn,i,h,j
Vpzi,h,jPzi,h,j
i,h
I&ih
i,h
I&ih
n
N iI
jJ
Vppi,jPpi,jVcpi,jCpi,j
iI
(1)
, , , , , ,, , , , 1, , , , , , , , , , , ,
, , , , , , , , 1, , , , , 1, , , , , , , , , , , 1,
0 0
1
1
n i
n i n i
n i i n
i n n i j k d n i h j k n i i n n i i n
h I i
n i j k i n n i j k u i n n i j k d n i h j k n i i n n i i n
h I i
i
k d a
Ad f d a k u a
l Ad f Ad f u a k d a
Ad
,, , , , 1, , , , , , , , 1, , , 1,
, , 1, 0
n i
n n i j k u n i h j k n i i n n i i n
h I i
n i i n
f d a
k u a
k u a
(2), , , , 1, , , , 1, , , , , , , , , , 1, , , , , , , , , , , 1, , 1,
0
n i j k n i j k n n i j n i j i n i n n i
n i j k n i j k i n n i i n
l l F a k a u
f l a u k a
k a
i n, , or k ai n, 1,
(3)
1, 1, , , , 1, , , , 1, , , 1, , , , , ,
1 1
ˆ
j j
n n i r n n i r n n i n n i r i i h j
r r
C C Ra Zg n n g gz
h I i
(4)
, , , , , 1 , , , , , , 1, , , 1, , , , ˆ , , ,
n i j n i j n i h j n i j n n i j n n i j i j i h j h I i
Rc Rc Cz C C n n Rtc gz
(5)The objective function (1) is to minimize the total cost which includes promotion costs, transfer costs and pen- alty fee for lack of captains. We adjust the priorities of co-pilots’ promotion by Vsn i j p, , , . For example, when
, , 1, , , ,
n i j p n i j p
Vs Vs , the promotion will be planned as later as possible.
, , 1
, 1
, 1, , , , , , , 1
n i i n
i n
a u
n n i j n i j k
k a Zg l
(6), , , , , 1, ˆ , ,
n i j n h i j k h i j
h I k
n n gz
(7)
, , , , , , , ˆ , ,
n i h j n i h j k i h j
k
Cz n n gz
(8) The step function (2) and (3) is used to estimate the accumulated flight experience hours for each co-pilot.With the promotion requirements, we can estimate the number of pilots who newly get the promotion qualifica- tion in different planning period by Formula (6).
, , , , , 1 ,
i h j n i j i h
n N
Cz Rc
, (9)Formula (4) constrains the number of co-pilots who will promote to captains and ensures the flight operation level for good-skill co-pilots.
, ,
i j i j i j
Rp Pp Dp (10)
, , , , , , + ,
n i j i j i j i j i j
n N
Rc Rp Pp Dp Dc
(11)Formulas (7) and (8) calculate the number of trans- ferred co-pilots and their grades. Formula (9) constrains the minimum number of co-pilots to transfer. It ensures
, , 1 , 1, , , , ,
i j i j n n i j i h j i j h I i
Rp Rp C Cz Rtc
co-pilots to promote to captains in the future.
Formulas (10) and (11) mean that pilots must meet their demands every year.
Formulas (5) and (12) are flow balance constraints for pilots.
4. Case Study
In order to demonstrate the effectiveness of the optimiza- tion model, a case with two scenarios according to simu- lated data of some airline company is studied in this sec- tion. Three fleets are present as Fleet A, B and C. Fleet A is a narrow-body fleet while the other two are wide-body fleets.
4.1. Scenario One
At the beginning of planning period, the staff in all fleets is shown in Table 1.
First of all, we consider a situation where all the fleets are increasing at 12 percent annually in the next five years in Chinese civil aviation industry. In this case, the future demands of captains and co-pilots are calculated and showed in Table 2.
Table 1. The staff in all fleets at the beginning of planning period.
The staff The number of
pilots Co-pilot Demand of
co-pilot Captain
Demand of captain
Fleet A 248 253 240 230
Fleet B 126 99 93 90
Fleet C 141 212 160 192
Table 2. The future demand of captains and co-pilots in all fleets.
The demand of co-pilots The demand of captains The demand of
pilots Fleet A Fleet B Fleet C Fleet A Fleet B Fleet C
Year 1 286 99 229 260 90 208
Year 2 319 110 256 290 100 232
Year 3 352 121 282 320 110 256
Year 4 391 132 308 355 120 280
Year 5 435 143 344 395 130 312
Based on the above input data, the programming mod- el is run by LINGO 9.0 which is a simple tool for utiliz- ing the power of linear and nonlinear optimization to formulate large problems. The main purpose of LINGO is to allow a user to quickly input a model formulation, solve it, assess the correctness or appropriateness of the formulation based on the solution, quickly make minor modifications to the formulation, and repeat the process. We get the results as follows.
Table 3 is the planned number of captains and its gap
in all years of planning period. Based on the estimated developing rate, the reserve of staff is insufficient at the beginning of planning period. Therefore, there is captain gap in the first three years, which is coincided with the fact. After the reasonable adjustment in the last two years, the supply and the demand of captain are balanced.
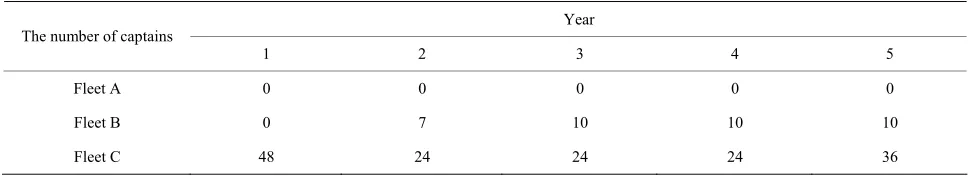
Table 4 is the adjustment of captains during planning
period.
Table 5 is the promotion of co-pilots in all years dur-
ing planning period. In the first three years, all qualified co-pilots promote to captains because the existence of captain insufficiency. In the last two years, only parts of co-pilots promote.
Table 6 shows the number of transferred copilots
every year. In the first three years, demand for captains is very large, so co-pilots more than the minimum number are recommended to participate transfer training so as to promote to captains in the future. In the last two years, the number of transferred co-pilots equals to the mini- mum number.
Table 7 shows the recommendations of enrolling new
employees during the planning period.
4.2. Scenario Two
Due to the development demand of Chinese civil aviation industry, some types of aircraft will retire in next few years. The pilots of retired aircraft will be arranged to other fleets according to the requirement. In response to this reality, we have designed a scenario: the scales of Fleets A and C are still developing by average annual rate of 12%, while Fleet B will complete retirement in the next five years.
Table 8 shows the demand of captains and co-pilots in
all types of aircraft in the next five years.
Table 3. The planned number of captains and its gap in all fleets.
Fleet A Fleet B Fleet C
The number of
captains The number of
captains The gap of captains The number of captains The gap of captains The number of captains The gap of captains
Year 1 255 5 93 −3 208 0
Year 2 258 32 100 0 232 0
Year 3 302 18 110 0 256 0
Year 4 355 0 120 0 280 0
Table 4. The planned number of captains transferred to every fleet.
Year The number of captains
1 2 3 4 5
Fleet A 0 0 0 0 0
Fleet B 0 7 10 10 10
Fleet C 48 24 24 24 36
Table 5. The number of co-pilots promote to captains in Fleet A.
Year The number of captains
1 2 3 4 5
Qualified 53 61 87 130 37
[image:5.595.58.539.310.431.2]Promoted 53 61 87 99 23
Table 6. The number of co-pilots which convert aircraft type in each year during planning period.
Fleet B Fleet C
The number of co-pilots The minimum number of transferred co-pilots
The planned number of transferred co-pilots
The minimum number of transferred co-pilots
The planned number of transferred co-pilots
Year 1 14 84 12 75
Year 2 10 10 10 23
Year 3 11 11 11 26
Year 4 12 12 28 28
Year 5 13 13 31 31
Table 7. Recruiting plan of new employees in each year of planning period.
Year The number of new employees
1 2 3 4 5
[image:5.595.55.538.537.652.2]Fleet A 171 95 147 163 173
Table 8. The future demand of captains and co-pilots in all fleets.
The demand of co-pilots The demand of captains The demand of pilots
Fleet A Fleet B Fleet C Fleet A Fleet B Fleet C
Year 1 286 99 229 260 90 208
Year 2 314 88 256 285 80 232
Year 3 341 66 282 310 60 256
Year 4 344 33 308 340 30 280
Year 5 407 0 344 370 0 312
We can get the following planning proposals by LINGO 9.0.
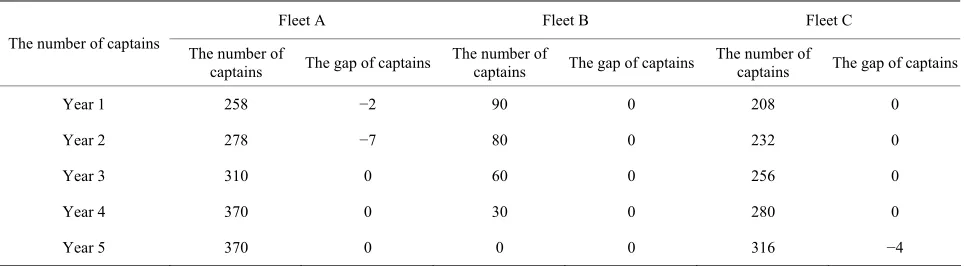
Tables 9 and 10 shows that along with the shrink of
Fleet B, its captains decrease year by year and can meet the demand. And the gaps of captains in the other fleets have also greatly reduced compared with Scenario one.
For Fleet C, the gap of captains is −4. It means that the number of captains is more than its demand in the last year of planning period because of receiving captains from Fleet B.
Table 11 shows that the demand for new employees is
Table 9. The planned number of captains and its gap in all fleets.
Fleet A Fleet B Fleet C
The number of captains The number of
captains The gap of captains
The number of
captains The gap of captains
The number of
captains The gap of captains
Year 1 258 −2 90 0 208 0
Year 2 278 −7 80 0 232 0
Year 3 310 0 60 0 256 0
Year 4 370 0 30 0 280 0
[image:6.595.98.496.264.349.2]Year 5 370 0 0 0 316 −4
Table 10. The planned number of captains transferred to every fleet.
Year The number of captains
1 2 3 4 5
Fleet A 0 0 0 0 0
Fleet B 0 0 0 0 0
Fleet C 48 24 24 24 36
Table 11. Recruiting plan of new employees in each year of planning period.
Year The number of new employees
1 2 3 4 5
Fleet A 162 78 67 50 68
the retirement of Fleet B.
In the above scenarios, the optimization method pre- sents reasonable and effective planning proposals. It has certain practical significance for Chinese civil aviation.
5. Conclusions
Chinese aviation industry is in its high-speed develop- ment period. Good pilots-develop plans are urgently needed for both flight safety and economic benefit. The article studies PDP problem by building an optimization model with which we estimate the number of pilots who have promotion qualification in different planning period and optimize their promotion and transfer in all routes. The model is an integer programming with promotion qualification constraints and its objective is to minimize the total cost which includes promotion costs, transfer costs and penalty fee for lack of captain.
The optimization method is demonstrated to be effec- tive by a case study with two different scenarios. It pro- vides a good theoretical support for human resource planning of Chinese airways.
The integer programming is solved by LINGO 9.0. In the future research, it may be replaced by a heuristic al- gorithm which may be more effective.
REFERENCES
[1] “Long-Term Market,” 2011.http://www.boeingchina.com/
[2] H. J. Wang, “Airline Pilot Selection and Management,”
China Civil Aviation, Vol. 124, 2011, pp. 15-18.
[3] H. Liang, “Crack’s Flow of Civil Aviation Pilots,” Hu-
man Resource, Vol. 7, 2008, pp. 68-69.
[4] P. C. G. Vassiliou, “Asymptotic Behavior of Markov Sys- tems,” Journal of Applied Probability, Vol. 19, No. 4, 1982, pp. 851-857. doi:10.2307/3213839
[5] P.-C. G. Vassiliou, “The Evolution of the Theory of Non- Homogeneous Markov Systems,” Applied Stochastic
Models and Data Analysis, Vol. 13, No. 3-4, 1997, pp.
159-176.
doi:10.1002/(SICI)1099-0747(199709/12)13:3/4<159::AI D-ASM309>3.0.CO;2-Q
[6] D. J. Bartholomew, A. F. Forbes and S. I. McClean, “Sta- tistical Techniques for Manpower Planning,” John Wiley & Sons, Hoboken, 1991.
[7] A. C. Georgiou and N. Tsantas, “Modelling Recruitment Training in Mathematical Human Resource Planning,”
Applied Stochastic Models in Business and Industry, Vol.
18, No. 1, 2002, pp. 53-74. doi:10.1002/asmb.454 [8] M. G. Gao and H. Chi, “Promotion Cycle Analysis of
Vol. 3, 2012, pp. 99-104.
[9] M. G. Gao, B. G. Xu, et al., “A Position Elevating Model for Pilot Training for Airways,” Proceedings of 2008 In- ternational Conference on Management Science and En-
gineering Management, Chongqing, 3-8 November 2008,
pp. 705-710.