Access to Graduate Education in Brazil:
predictors of choice and enrollment in
master’s degree programs
Colombo, Daniel Gama e
INEP (National Institute of Educational Research), Unieuro
University
8 October 2019
Online at
https://mpra.ub.uni-muenchen.de/96310/
enrollment in master’s degree programs
Daniel Gama e Colombo
1Abstract:
This paper presents an assessment of the factors associated with access to master’s degree programs in
Brazil, investigating whether there is evidence of inequity arising from students’ personal and
socioeconomic characteristics. A rich and novel dataset comprising microdata on undergraduate college
graduates and new master’s students is used for the empirical analysis. Students’ decisions to progress to graduate education are modeled as a two-stage process, and the parameters are estimated separately for each broad academic field using a conditional logit model for the first stage, and a logistic regression analysis for the second stage. The main findings are: (a) there is strong evidence of low mobility of students starting graduate education, and they are far more likely to choose a master’s degree program in the same
university or close to where they graduated from college; (b) academic performance and activities during undergraduate program in college are associated with an increase in the relative odds of progressing to graduate education; (c) in most broad academic fields, no evidence that women, black or brown students, economically disadvantaged students, foreigners and people with disabilities are less likely to start a
master’s program is found; and (d) a significant association between the odds of enrollment and parental education is not observed in nearly all fields. The study points to different recommendations and to further research questions to understand and improve graduate education in Brazil.
Keywords: Brazilian education; graduate education; inequity of access; conditional logit.
JEL Codes: C25; I23; I24.
1 Instituto Nacional de Estudos e Pesquisas Educacionais Anísio Teixeira (Inep), Brasília (DF), Brazil.
1Introduction
Master’s and Ph.D. programs in Brazil (the ‘stricto sensu’ graduate education, or just ‘graduate
education’)2 have experienced unprecedented growth in the last few decades. The number of master’s
degrees awarded in the country has increased by an average of approximately 7.5% annually between 2000 and 2017, surpassing the target of 60,000 degrees per year established by the National Education Plan3
seven years prior (CAPES 2017b). This expansion follows an international trend, as different nations (both developed and emerging) have also recently experienced substantial growth of these programs (OECD 2016). Nevertheless, little is known about factors that motivate and influence students to progress to graduate education in Brazil, and whether potential inequity problems exist that need to be addressed. The purpose of this paper is to provide insights into this topic by investigating the factors associated with
students’ choices and likelihood of entering a master’s program after receiving an undergraduate college degree.4
During the last few decades, different countries have experienced an unprecedented growth of graduate education, both in terms of student numbers and the diversification of programs (Nerad and Evans 2014; Walker et al. 2012). The main arguments suggested to explain this development are: ‘credential inflation’, or the increasing competition arising from the expansion of undergraduate education (Stuart et al. 2008); government support (Zarifa 2012); unemployment and economic fluctuations (Bedard and Herman 2008); and the risk of intergenerational downward social mobility (Mastekaasa 2006).
The expansion of graduate education, however, does not appear to have solved inequity and diversity problems in different countries. As noted by Harvey and Andrewartha (2013), inequalities do not
simply ‘wash out’ through the undergraduate level, and therefore socioeconomic, racial and gender features can substantially influence the composition of the graduate student body. For this reason, the promotion of equity has become an ‘increasingly prominent’ topic in higher education policies worldwide, and
2Graduate education in Brazil is divided into two groups: ‘stricto sensu’ graduate education comprises master’s and Ph.D. degree programs with an academic and scientific nature (even in the case professional
programs) that constitute part of the regular academic activities of an university; and the ‘lato sensu’
graduate education, with a clear practical approach and dedicated to professional training, and that awards a certificate, but not an academic degree (Sucupira 1965). Throughout this paper, the term ‘graduate education’ refers exclusively to the first group, i.e., master’s and Ph.D. programs.
3 Law 13,005, June 25th, 2014.
4 Based on different empirical studies cited throughout this paper (Bedard and Herman 2008; Harvey and
Andrewartha 2013; Perna 2004; Cole and Espinoza 2011), the term ‘college’ is used here to refer
governments are implementing a variety of measures to provide underrepresented groups more opportunities to earn a degree (Santiago et al. 2008).
In the context of tertiary education, equity can be interpreted as ‘fairness’, meaning that innate
abilities and individual study efforts should constitute the main criteria for accessing and benefiting from educational opportunities (Santiago et al. 2008; OECD 2017). According to this definition, personal circumstances and socioeconomic factors should not be an advantage or obstacle to anyone intending to pursue a higher education degree (OECD 2012). The main reasons for promoting equity and widening participation in graduate education presented in the literature include social justice, access to the widest
possible ‘talent pool’ of candidates, efficient allocation of research funding, social mobility and a reduction in inequalities (Wakeling and Kyriacou 2010; Santiago et al. 2008).
Despite the relevance of the subject, the empirical literature on access to graduate education remains sparse, although the existing evidence suggests that inequity of access exists in different countries (Perna 2004; Harvey and Andrewartha 2013). In Brazil, only a small group of studies discussed enrollment and participation in graduate education (CGEE 2016, 2010, 2012; Durso et al. 2016; Cirani et al. 2015; Artes 2016), and no quantitative analysis attempted to estimate how individual and socioeconomic features predict or are associated with the likelihood of enrollment for a large sample.
The main contribution of this paper is to fill this gap by presenting an econometric assessment of the predictors of participation of recent college graduates in master’s degree programs in Brazil. For this analysis, identified microdata from distinct sources were merged, generating a rich and novel database with
detailed information on Brazilian college graduates and new master’s students. The decision to begin graduate education is divided into two steps for analytical purposes (Long 2004; Skinner 2019). In the first stage, students choose the university and program that maximize their utility; afterwards, they decide whether to enroll, considering the likelihood of acceptance in the admission process. The first stage is estimated using a conditional logit model, while a binary logistic regression model is applied to the second stage (Greene 2011). Based on recent publications showing that graduate choice and returns are affected by major or academic field (Altonji et al. 2016; Mertens and Röbken 2013; Bedard and Herman 2008; Xu 2014), graduate enrollment is estimated separately for each of the eight ‘broad groups and academic fields’
of the International Standard Classification of Education (UNESCO 1997).
investigations; the third section examines the recent evolution of graduate education in Brazil; the fourth section describes the data and empirical strategy used for the analysis; and the fifth section presents and discusses the results in terms of both the literature and the Brazilian case. The sixth and last section summarizes the findings and suggests a future research agenda on the subject.
2The Literature on Access to Graduate Education
In the last few decades, a substantial body of empirical literature was developed to estimate how
different factors are associated with or affect students’ choices and enrollment in higher education (Skinner 2019; Long 2004; Bettinger and Long 2009; Perna 2006). The literature dedicated to access to graduate education, however, is not so extensive (English and Umbach 2016; Perna 2004; Wales 2013), as it has been developed recently, along with the international expansion of these programs.
Two theoretical frameworks have been commonly used as bases of these analyses. The sociological approach stresses the importance of the individual’s social and cultural capital (Bourdieu 1986; Bills 2003; Lin 2002). Within this framework, personal traits, academic ability and encouragement from
significant others influence students’ plans for their own education, thus affecting future decisions and educational attainment (Perna 2006; Paulsen 1990). According to these studies, inequity problems in education arise from distinct levels of cultural and social capital accumulation. However, researchers have not clearly determined whether these effects persist up to graduate education. Earlier studies argued that these factors impact students so strongly at previous educational levels that they become irrelevant for postbaccalaureate degrees (Mare 1980; Stolzenberg 1994). More recent research challenged this argument,
maintaining that master’s and Ph.D. degrees have become part of the social class and stratification structure
and thus are affected by family and social relations (Wakeling et al. 2009).
The human capital investment theory understands that schooling is similar to other types of investment, and the demand for education is modelled as a function of the costs and returns arising thereof. This theory is the standard and most frequently used approach in higher education choice studies (English and Umbach 2016; Paulsen and Toutkoushian 2008). A higher level of education increases workers’ human
features that potentially influence the benefits and returns of a graduate degree (Becker 1994, 1962; Heckman et al. 2018).
A recent group of studies attempted to combine both approaches by developing econometric models that employ the maximization decision process of human capital theory, but allowing tastes,
preferences and costs to be influenced by students’ values and ‘habitus’ (Perna 2004, 2006; Paulsen and John 2002; Xu 2014; Malcom and Dowd 2012; Paulsen and Toutkoushian 2008; English and Umbach 2016; Perna 2000). Students’ choices are analyzed in ‘situated contexts’, following a pattern dictated by
characteristics of both individuals and groups to which they belong.
The empirical literature on access to graduate education is mostly recent (Wakeling 2009), and nearly all empirical studies have analyzed graduate programs in the United States (U.S.) and United Kingdom (U.K.) (Bedard and Herman 2008; Cole and Espinoza 2011; English and Umbach 2016; Smith et al. 2010; Wakeling 2005), although a small number of papers considered other countries, such as Australia (Harvey and Andrewartha 2013), China (Kong 2011), Norway (Mastekaasa 2006) and Canada (Zarifa 2012). The few studies that investigated access to graduate education in Brazil have mainly presented descriptive statistics of aggregate data (CGEE 2016, 2010, 2012; Durso et al. 2016; Cirani et al. 2015; Artes 2016; Paixão et al. 2010; Rosemberg and Madsen 2011), and no quantitative analysis attempted to test and measure the associations of different factors with the likelihood of enrollment in graduate programs. Based on the few empirical studies that investigated programs in countries other than the U.S. and the U.K. (Harvey and Andrewartha 2013; Kong 2011; Mastekaasa 2006; Zarifa 2012), the findings of the international literature are used as a basis to compare and discuss the results presented herein.
Inequity in graduate education largely remains an open debate. Nevertheless, performance at the undergraduate level is generally accepted to be an important predictor of graduate enrollment in different countries (Heller 2001; Mullen et al. 2003; Zimdars 2007; Lang 1987; Zhang 2005; Xu 2014; Choy and Carroll 2000). The idea of equity as fairness discussed previously (OECD 2017; Santiago et al. 2008) suggests that it should be a key factor, as students that achieved better results during college are more likely
of personal and socioeconomic variables, thus ensuring that the direct effects of these factors can be assessed at the graduate level.
Quantitative analyses in the U.S., U.K. and Canada have found that women are less likely to attend graduate school (Wales 2013; Zarifa 2012; Zhang 2005; Millett 2003) or are less likely to be attracted to top-tier institutions (Montgomery 2002; Zhang 2005). Common explanations for these gaps are a lack of
parental support and role models, structural barriers, and, in some cases, an ‘unwelcoming pedagogy in
science’ (Sax 2001; Qian and Blair 1999). However, Perna (2004) argued that sex differences in enrollment may be caused by the indirect effects of other factors, as she did not find a significant association between gender and enrollment likelihood in the U.S. In a recent study, English and Umbach (2016) also did not find gender to be a significant predictor of enrollment in graduate education, and the authors interpreted this result as a sign of the potential closure of the educational gap between men and women at the graduate level in the U.S.
Race is also assessed as a potential factor that affects the relative odds of starting a graduate program, as nonwhite and racial or ethnic minority students are underrepresented in different countries, including Brazil (Wakeling and Kyriacou 2010; Perna 2004; Artes 2016; Malcom and Dowd 2012). However, the results reported in the literature generally do not support the claim of discrimination against these students. Most quantitative analyses did not find that racial/ethnic minority students are less likely to progress to graduate education (Perna 2004; English and Umbach 2016; Johnson 2013). In fact, when personal and socioeconomic features are controlled, these students have a higher likelihood of applying to and enrolling in a graduate programs in both the U.S. (English and Umbach 2016; Perna 2004; Millett 2003; Johnson 2013) and the U.K. (Wales 2013).
Family income and socioeconomic background affect the progression to graduate education through different channels, such as the availability of resources to finance a better and more selective education at previous levels, student loan debts, the formation of educational aspirations, and influence of
family educational background on children’s academic performance (Mullen et al. 2003). As a result, studies in different countries have found that students from wealthier families or with higher socioeconomic backgrounds are more likely to enroll in graduate programs (Wales 2013; Garibay et al. 2013; Wakeling 2005; Zarifa 2012; Zhang 2005).
age (Xu 2014; Choy and Carroll 2000); tuition fees (Wales 2013); quality, rank and other features of the undergraduate college (Zhang 2005; Lang 1987); business cycles (Johnson 2013; Bedard and Herman 2008); student debt (Malcom and Dowd 2012; Millett 2003; Choy and Carroll 2000); wages (Altonji et al. 2016); and risk aversion (Mastekaasa 2006).
The effects exerted by these factors may vary, depending not only on the country but also on the respective academic field. Returns arising from a graduate degree may be distinct (Mertens and Röbken 2013; Altonji et al. 2016), and students pursuing degrees in each field are likely to face different costs and have their own motivations and deterrents for enrollment. Cultural factors and the academic environment
may reinforce or undermine inequity issues, as suggested by the ‘leaky pipeline’ argument for the underrepresentation of women in some fields (Wakeling and Kyriacou 2010; Cole and Espinoza 2011). As an example, parental education and financial support from parents are more relevant predictors of graduate enrollment in STEM (science, technology, engineering and mathematics) fields in the U.S. (Xu 2014). Acknowledging that these differences may play an important role in graduate choice, the empirical strategy used in this study separates students into broad academic fields, as described in section 4.
3Brief Overview of and Recent Developments in Graduate Education in Brazil
The Brazilian experience with graduate education is fairly recent, as this educational level only started to experience a significant development in the 1970s (Brazilian Ministry of Education 1974). As these programs developed later than in other countries, Brazil was able to benefit from their models and experiences. The conceptual and normative framework of master’s and Ph.D. programs was substantially influenced by European and North American universities (Sucupira 1965); therefore, the regulation and definitions of these programs in Brazil closely follow the international practice (OECD 2018).5 Graduate
programs are considered part of higher education,6 and they award the highest available levels of academic degrees. Master’s and Ph.D. programs differ in terms of their duration, complexity and nature of the final piece of research.7Although a master’s degree does not constitute a formal requirement for starting a Ph.D.
5 The ISCED classification defines a master’s degree as a strong specialization level, with ‘advanced academic and/or professional knowledge’, while the doctoral level is ‘devoted to advanced study and original research’ (OECD 2018).
6 Law 9,394, of December 20th, 1996.
7A master’s dissertation must provide evidence of state-of-the-art knowledge of a subject, along with the
(Sucupira 1965), in practice, approximately all students in Brazil begin graduate education by enrolling in
a master’s program.
Since the mid-1970s, master’s and Ph.D. programs have gained relevance within the country’s educational system, and the government enacted the first ‘National Graduate Education Plan 1975-1979’
to assess the challenges for expansion and discuss the objectives of these programs in the country (Brazilian Ministry of Education 1974). By 1985, universities awarded approximately 4,000 master’s degrees annually, and ten years later, this figure had more than doubled (Brazilian Ministry of Education 2004). The expansion continued throughout the 1990s and thereafter, following the aforementioned international trend (Nerad and Evans 2014; Walker et al. 2012). The number of functioning graduate programs increased to approximately 4.5 thousand in 2016, with approximately 80 thousand degrees awarded annually (CAPES 2017b). Between 2000 and 2010,8the ratio of individuals with a master’s or a Ph.D. degree per thousand
residents in the country increased from 1.79 to 4.11 (IBGE 2000, 2010). Finally, as mentioned above, the
country met the target of the National Education Plan for number of master’s degrees awarded annually in
2017, when more than 61 thousand students earned their degrees in Brazilian universities.
Explaining the reasons and forces behind this growth is beyond the scope of this paper, but a summary of trends and facts will help the reader understand this development. First, most of the expansion occurred in public institutions. Although private universities have increased the number of graduate degrees awarded in the last few decades, they still represent less than 20% of the total degrees awarded in 2016 (CAPES 2017b). Another recent development is the creation and expansion of professional master’s
programs, that are designed to promote the collaboration between firms and universities, to facilitate the transfer of knowledge between these organizations, and to train professionals to meet the demands of both society and the market.9 In 2017, approximately 10 thousand students successfully completed a professional master’s degree, representing approximately 18% of all master’s degrees awarded by Brazilian universities
(CAPES 2017b).
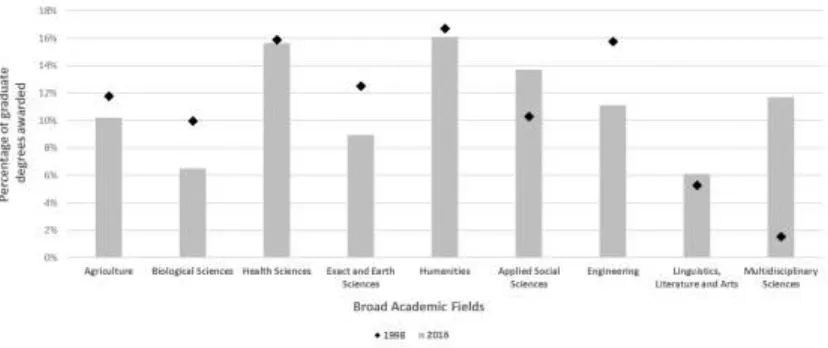
Virtually all fields of knowledge experienced an expansion of graduate programs, but the expansion was unevenly distributed. Thus, the balance between fields shifted considerably, as presented in Figure 1. However, the country followed a different path from most OECD nations: while STEM fields gained importance in these countries (OECD 2017), the broad fields of Engineering, Exact and Earth
8 Most recent available data.
Sciences have lost ground in Brazil, currently accounting for a smaller share of all graduate degrees than they did two decades ago. Applied social sciences and multidisciplinary programs, on the other hand, have grown more rapidly, and they currently award a greater proportion of master’s and Ph.D. degrees in the country per year than they did in the past (CAPES 2017b).
Fig 1 Percentage of graduate degrees (master’s and Ph.D.) awarded in 1998 and 2016 in each broad
academic field (according to the classification adopted by the Coordination for Improvement of Higher Education Personnel – CAPES 2017b) .
Graduate education is mostly regulated by CAPES (Coordination for Improvement of Higher Education Personnel), a government agency under the Ministry of Education. The agency is responsible for the development and administration of ‘National Graduate Education Plans’ (the current plan is valid for the 2011-2020 period – Brazilian Ministry of Education 2010) and most of the rules of the legal framework
governing master’s and Ph.D. programs in the country. The official evaluation of graduate programs
currently uses a four-year cycle, and it is based both on general guidelines (applicable to all programs) and on specific rules for each different academic field.10 The evaluation is mandatory for all programs, and each
program is graded by a committee of experts on a scale from one to seven points.
No strict mandatory rules and procedures are required for the admission of master’s students that are applicable to all programs in Brazil; therefore, universities and departments decide the design, timeline and criteria of the admission process for their programs. One of the few general rules on the subject state
10 Currently, the main legal documents that regulate the evaluation of graduate programs are Ordinances
[image:10.595.92.506.187.361.2]that proposals for new programs submitted to CAPES must clearly state the selection criteria for new students (without detailing what these criteria should include).11 The committee responsible for the
evaluation of each academic field can specify additional rules, but they usually only mention general principles and standards, such as transparency, equality of treatment, clear and objective criteria and a regular schedule (Brito et al. 2016; Gontijo et al. 2016). Universities and departments usually conduct their admission processes independently, and students must search and apply to each one separately. Common procedures used to select new students are exams; an assessment of a résumé, qualifications and past experience; presentation of a research project; and assessment of fluency in a foreign language (generally English).
The increase in the number of graduate degrees has allowed other challenges and problems to emerge in the national debate on graduate education, including issues of diversity and inequity of access. These topics have been discussed in studies that generally have observed signs of inequality by comparing graduate students with other population groups (mostly undergraduate college students and the country’s
general population), maintaining that progression to master’s and Ph.D. programs is restricted or more challenging to some students because of race, sex, geographic location and other factors (CGEE 2016, 2010, 2012; Durso et al. 2016; Cirani et al. 2015; Artes 2016; Paixão et al. 2010; Rosemberg and Madsen 2011). However, no quantitative model-based evidence on the subject has been presented to date. The only exception (Durso et al. 2016) is restricted to a small sample of accounting and economics students from a single institution, and focused on motivational factors. The empirical analysis described in the next sections contributes to this debate by presenting a quantitative analysis of the Brazilian case, adding to the international literature discussed in section 2.
4Empirical Strategy and Data
This quantitative analysis aims to empirically assess the associations of different factors with the decisions and choices of recent college graduates to pursue graduate education. Using the idea of equity as fairness (Santiago et al. 2008; OECD 2012), the main goal is to investigate whether personal and
socioeconomic features are significant predictors of access to and choice of master’s degree programs in
Brazil. A statistically significant parameter of these variables (using appropriate controls) is interpreted here as evidence of inequity, as it indicates that these factors are associated with a change in the relative
odds of enrollment, although they do not directly represent students’ abilities or effort. A 95% confidence
interval is used to assess the statistical significance of the parameters.
Theoretical models dedicated to higher education choices usually divide decisions into multiple stages, based on the complexity and competitiveness in this market (Paulsen 1990; DesJardins et al. 2006; Furquim and Glasener 2017). Due to data availability, this analysis considers only two steps (‘choice between programs’ and ‘decision on whether to enroll’), according to the empirical model suggested by Long (2004) and Skinner (2019). After completing undergraduate education, a student can either enter the
labor market full time or continue studying to earn a master’s degree. In order to make this decision, he or she compares the expected lifetime utility of each option by weighing the costs of studying (tuition fees and foregone earnings) and expected payoffs of a graduate degree (increase in life-time earnings, knowledge and skills) and considering non-monetary factors, such as the prestige of the institution, distance from his or her current location, time and effort. Students are assumed to maximize their expected utility, and the choices individuals in the sample actually made provide the basis to estimate the probability that each single option is chosen(Greene 2011). The model presents two stages, as students first choose the graduate program that provides highest utility and then compare it with the option of not pursuing graduate
education. The costs and returns of a master’s program are expected to vary according to the respective
academic field, and, for this reason, probabilistic models are estimated separately for each ‘broad group or academic field’ (UNESCO 1997).
4.1Estimation Strategy
4.1.1 First stage: choice between master’s programs
At the first stage of the decision-making process, each college graduate is faced with a complete,
discrete and known set of available master’s programs, and he or she decides on one that maximizes his or her expected utility. A probabilistic model is used to assess the influence of different factors on this decision, assuming that prospective students search and choose among all graduate programs within one
‘knowledge subfield’ (CAPES 2017c).12
Students’ choices at this stage are driven by the features and attributes of each graduate program,
along with ‘student-program’ interaction terms. For this reason, the estimation strategy follows Long (2004)
12 A subfield (or sub-level) is defined by CAPES as a partition of each knowledge field based on the object
of study or methodological procedures (CAPES 2017c). For the estimation, I use the subfield of the master’s
and Skinner (2019), applying a conditional logit or the McFadden’s discrete choice model (Greene 2011; McFadden 1973). This estimator uses a similar likelihood function of the multinomial logit model, but does not include invariant individual-specific attributes, as they are differenced out of the estimation equation. This method is particularly suitable for choices when the option set is discrete and known, as is the case for a prospective student searching and choosing among a known group of potential programs (Skinner 2019). Additionally, the conditional logit model is considered a more appropriate estimator when the individual is faced with a great number of potential alternatives, as it exploits the variation across attributes and accounts for interaction terms (Long 2004).
In the conditional logit framework, an individual i chooses a graduate program j (j = 1, 2, …, J)
based on a vector of attributes Xi that vary across the alternatives for each individual, regardless of whether
they represent specific features of the program or interaction terms. The probability (P) that a randomly
drawn prospective student i chooses a graduate program j (choicei = j) with attributes xij is (Greene 2011):
𝑃𝑖𝑗 = Prob(𝑐ℎ𝑜𝑖𝑐𝑒𝑖= 𝑗|𝑋𝑖) = 𝑒𝑥𝑝(𝛽 ′𝑥
𝑖𝑗)
∑𝐽𝑘=1exp(𝛽′𝑥𝑖𝑘)
(1)
where Xi comprises the variables described in Table 1 below. The β parameters in Equation 1
inform how program attributes and interaction terms are associated with the likelihood of a student choosing a particular program. Data from college graduates who actually progressed to a master’s program are used
to estimate the values and statistical significance of the parameters. The dataset is expanded to cover all possible pairwise combinations of every student i and all potential master’s programs j that he or she could
choose (within the respective knowledge subfield), and thus each observation represents a ‘student
-program’ pair. A dummy variable (choicei) constitutes the dependent variable of the probabilistic model,
and it is assigned a value of one for the program in which the student actually enrolled and zero for all other programs.
of bus travel (McFadden 1973), although this example is dismissed by Train (2003) as unrealistic and unlikely to occur in serious research design.
Unfortunately, tests of violations of the IIA assumption (Hausman and McFadden 1984) have been reported to be unsatisfactory and produce inconsistent results for applied research (Cheng and Long 2007). However, sufficient reasons exist to maintain that the IIA assumption should not pose a threat of bias to this analysis, as argued by Skinner (2019) in his study of college choice in the U.S. First, the completeness of the choice set prevents a threat of bias caused by the possible omission of a relevant option, and it is ensured here by including all potential options for each student in the dataset (a ‘student-program’ pair). Second, the independence of the admission processes of graduate programs in Brazil (as discussed in section 3) avoids that the relative odds of choosing between two programs is affected by the availability (or not) of a third one. Third, the specific features of each master’s program (e.g., location, faculty, infrastructure and research agenda) minimize the problem of ‘close substitutes’, as each program clearly represents a distinct option to the prospective student.
4.1.2Second stage: decision on whether to enroll
In the second stage, the prospectivestudent i decides whether to progress to graduate education.
This stage encompasses not only the decision but also the programs’ application and admission processes,
as data on these procedures are not available. This research strategy is based on the argument that students are aware of the competitive nature of admission processes and tend to apply to institutions where people with similar characteristics and levels of achievement study to increase their probability of acceptance (DesJardins et al. 2006). One of the few empirical studies that considered ‘application’ and ‘attendance conditional on application’ provide support to this research strategy, as it found that parameters in probabilistic models for both outcomes were ‘remarkably similar in direction, size and significance’
(Skinner 2019).
The graduate program that a student views as his or her best option is expected to affect the expected utility, impacting the decision to enroll. The estimation of this stage must consider the choice between programs made by college graduates in the previous step to account for these factors. As the choice of those students that did not progress to a master’s program is unknown, each college graduate i in the
parameters and the specification of the first stage)13, which is considered his or her ‘most likely’ master’s
program. In the case of actual master’s students, the ‘most likely’ program may not be the one in which he or she actually enrolled.
For estimation, the response variable of this stage is a dummy that indicates whether student i
actually progressed to graduate education in any master’s program (enrollmenti = 1) or not (enrollmenti =
0). Considering the categorical and binary nature of the dependent variable, a standard logistic regression
analysis is used to estimate the associations of different factors with the likelihood of the outcome. The conditional probability that student i with a ‘most likely’ program j decides to enroll in a master’s program
is (Greene 2011):
Prob(𝑒𝑛𝑟𝑜𝑙𝑙𝑚𝑒𝑛𝑡𝑖= 1|𝑐ℎ𝑜𝑖𝑐𝑒𝑖= 𝑗, 𝑧𝑖𝑗) = 𝑒𝑥𝑝(𝛽 ′𝑧
𝑖𝑗)
1 + exp(𝛽′𝑧𝑖𝑗) (2)
where zijis the vector of covariates assumed to affect students’ decision at this stage, i.e., academic
performance and activities during college, features of the undergraduate program, personal traits, race, socioeconomic factors, parental education, features of the ‘most likely’ master’s program, and student-program interaction terms. The complete list of all covariates and their descriptive statistics are presented in Tables 1 and 2 below.
4.2Data and Descriptive Statistics
Nearly all empirical studies mentioned in the literature review used student-level data to assess the likelihood of enrollment in graduate education. Based on these studies, this analysis uses confidential microdata from (a) Brazilian college students who graduated between 2010 and 2012 and (b) students who
started a master’s degree program between 2011 and 2016, as progress to graduate education is only
considered for up to four years after college (available data suggest that this strategy accounts for more than
80% of new master’s students – Colombo 2018). The estimation of the first stage considers all new master’s students in the sample, and, for the second stage, the estimation is limited to college graduates who have
taken the National Students’ Performance Exam (ENADE),14 regardless of whether they progressed to
graduate education.
The constraint for the second stage is necessary because the ENADE database is the source of
information on undergraduate performance and students’ personal and socioeconomic features. The
ENADE is part of the National System of Higher Education Evaluation (SINAES) that evaluates a number of academic fields every year, based on their pedagogical program, teaching staff and infrastructure (INEP 2016b). The entire cycle lasts three years, and, within this period, undergraduate programs in all fields are evaluated and receive a score from one to five points. The 2010-2012 period was chosen to ensure that students from all fields are included in the sample.
All students expecting to graduate in a field to be evaluated that year must take the ENADE exam and complete the ‘Students’ Questionnaire’, which contains information on family background, socioeconomic status and experiences during undergraduate college. The test comprises a section of general knowledge and a section containing questions specific to the student’s academic field (INEP 2016b). Students who took the same test (i.e., students from the same program evaluation field who took the test in the same year) were grouped and their grades were standardized using a z-score, to ensure that grades were comparable for the analysis (Urdan 2016).
Three databases are merged for this analysis, providing a rich and novel dataset designed to
analyze access to graduate education in the country: (a) the ‘Higher Education Census’ (INEP 2017a) provides the identification and information (sex, race, nationality and age) on students graduating from an undergraduate college between 2010 and 2012; (b) the ENADE and the ‘Students’Questionnaire’ database from 2009 to 2012 (INEP 2017b) (only students present in both databases are considered); and (c) the record of all students who enrolled in a master’s program between 2011 and 2016 (CAPES 2017b).
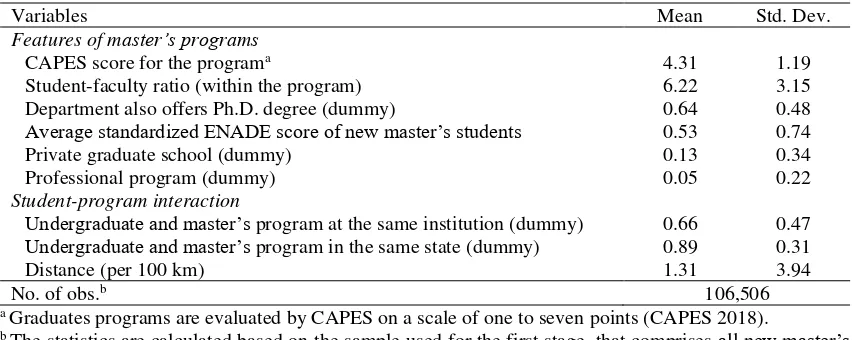
Independent variables used for the estimation of the first stage (choice between graduate programs)
are presented in Table 1. The excellence or quality of the master’s program is proxied by its score in the CAPES (2018) evaluation system. Dummy variables indicate private institutions, professional programs and whether the department also offers a Ph.D. program (in addition to the master’s degree). The student-faculty ratio is also included as a relevant feature of the program, and the average score of its new students at the ENADE exam represents a measure of competition of the admission process. Interaction variables
14‘Exame Nacional de Desempenho de Estudantes’ (INEP 2017b). More than 90% of the students in the
sample took the ENADE exam and completed the ‘Students’ Questionnaire’ up to one year after graduation,
between the student and the respective graduate program are: dummies that inform whether the program is held at the same university or in the same state where the student obtained his or her undergraduate degree; and distance from the city where he or she went to college. Descriptive statistics displayed in Table 1 are calculated based on the sample used for estimation of the first stage.
Table 1 Descriptive statistics of variables related to features of master’s programs and student-program
interaction terms
Variables Mean Std. Dev.
Features of master’s programs
CAPES score for the programa 4.31 1.19
Student-faculty ratio (within the program) 6.22 3.15 Department also offers Ph.D. degree (dummy) 0.64 0.48
Average standardized ENADE score of new master’s students 0.53 0.74 Private graduate school (dummy) 0.13 0.34 Professional program (dummy) 0.05 0.22
Student-program interaction
Undergraduate and master’s program at the same institution (dummy) 0.66 0.47
Undergraduate and master’s program in the same state (dummy) 0.89 0.31 Distance (per 100 km) 1.31 3.94
No. of obs.b 106,506
a Graduates programs are evaluated by CAPES on a scale of one to seven points (CAPES 2018).
b The statistics are calculated based on the sample used for the first stage, that comprises all new master’s
students in the dataset who graduated between 2010 and 2012, regardless of whether they have taken the ENADE exam. For this reason, the number of observations in this table exceeds the number presented in
Table 2 for new master’s students, which only considers students who have taken the exam and for whom information on the score and on personal and socioeconomic factors are available.
Table 2 Descriptive statistics of variables related to features of students and of their undergraduate
programs
Variables
Full sample of college
graduates graduates who enrolled Sample of college in a master’s program Mean Std. Dev. Mean Std. Dev.
Enrollment in master’s program 0.05 0.22 1.00 0.00
Undergraduate performance and activities
Standardized ENADE score 0.03 0.99 0.58 1.02 Teaching assistant during college (dummy) 0.28 0.45 0.43 0.50 Research activities during college (dummy) 0.40 0.49 0.71 0.45 Extension activities during college (dummy) 0.41 0.49 0.54 0.50
Undergraduate program features
SINAES score for the program 2.45 0.69 3.03 0.68 Private college (dummy) 0.83 0.38 0.31 0.46 Night shift program (dummy) 0.67 0.47 0.28 0.45
Personal traits
Female student (dummy) 0.61 0.49 0.56 0.50 Student with disability (dummy) 0.00 0.05 0.00 0.06 Foreign student (dummy) 0.00 0.04 0.00 0.04 Age 27.41 7.10 24.44 4.23
Race(dummies)
Black or brown student 0.11 0.31 0.11 0.31 Asian student 0.01 0.10 0.01 0.10 Indigenous student 0.00 0.03 0.00 0.04
Socioeconomic factors
Per capita family incomea 2.26 2.78 2.68 3.24
Student funding (dummy) 0.28 0.45 0.13 0.33 Working student (dummy) 0.58 0.49 0.27 0.44
Parental education (dummies for highest educational level)b
Father: primary education 0.29 0.45 0.18 0.38 Father: lower secondary education 0.14 0.35 0.12 0.32 Father: upper secondary education 0.29 0.46 0.33 0.47 Father: undergraduate education 0.17 0.37 0.25 0.43 Father: graduate education 0.06 0.24 0.11 0.31 Mother: primary education 0.25 0.43 0.13 0.34 Mother: lower secondary education 0.14 0.35 0.11 0.31 Mother: upper secondary education 0.32 0.46 0.34 0.47 Mother: undergraduate education 0.17 0.38 0.27 0.44 Mother: graduate education 0.08 0.27 0.15 0.35 No. of obs.c 388,800 19,979
a Variable based on students’ responses in the ENADE questionnaire survey and measured as the number
of minimum wages.
b According to the ISCED classification (OECD 2018).
c The statistics are calculated based on the sample of college graduates who have taken the exam and for
whom information on the score and on personal and socioeconomic factors from the ‘Students’
Questionnaire’ are available.
Sources: INEP (2016a), INEP (2017a) and INEP (2017b) (confidential information).
In the second stage (decision on whether to enroll), specific features of college graduates and their
undergraduate schools are considered along with variables of the ‘most likely’ graduate program used in
the first stage. Academic performance and activities during college are measured using the student’s
performed teaching assistant, research or extension activities. The SINAES score (ranging from one to five points) for the undergraduate program is used as a measure of its quality, and dummies for private
institutions and night shift programs are also included. Students’ personal traits that are assumed to affect
students’ decisions are sex, disability15 and nationality (indicated through dummy variables), age (at the
time of college graduation), and race16 (indicated through dummy variables for black or brown,17 Asian and
indigenous students). Socioeconomic factors included in the model are estimated family per capita income,18 dummies indicating whether he or she received student funding during college (whether through
grants, loans or other sources), whether the student was working at the time of college graduation, and parental education (also represented through dummy variables). Descriptive summary statistics of these variables are presented in Table 2, which only considers students who have taken the ENADE exam and for whom information on the score and on personal and socioeconomic factors from the ‘Students’ Questionnaire’ are available. For comparison purposes, Table 2 also presents the descriptive statistics for the subset of college graduates who also enrolled in a master’s program.
5Results of the Empirical Analysis
The estimated parameters for the first stage in all broad academic groups are presented in Table 3. They are reported as odds ratios, that are interpreted as the extent to which a unit increase in the respective independent variable is associated with a modification in the odds of a college graduate choosing a specific
master’s program, holding all other variables constant (the odds increase if the estimated odds ratio is greater than one, and decrease if it is less than one).
Based on the results, in all broad fields the institution where the student graduated from college and the distance from its location are the most important predictors of the choice between programs.
15 This variable indicates whether the student was reported to present any disability or developmental
disorder in the Higher Education Census (INEP 2017a).
16 The racial classification adopted by INEP is the one that has been used by IBGE since the 2000 National
Census (INEP 2005). It uses the heading ‘color or race’ (‘cor ou raça’) and comprises five categories based on racial self-identification: white (‘branca’), black (‘preto’), Asian (‘amarelo’), and indigenous (indígena)
(IBGE 2016).
17It is a common practice among Brazilian researchers to consider ‘black’ and ‘brown’ individuals jointly under a single category ‘black’ (negro), because of the similar socioeconomic features and discrimination
faced by these groups (Osorio 2013, 2003).
18Variable based on students’ responses in the ENADE questionnaire survey and measured as the number of minimum wages. The ‘estimated family income’ is the (unweighted) median of the range group informed
by the student (lower bound plus upper bound divided by two), except for the last option ‘income above 30 minimum wages’, in which case the lower bound (30) is used. This value is divided by the number of
Students are far more likely to try to attain a master’s degree in the same university or in a university located close to where they studied previously. The odds of choosing a graduate program at the same institution are at least seven times greater than choosing a program at another institution (in the ‘Services’ broad
group). This variable is a particularly important predictor in the ‘Agriculture and Veterinary’ and ‘Health and Welfare’ broad groups, as their students are more than 20 times more likely to choose a master’s
program at the same institution. The likelihood of choosing a program located in the same state as the undergraduate college is also significantly increased, as the relative odds increase from four to 15 times,
depending on the broad academic group. Similarly, students seem to prefer master’s programs located close to where they studied previously, as the likelihood of choosing a program decreases approximately 10% to 20% (depending on the broad field) for each one hundred kilometer increase in distance from their undergraduate college location.
Excellence of both the master’s program and of its students is also related to this choice, but to a lesser extent. According to the estimates, students from six academic broad groups are 1.07 to 1.3 times more likely to choose a graduate program for each additional point it achieves on the CAPES’ evaluation scale (no significant association is observed for the ‘Services’ and ‘Humanities and Arts’ broad groups).
On the other hand, students in all broad academic fields are more likely to choose programs with a higher student-faculty ratio, but the relative odds only increase 1.06 to 1.18 for each additional unit. Finally, the fact that the respective department also awards Ph.D. degrees does not appear to be associated with the
choices of master’s programs by students in nearly all fields, with the exception of the ‘Science, Mathematics and Computing’ (relative odds increase by 13%) and ‘Engineering, Manufacturing and
Construction’ (relative odds decrease by 14%). These two broad fields are also the only fields in which the
(dummy variable for chosen master’s degree program).
Variables
Broad Group or Academic Fielda
Education Humanities and Arts Social Sciences, Business and Law Science, Mathematics and Computing Engineering, Manufacturing and Construction Agriculture and Veterinary Health and Welfare Services
Features of master’s program
CAPES score for the program 1.11*** 1.11** 1.12*** 1.29*** 1.43*** 1.07** 1.15*** 0.97
(0.02) (0.04) (0.02) (0.02) (0.02) (0.02) (0.02) (0.08)
Student-faculty ratio (within the program)
1.06*** 1.09*** 1.11*** 1.08*** 1.07*** 1.08*** 1.09*** 1.18***
(0.00) (0.02) (0.01) (0.01) (0.01) (0.01) (0.01) (0.03)
Department also offers Ph.D. degree (dummy)
1.01 1.20 0.96 1.13** 0.86*** 1.09 1.05 0.80
(0.03) (0.12) (0.05) (0.05) (0.04) (0.06) (0.05) (0.15)
Average standardized ENADE score
of new master’s students 1.02 0.94 0.98 0.91
*** 0.95** 0.99 1.05* 1.00
(0.01) (0.03) (0.02) (0.02) (0.02) (0.03) (0.02) (0.07)
Private graduate school (dummy) 0.65*** 0.70*** 0.61*** 0.59*** 0.72*** 0.71*** 0.85*** 0.64**
(0.02) (0.07) (0.02) (0.03) (0.03) (0.05) (0.04) (0.11)
Professional program (dummy) 0.86* 1.10 1.06 0.74*** 1.34*** 0.87 1.29*** 0.88
(0.05) (0.20) (0.06) (0.05) (0.07) (0.10) (0.08) (0.19)
Student-program interaction
Undergraduate and master’s program at the same institution (dummy)
17.44*** 18.41*** 13.12*** 16.23*** 15.74*** 23.37*** 35.08*** 7.47***
(0.56) (1.44) (0.54) (0.62) (0.58) (1.18) (1.84) (1.28)
Undergraduate and master’s program in the same state (dummy)
6.96*** 10.51*** 9.53*** 8.48*** 8.86*** 4.05*** 7.25*** 15.39***
(0.31) (1.30) (0.55) (0.43) (0.43) (0.25) (0.50) (3.66)
Distance (per 100 km) 0.79*** 0.89*** 0.84*** 0.83*** 0.85*** 0.82*** 0.79*** 0.84***
(0.01) (0.01) (0.01) (0.01) (0.01) (0.01) (0.01) (0.03)
Chi-squared 26,997.15 4,341.47 12,743.17 16,961.00 17,319.84 12,732.60 11,027.28 752.87
Prob > chi2 0.00 0.00 0.00 0.00 0.00 0.00 0.00 0.00
Log pseudolikelihood -21,422.62 -2,717.11 -11,507.06 -14,697.49 -14,751.93 -10,133.24 -10,265.51 -727.56
Pseudo R2 0.70 0.70 0.65 0.67 0.66 0.69 0.75 0.63
No. of obs. 815,247 92,214 306,906 439,821 416,882 414,552 390,259 19,127
a According to the classification of UNESCO (1997).
Progress to graduate education is only considered up to four years after college graduation. Odds ratios are reported. Robust standard errors in parentheses. *p <
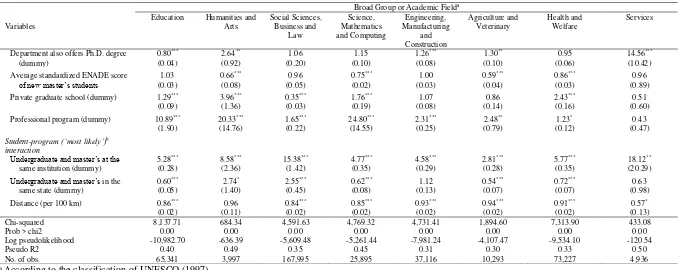
[image:21.842.89.750.111.414.2]enrolling in any master’s degree program).
Variables
Broad Group or Academic Fielda
Education Humanities and Arts Social Sciences, Business and Law Science, Mathematics and Computing Engineering, Manufacturing and Construction Agriculture and Veterinary Health and Welfare Services
Undergraduate performance and activities
Standardized ENADE score 1.36*** 1.31*** 1.61*** 1.50*** 1.33*** 1.49*** 1.68*** 2.28**
(0.03) (0.10) (0.05) (0.04) (0.03) (0.05) (0.04) (0.57)
Teaching assistant during college (dummy)
1.49*** 1.04 1.30*** 1.48*** 1.23*** 1.39*** 1.29*** 1.94
(0.06) (0.18) (0.10) (0.08) (0.06) (0.08) (0.05) (1.06)
Research activities during college (dummy)
3.58*** 5.40*** 1.90*** 3.42*** 3.64*** 4.71*** 3.32*** 0.31*
(0.15) (0.85) (0.13) (0.20) (0.16) (0.29) (0.15) (0.18)
Extension activities during college
(dummy) 1.32
*** 0.98 1.63*** 1.26*** 1.19*** 0.95 1.30*** 1.40
(0.05) (0.15) (0.11) (0.07) (0.06) (0.05) (0.06) (0.83)
Undergraduate program features
Undergraduate program’s SINAES’ score for the program
1.46*** 1.51*** 1.66*** 0.99 1.08* 1.08 1.33*** 1.37
(0.05) (0.16) (0.07) (0.04) (0.04) (0.06) (0.06) (0.81)
Private college (dummy) 0.26*** 0.21*** 0.40*** 0.41*** 0.53*** 0.29*** 0.46*** 0.06***
(0.01) (0.06) (0.04) (0.03) (0.03) (0.03) (0.03) (0.04)
Night shift program (dummy) 0.86*** 1.23 0.73*** 0.56*** 0.68*** 0.25*** 0.84** 3.62
(0.03) (0.21) (0.05) (0.04) (0.04) (0.07) (0.05) (2.40)
Personal traits
Female student (dummy) 0.48*** 0.85 0.91 1.21*** 1.18*** 1.62*** 1.11* 0.94
(0.02) (0.13) (0.05) (0.07) (0.05) (0.09) (0.05) (0.37)
Student with disability (dummy) 1.22 0.56 2.15 1.01 0.42 1.24 0.66 1.00
(0.35) (0.41) (0.88) (0.33) (0.24) (0.47) (0.26) (.)
Foreign student (dummy) 1.32 1.00 2.62 1.14 0.69 1.69 1.21 1.00
(0.97) (.) (1.42) (0.51) (0.31) (1.14) (0.53) (.)
Age 0.93*** 0.99 0.98** 0.94*** 0.95*** 0.95*** 0.93*** 1.00
(0.00) (0.01) (0.01) (0.01) (0.01) (0.01) (0.01) (0.03)
Race (dummies)
Black or brown student 0.98 0.98 1.13 0.95 1.25** 1.18 1.21** 0.41
(0.05) (0.25) (0.12) (0.08) (0.09) (0.11) (0.09) (0.42)
Asian student 1.28 1.53 0.73 0.68 0.68* 1.29 1.03 1.00
(0.25) (0.62) (0.28) (0.18) (0.11) (0.31) (0.20) (5.24)
Indigenous student 1.85 3.77 1.00 0.74 0.60 1.00 2.34 1.00
[image:22.842.94.760.109.513.2]Variables
Broad Group or Academic Fielda
Education Humanities and Arts Social Sciences, Business and Law Science, Mathematics and Computing Engineering, Manufacturing and Construction Agriculture and Veterinary Health and Welfare Services Socioeconomic factors
Per capita family income 1.06*** 1.01 1.05*** 0.98 0.98* 0.97** 0.99 0.85
(0.01) (0.02) (0.01) (0.01) (0.01) (0.01) (0.01) (0.11)
Student funding (dummy) 1.24*** 1.13 1.08 1.07 1.12 1.17 1.07 1.49
(0.07) (0.27) (0.07) (0.08) (0.07) (0.14) (0.06) (0.81)
Working student (dummy) 0.47*** 0.82 0.63*** 0.41*** 0.67*** 0.81* 0.91 0.60
(0.02) (0.13) (0.04) (0.02) (0.03) (0.07) (0.05) (0.27)
Parental education (dummies for highest educational level)
Father: primary education 1.05 2.32 1.27 1.00 0.85 0.98 1.28 1.28
(0.09) (1.12) (0.32) (0.21) (0.18) (0.19) (0.22) (1.03)
Father: lower secondary education 1.15 2.79* 1.08 1.10 0.69 0.86 1.24 1.13
(0.11) (1.41) (0.29) (0.24) (0.15) (0.18) (0.22) (0.79)
Father: upper secondary education 1.23* 2.39 1.13 1.04 0.81 0.77 1.21 1.48
(0.12) (1.19) (0.29) (0.22) (0.17) (0.15) (0.21) (1.02)
Father: undergraduate education 1.50*** 2.15 1.39 1.10 0.66 0.78 1.04 1.35
(0.16) (1.10) (0.36) (0.24) (0.14) (0.16) (0.19) (1.08)
Father: graduate education 1.30 4.65** 1.73* 1.33 0.76 0.89 1.12 0.76
(0.18) (2.57) (0.46) (0.31) (0.17) (0.20) (0.21) (1.32)
Mother: primary education 1.02 1.05 0.85 0.66 1.01 1.25 1.32 0.57
(0.11) (0.58) (0.23) (0.16) (0.25) (0.35) (0.31) (0.66)
Mother: lower secondary education 1.21 0.86 1.00 0.81 1.19 1.11 1.30 2.34
(0.14) (0.50) (0.28) (0.20) (0.30) (0.32) (0.31) (2.17)
Mother: upper secondary education 1.30* 1.29 1.20 0.71 1.11 1.18 1.37 2.51
(0.15) (0.72) (0.32) (0.17) (0.28) (0.33) (0.32) (2.22)
Mother: undergraduate education 1.51*** 1.23 1.32 0.82 1.11 1.21 1.52 6.66*
(0.18) (0.71) (0.36) (0.20) (0.28) (0.35) (0.36) (6.23)
Mother: graduate education 1.58*** 1.44 1.95* 0.87 1.40 1.30 1.68* 1.00
(0.21) (0.87) (0.54) (0.22) (0.36) (0.38) (0.41) (.)
Features of the ‘most likely’ master’s
programb
CAPES score for the program 1.19*** 0.98 1.20 1.06 0.99 0.92* 1.10*** 1.35
(0.03) (0.13) (0.11) (0.03) (0.03) (0.04) (0.03) (0.55)
Student-faculty ratio within the program)
0.91*** 0.83** 0.78*** 0.92*** 0.92*** 0.94*** 0.97*** 0.81
[image:23.842.87.765.89.522.2]Variables
Broad Group or Academic Fielda
Education Humanities and Arts Social Sciences, Business and Law Science, Mathematics and Computing Engineering, Manufacturing and Construction Agriculture and Veterinary Health and Welfare Services
Department also offers Ph.D. degree (dummy)
0.80*** 2.64** 1.06 1.15 1.26*** 1.30** 0.95 14.56***
(0.04) (0.92) (0.20) (0.10) (0.08) (0.10) (0.06) (10.42)
Average standardized ENADE score
of new master’s students 1.03 0.66
*** 0.96 0.75*** 1.00 0.59*** 0.86*** 0.96
(0.03) (0.08) (0.05) (0.02) (0.03) (0.04) (0.03) (0.89)
Private graduate school (dummy) 1.29*** 3.96*** 0.35*** 1.76*** 1.07 0.86 2.43*** 0.51
(0.09) (1.36) (0.03) (0.19) (0.08) (0.14) (0.16) (0.60)
Professional program (dummy) 10.89*** 20.33*** 1.65*** 24.80*** 2.31*** 2.48** 1.23* 0.43
(1.90) (14.76) (0.22) (14.55) (0.25) (0.79) (0.12) (0.47)
Student-program (‘most likely’)b
interaction
Undergraduate and master’s at the same institution (dummy)
5.28*** 8.58*** 15.38*** 4.77*** 4.58*** 2.81*** 5.77*** 18.12**
(0.28) (2.36) (1.42) (0.35) (0.29) (0.28) (0.35) (20.29)
Undergraduate and master’s in the same state (dummy)
0.60*** 2.74* 2.55*** 0.62*** 1.12 0.54*** 0.72*** 0.63
(0.05) (1.40) (0.45) (0.08) (0.13) (0.07) (0.07) (0.98)
Distance (per 100 km) 0.86*** 0.96 0.84*** 0.85*** 0.93*** 0.94*** 0.91*** 0.57*
(0.02) (0.11) (0.02) (0.02) (0.02) (0.02) (0.02) (0.13)
Chi-squared 8,137.71 684.34 4,591.63 4,769.32 4,731.41 1,894.60 7,313.90 433.08
Prob > chi2 0.00 0.00 0.00 0.00 0.00 0.00 0.00 0.00
Log pseudolikelihood -10,982.70 -636.39 -5,609.48 -5,261.44 -7,981.24 -4,107.47 -9,534.10 -120.54
Pseudo R2 0.40 0.49 0.35 0.45 0.31 0.30 0.33 0.50
No. of obs. 65,341 3,997 167,995 25,895 37,116 10,293 73,227 4,936
a According to the classification of UNESCO (1997).
b The ‘most likely graduate program’ is the one with highest probability to be chosen by each student, using the parameters of the probabilistic model estimated at the
first stage.
Progress to graduate education is only considered up to four years after college graduation. Odds ratios are reported. Robust standard errors in parentheses. *p < 0.05, **
[image:24.842.86.767.87.357.2]contributing to the search for and choice of a master’s degree program. Graduate programs at private institutions are 0.85 to 0.59 times less likely to be chosen by students, and this association is significant for programs in all academic fields. Finally, the relative odds that a prospective student will choose a professional program instead of a regular academic program are not significantly different in most fields,
except for ‘Engineering, Manufacturing and Construction’ (34% increase), ‘Health and Welfare’ broad
fields (29% increase) and ‘Science, Mathematics and Computing’ (26% decrease).
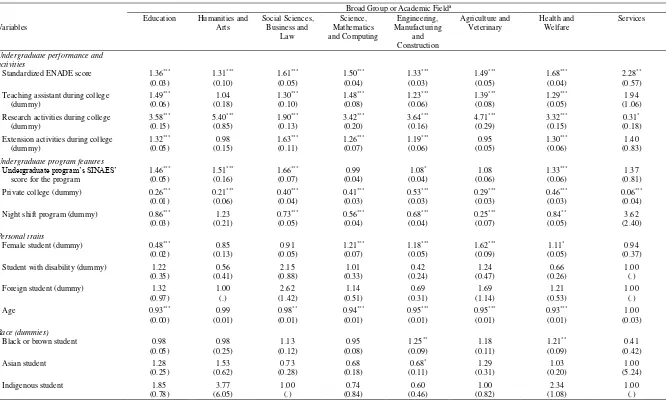
Table 4 presents the estimated parameters of the second stage, or the decision to enroll. Results are again reported as odds ratios. Previous academic performance and participation in academic and scientific activities during college are important factors explaining access to graduate education. In all broad academic fields, a student is more likely to progress to a master’s degree program if he or she obtained a
higher score on the ENADE exam, and the relative odds increase more in the ‘Services’ (2.28 times more likely per additional unit of standard deviation of the distribution) and ‘Health and Welfare’ broad groups
(1.68 times more likely per additional unit of standard deviation). Participation in extra academic or scientific activities is also associated with a higher likelihood of enrollment in nearly all broad fields (with the exception of ‘Services’), particularly participation in undergraduate research projects, as students who participated in these activities are 1.9 to 5.4 times more likely to enroll in a master’s program.
Sound evidence that undergraduate college features are important predictors of graduate enrollment was also obtained. Students who attended a private undergraduate college are substantially less likely to progress to graduate education in all broad fields, and the relative odds decrease from 47%
(‘Engineering, Manufacturing and Construction’) to more than 90% (‘Services’). Students who attended night shift undergraduate programs have a significantly lower likelihood of attendance in five broad fields. In addition, a higher score of the undergraduate program in the SINAES evaluation system is associated with a higher likelihood that students in four broad fields will progress to a master’s degree program, with
an increase in the relative odds of 1.33 to 1.66.
Results for the personal features, on the other hand, are less clear. Racial parameters do not achieve statistical significance in nearly all fields, with the important exception of black and brown college graduates choosing ‘Engineering, Manufacturing and Construction’ master’s programs, who are 1.25 times more likely to enroll in a master’s program than white students. Women graduating from college in the
relative odds of 1.18 to 1.62), although female students in ‘Education’ programs have a lower likelihood to progress to graduation education (a 52% decrease in the relative odds). Older students are less likely to
attend a master’s program (except in the ‘Humanities and Arts’ and ‘Services’ groups), although the relative odds decrease slightly for each additional year (by 0.02% to 0.07%), and thus the likelihood of participation is only substantially reduced in the case of a considerable age gap. Finally, a statistically significant disadvantage is not found for foreigners or students with disabilities.
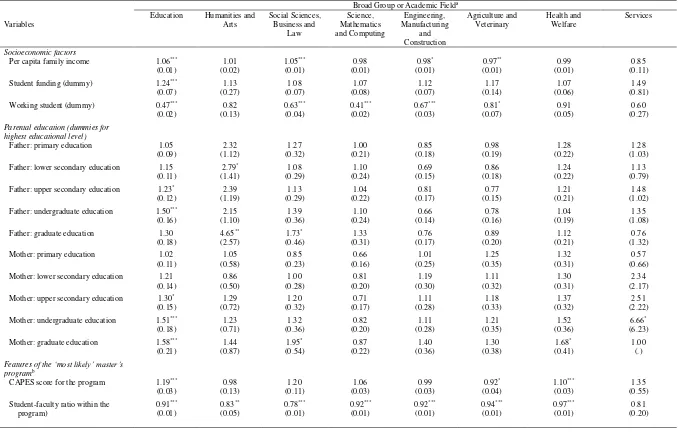
Estimates also do not present a strong case for the importance of socioeconomic factors. A higher family per capitaincome is associated with an increase in the relative odds in only two broad academic
fields (‘Education’; and ‘Social Sciences, Business and Law’), but a negative association is found for other
two fields (‘Engineering, Manufacturing and Construction’, and ‘Agriculture and Veterinary’), and the
estimated parameters are small in all cases and do not exceed a seven percent increase/decrease per additional minimum wage per capita in the residence. In addition, no significant association with enrollment is found for nearly all variables related to parental education, except for the ‘Education’ broad group, in
which any parent with a college degree is associated with a 50% increase in the relative odds. Working status is associated with a reduction in the odds of participation in four broad groups: students studying
‘Education’, ‘Social Sciences, Business and Law’, ‘Science, Mathematics and Computing’ and
‘Engineering, Manufacturing and Construction’ who have a job or professional occupation at the time of
college graduation are 0.41 to 0.67 times less likely to progress to a master’s program.
As discussed in section 2, inequity of access to graduate education is currently a topic of debate, and the literature on the subject has not reached a consensus on whether personal and socioeconomic factors actually affect participation at this level or whether these effects are exerted at previous stages. The empirical analysis presented here contributes to this debate by providing new evidence for the Brazilian case that adds to the international literature discussed in section 2 and can be used to recommend policies and improvements to fight inequity and widen participation in graduate education in Brazil.
Undergraduate performance and extracurricular academic activities are important predictors of
participation in master’s degree programs in the country, with a significant positive association with odds of enrollment in all broad academic fields. These results confirm the results from the descriptive statistical analysis presented in Table 2, as the mean values for these variables were considerably higher for the group
of new master’s students than for the entire sample of college graduates. The findings are not surprising, as
they are in line with previous studies performed in different countries that have reached similar conclusions (Heller 2001; Mullen et al. 2003; Zimdars 2007; Lang 1987; Zhang 2005; Xu 2014; Choy and Carroll 2000). The main arguments used to interpret these results are that students with higher performance are more likely to be accepted in admission processes and that their previous knowledge and skills prepare them for the activities and challenges of a graduate program (Xu 2014).
A more difficult question, however, is whether these findings should be interpreted as a sign of equity in access to graduate education. As discussed in section 2, one can argue that these variables
represent students’ dedication and success throughout undergraduate education, a ‘meritocratic view of
access to graduate education. Higher quality, day shift and programs at public universities are positively associated with the likelihood that a student will start a master’s program in most broad academic fields.
Again, these findings are in line with the descriptive statistics presented in Table 2 (that shows that the
proportion of new master’s students that graduated in undergraduate programs with these features is greater than the proportion for the full sample of college graduates) and with previous analyses performed in other countries that also concluded that the prestige and type of institution are important predictors of progression to a research graduate degree (Wakeling et al. 2009; Zimdars 2007). But it is unclear whether these factors should be regarded as unfair or non-equitable treatment, as higher quality undergraduate programs are likely to attract and select students with greater abilities who are more academically focused (Wakeling and Kyriacou 2010). On the other hand, institutional prestige and college credentials can also indicate indirect effects of wealth and other socioeconomic factors (Bills 2003), strengthening the process of ‘stratification’
of higher education (Wakeling and Kyriacou 2010) and perpetuating social inequalities.
Although new master’s students generally come from wealthier families and their parents have achieved higher levels of education (as presented in Table 2), the results indicate that family income and parental education do not predict enrollment in most broad fields. These results are intriguing, not only because they differ from previous studies performed in the U.S., U.K. and Canada (Mullen et al. 2003; Zarifa 2012; Wales 2013; Millett 2003) but also because compelling explanations for the effects of these variables on graduate enrollment exist (Mullen et al. 2003). There are no obvious explanations for why the results from Brazil differ from other countries, but a hypothesis to be tested in future studies is that, as a recently developed educational level in the country, graduate education might not be completely integrated with the processes of social stratification and credential inflation. Thus, the link between parental socioeconomic status and educational continuation may still be weak, as Stolzenberg (1994) suggested in the U.S. in the 1990s. Another possible explanation is that these factors affect undergraduate college so strongly that their effects on graduate education are only indirect, as represented by undergraduate performance and credentials (Ethington and Smart 1986).
Master’s students in the sample are on average younger than the entire group of observed college