The prognostic impact of P wave dispersion in prediction
of clinical outcome after percutaneous balloon mitarl
valvuloplasty in patients with mitral stenosis and
sinus rhythm
Ragab A. Mahfouz, Ashraf E. Dewedar
Department of Cardiology, Faculty of Medicine, Zagazig University, Zagazig, Egypt Email: ashrafdwedar@yahoo.com
Received 25 January 2012; revised 31 March 2012; accepted 29 April 2012
ABSTRACT
Objective: The aim of the study was to investigate the impact of P-maximum and P-wave dispersion on the long term clinical outcome after successful percuta- neous balloon mitral valvuloplasty (PBMV) in pati- ents with mitral stenosis (MS) and sinus rhythm. Also to test the correlation between P-variables and right ventricular function and pulmonary artery pressure before and after PMBV. Methods: Eighty-five pati- ents undergoing PMBV were enrolled in this study. We evaluated P-maximum, P-minimum and P-wave dispersion before and one month after PBMV. We studied the changes in pulmonary arterial pressure (PAP), left atrial (LA) dimension, mitral diastolic gradient, and mitral valve area, in addition to the changes in right ventricular function utilizing tissue Doppler assessment both before and after PMBV, in addition the role of the P-wave dispersion in predic- tion of late cardiac events. Results: There were sig- nificant decreases in mean diastolic gradient, PAP, and LA size and significant improvement in right ventricular tissue Doppler indices after PMBV. Ac- company these hemodynamic changes after PMBV. P-maximum and P-wave dispersion were found to be decreased (P < 0.001). Patients developed cardiac events during follow-up had a higher P-maximum and P-dispersion than those without late cardiac events (P < 0.001). Moreover the changes in P-maxi- mum and P-dispersion before and after PMBV in patients with cardiac events were not significant, while P-maximum and P-dispersion significantly (P < 0.002) decreased in patients without events It was revealed with linear regression and correlation analy- sis that the degree of and the changes in P-maximum and P-wave dispersion were correlated with devel- opment of late cardiac events after PMBV, with Cut-
off values of ≥62.8 msec for P-wave dispersion and 118 mes for P-maximum.ROC curve showed AUC of 0.919 for P-wave dispersion and 0.913 for P-maxi- mum (P < 0.001). Conclusion: P-wave maximum and dispersion are significantly increased in patients with mitral stenosis. These changes decreased significantly after PMBV. The P-maximum and P-wave dispersion changes were correlated with significant impairment of right dysfunction and the degree of pulmonary artery pressure. P-maximum and P-wave dispersion could be considered as independent predictors of late outcome of patients with MS after successful PMBV (AF, recurrent hospital admission, embolic phenome- non deterioration of right ventricular function).
Keywords:P-Wave Maximum P-Wave Minimum; P-Wave Dispersion; Rheumatic Mitral Stenosis; Cardiac Events; Follow-Up
1. INTRODUCTION
P-wave prolongation has been used as a marker of in- teratrial conduction disturbance and prolonged atrial conduction time, which has been associated with a high frequency of atrial fibrillation (AF). These atrial conduc- tion disturbances are nonuniform and site dependent, and may result in a highly variable P-wave duration in the different leads of a 12-lead electrocardiogram (ECG). As a marker of this variation, the P-wave dispersion has been introduced as the difference between the maximum and minimum P-wave duration. Prolonged P-wave dura- tion and P-wave dispersion have been found to be pre- dictive of later AF in patients with idiopathic AF [1-3], and recurrence of AF following cardioversion [4,5].
deficit, echo score > 8, severe mitral deficit following dilatation and increased pressure in the pulmonary artery after dilatation, small valve area after the procedure (<1.5 cm2), non-sinus rhythm, valve calcification on flu-
oroscopy, increased LA pressure, increased transvalvular gradient [6-11]. Two case control studies identified a sig- nificant decrease in P wave indices at one month follow- ing mitral balloon valvuloplasty for mitral stenosis, and there is less understanding about the meaning of these changes at late follow-up after the percutaneous inter- vention [12,13]. Even there are no studies about the im- pact of P-wave duration and P-wave dispersion in pre- diction of late events after percutaneous balloon mitral valvuloplasty.
2. AIM OF THE STUDY
The aim of the study was to investigate the impact of P-maximum and P-wave dispersion on the long term clinical outcome after successful PBMV in patients with mitral stenosis (MS) and sinus rhythm. Also test the cor- relation between P-maximum and P-dispersion to right ventricular function and pulmonary artery pressure be- fore and after PMBV.
3. SUBJECTS AND METHODS
A total of 85 patients with mitral stenosis and fulfill the criteria needed for percutaneous mitral balloon valvu- loplasty were included in the study. Only persons 35 years of age or younger were included in the study to minimize the chance of the presence of associated coro- nary artery disease. Inclusion criteria: 1) pure mitral stenosis of rheumatic origin; 2) nonexistent or mild mi- tral insufficiency; 3) absence of concomitant hemody- namically significant other valvular disease; 4) TDI-de- rived good quality echocardiographic imaging allowing measurements of tricuspid annular velocities; 5) absence of any disease that could affect myocardial function (e.g. coronary artery disease, chronic lung disease, cardiomy- opathies); 6) absence of atrioventricular conduction ab- normalities and atrial fibrillation. They were classified into two groups according to the development of cardiac events along the period of follow-up. Group I, included those with cardiac events and group II included those without cardiac events during follow-up.
Sixty two age- and sex-matched healthy subjects were also enrolled as the control group.
3.1. PBMV Procedure
All procedures were performed by the anterograde trans- septal approach. A double balloon was used in 85 pa- tients with mitral stenosis on sinus rhythm, according to the stepwise technique, under fluoroscopy guidance. A successful PBMV, was defined as an MVA ≥ 1.5 cm2 or
≥1 cm2/m2 with no regurgitation >2/4.
3.2. P-Wave Dispersion Measurement
P wave duration was measured in all simultaneously re- corded 12 leads of the surface ECG. All recordings were performed in the same quiet room during spontaneous breathing, following 20 minute of adjustment in the su- pine position. P-wave indices were evaluated before mi- tral valvuloplasty and one month after. P wave duration measurements were obtained manually using calipers and magnifying lens for accurate definition of the ECG deflection as defined in a previous study [14]. The onset of the P wave was defined as the point of the first visible upward departure of the trace from the bottom of the baseline. The return to the baseline of the bottom of the trace in wave was considered to be the end of the P wave. P maximum in any of the 12 lead surface ECGs was measured and used as a marker of prolonged atrial con- duction time. The difference between P-wave maximum and P-wave minimum durations was defined as P-wave dispersion.
3.3. Echocardiography
Echocardiographic examination was performed using avail- able transthoracic ultrasound equipment (HB-5500, with a phased-array transducer of 2.5 MHz). Echocardiogra- phic examination, including M-mode, two-dimensional (2D), pulsed and color Doppler measurements and TDI parameters were recorded before PBMV and analyzed off-line. Measurements were done and evaluated accord- ing to recent guidelines 15.
M-mode study was used to measure the left atrial di- mension. To determine the transmitral valve gradient, four-chamber apical view was used with the sample vol- ume placed at the mitral valve coaptation point. Trans- mitral valve gradient was defined as the mean of gradi- ents obtained from three consecutive beats obtained by continuous wave Doppler study. Mitral valve area was measured by planimetry of the mitral valve in short axis view and the mean of three measurements in three dif- ferent beats were accepted as final. Mitral valve areas of 1 cm2 or less were considered to be very severe, 1 cm2 to
1.5 cm2 were considered to be moderate and greater than 1.5 cm2 were considered to be mild cases.
RV-diameter was measured in the apical four-chamber view above the tricuspid annular plane. RV function was assessed by, tricuspid annular plane systolic excursion (TAPSE). TAPSE as a parameter for RV long axis func- tion was assessed with M-Mode cursor positioned at the free wall angle of the tricuspid valve annulus, whereas data were averaged over five beats as it has been rec- ommended [16]. Pulsed Doppler tissue imaging tech- niques (TDI) were used for estimation of tricuspid annu- lar systolic and diastolic velocities before and in the next day after PMBV, after placing the cursor at the junction of the right ventricle free wall and the anterior leaflet of the tricuspid valve, using the 2D four-chamber view. The peak systolic (Sm), peak early diastolic (Em), and peak late diastolic (Am) annular velocities were calculated and averaged over three consecutive beats, as it has been previously described [17].
Intra- and inter-observer measurement errors for all the manually measured ECG were 2.7 and 2.9 for P- wave Dispersion and 2.2 and 2.3 for P-maximum
While the Interobserver and intraobserver variability in these measurements which can be relatively high, so our Doppler by 2 investigators. There were minor intra- observer variations; 1.00% ± 1.35% for MV area, 2.74% ± 0.15% for LA diameter. 2.1% + 0.9% for mitral pres- sure gradient, 1.1% + 0.32% for Sm and 0.3 + 0.11 for MV score.
3.4. Follow-Up
All patients were followed-up for a mean period of 48 + 11 months. All patients were evaluated by complete echo- cardiographic study after one month following balloon mitral valvuloplasty. The follow-up visits after that were performed every 6 months and upon any symptoms like dyspnea or palpitation. The follow-up studies included complete history taking and thorough clinical examina- tion, electrocardiogram as well as complete echo-Dop- pler assessment.
4. STATISTICAL ANALYSIS
All the analyses were performed using a commercially available package (SPSS, Rel. 11.0, 2002, SPSS Inc., Chicago). To compare MS patients vs. references or MS patients with events vs MS patients without events after PBMV, the unpaired Student’s t-test was performed for
continuous variables, whereas for categorical variables, Fisher’s exact test was used. Quantitative values are pre- sented as mean ± 1 standard deviation (SD). Relation be- tween quantitative variables was studied using the linear regression. In the search for a diagnostic cut-off value for occurrence of events at follow-up, a receiver operating characteristic (ROC) curve analysis was constructed and the area under the curve is reported, which is representa-
tive of the discriminatory ability of the variable cut-off. Sensitivity and specificity, positive and negative predic-tive values of the best cut-off variable were calculated. A P-value of <0.05 was considered statistically significant [18,19].
5. RESULTS
A total of 85 patients with mitral stenosis and fulfill the criteria needed for percutaneous mitral balloon valvu- loplasty were included in the study. They were classified into two groups according to the development of cardiac events along the period of follow-up. One group with cardiac events and another group without cardiac events. All patients were in sinus rhythm. After (48 + 11) mon- ths period of follow-up, 27 (31.8%) patients out of 85 had events: 22 patients developed persistent AF, 4 pa- tients became symptomatic (NYHA class III and occur- rence of symptoms with pulmonary pressure > 75 mmHg), one underwent percutaneous valvuloplasty for restenosis), and two cases developed stroke (associated with recent paroxysmal AF).
Table 1 compares the basic demographic and echo- cardiographic variables of patients with mitral stenosis and control group. The echocardiographic variables be- fore and after one month of the procedure are compared in Table 2. The P-wave variables were significantly high- er in patients with mitral stenosis compared to control subjects Table 3.
Table 4 shows that the P-wave variables significantly decreased after successful PMBV.
6. PREDICTION OF CARDIAC EVENTS
AFTER PBMV
Maximum P-wave duration and PWD of patients were significantly higher in patients with cardiac events than in those without events during the period of follow-up, both before and after PBMV (P < 0.001 and P < 0.001, respectively) Table 5. However, there was no statistic- cally significant difference between the two groups re- garding minimum P-wave duration (P > 0.05). Table 6
represents a significant correlation between the P-wave dispersion and the degree of pulmonary hypertension and tissue Doppler indices of impaired right ventricular dys- function.
Table 1. General characteristics of the studied samples.
P-value Reference (n = 62)
MS patients (n = 85)
>0.05 27± 2
28 ± 6 Age (years)
>0.05 23/19
64/21 Sex (M/F)
>0.05 1.66 ± 0.3
1.65 ± 0.3 BSA (m2)
>0.05 76 ± 11
78 ± 12 Heart rate (bpm)
>0.05 119 ± 12
117 ± 11 Systolic blood pressure (mmHg)
>0.05 72 ± 7
70 ± 7 Diastolic blood pressure (mmHg)
- 7.35 ± 2.1
Echo-score
-
0.95 ± 0.08
MVA—2D planimetry (cm2)
-
1.03 ± 0.11
MVA—PHT (cm2)
- 31.52 ± 8.7
Mean transmitral gradient (mmHg)
<0.0001 31 ± 2
48.1 ± 2.9 LA antero-posterior diameter (mm)
>0.05 45.6 ± 2.2
42.3 ± 3.1 LVEDD (mm)
>0.05 28 ± 2.1
25.1 ± 1.9 LVESD (mm)
>0.05 77.9 ± 6.2
76.3 ± 5.5 LVEF (%)
<0.05 19 ± 2
26.85 ± 1.2 RV diastolic diameter (mm)
<0.0001 18 ± 3
64.05 ± 8.61 PASP (mmHg)
<0.003 23.9 ± 3.2 mm
14.15 ± 1.4 TAPSE
<0.001 16.19 ± 1.0
10.41 ± 1.2 Sm
<0.001 2.01 ± 0.15
1.19 ± 0.13 Em/Am ratio
[image:4.595.58.539.479.708.2]BSA = body surface area, MVA = mitral valve area, 2D = two dimensional, PHT = Pressure half time, LVEDD = left ventricular end diastolic, LVESD = left ventricular end systolic, PASP = pulmonary artery systolic pressure, TAPSE = Tricuspid annular plan systolic excursion, Sm: systolic tricuspid myocardial velocity; E/Em: ratio of early diastolic transtricusid flow velocity to early diastolic peak myocardial velocity.
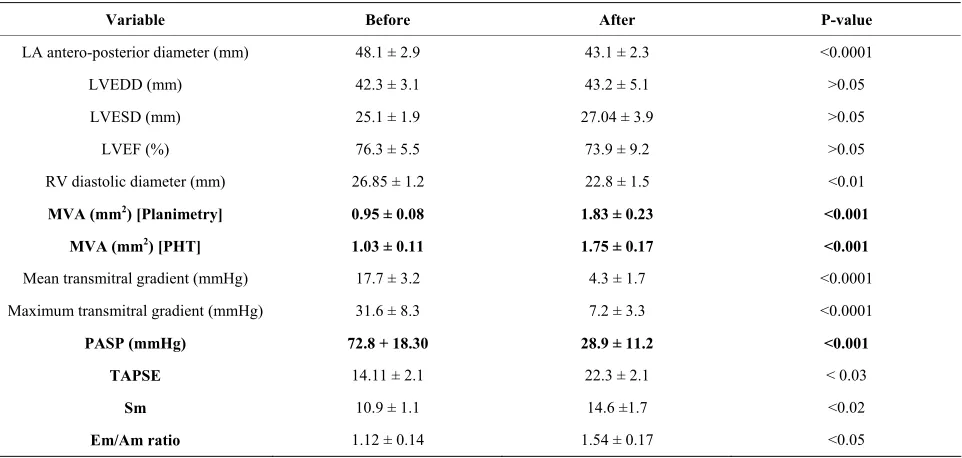
Table 2. Echocardiographic data before and immediately after percutaneous mitral valvuloplasty (PTMV).
Variable Before After P-value
LA antero-posterior diameter (mm) 48.1 ± 2.9 43.1 ± 2.3 <0.0001
LVEDD (mm) 42.3 ± 3.1 43.2 ± 5.1 >0.05
LVESD (mm) 25.1 ± 1.9 27.04 ± 3.9 >0.05
LVEF (%) 76.3 ± 5.5 73.9 ± 9.2 >0.05
RV diastolic diameter (mm) 26.85 ± 1.2 22.8 ± 1.5 <0.01
MVA (mm2) [Planimetry] 0.95 ± 0.08 1.83 ± 0.23 <0.001
MVA (mm2) [PHT] 1.03 ± 0.11 1.75 ± 0.17 <0.001
Mean transmitral gradient (mmHg) 17.7 ± 3.2 4.3 ± 1.7 <0.0001
Maximum transmitral gradient (mmHg) 31.6 ± 8.3 7.2 ± 3.3 <0.0001
PASP (mmHg) 72.8 + 18.30 28.9 ± 11.2 <0.001
TAPSE 14.11 ± 2.1 22.3 ± 2.1 < 0.03
Sm 10.9 ± 1.1 14.6 ±1.7 <0.02
Em/Am ratio 1.12 ± 0.14 1.54 ± 0.17 <0.05
Table 3. P-wave variables among patients with mitral stenosis versus control subjects.
Variable Patients with MS Control subjects P-value
P-wave maximun 128.7 ± 19.6 84.5 ± 12.9 <0.001
P-wave minimum 63.3 ± 8.6 46.2 ± 7.3 <0.001
[image:5.595.57.542.194.256.2]P-wave dispersion 65.2 ± 5.7 38.1 ± 4.2 <0.001
Table 4. P-wave variables among patients with mitral stenosis before and after PBMV.
P wave variable Pre-PBMV Post-PBMV P-value
P-wave maximun 128.7 ± 19.6 102.3 ± 10.2 <0.001
P-wave minimum 63.3 ± 8.6 51.5 ± 7.1 <0.002
[image:5.595.54.542.284.441.2]P-wave dispersion 65.2 ± 5.7 50.6 ± 6.5 <0.001
Table 5. P-wave variables among patients with cardiac events versus those without events before and after PBMV.
Variable Patients with events 27 (31.8%) Patients without events 58 (68.2%) P-value
P-wave maximum
- Pre-PBMV 130.5 ± 9.8 119.5 ± 9.2* <0.002
- Post-PBMV 126.9 ± 10.1 97.7 ± 9.6 <0.001
P-wave minimum
- Pre-PBMV 64.1 ± 6.9 59.7 ± 5.4 >0.05
- Post-PBMV 60.8 + 5.8 58.9 + 5.1 >0.05
P-wave dispersion
- Pre-PBMV 66.9 ± 4.8 54.6 ± 4.3* <0.03
- Post-PBMV 63.7 ± 5.2 42.2 ± 5.0 <0.001
*Represents P < 0.002. PBMV = percutaneous balloon mitral valvuloplasty.
Table 6. Correlation between P-wave dispersion and pulmo- nary artery pressure and right ventricular function.
Variable r P
PASP 0.86 0.0001
Em 0.68 0.001
Am 0.56 0.001
E/Em 0.74 0.001
TAPSE 0.78 0.0001
PAP = pulmonary artery pressure, Em: early diastolic peak myocardial velocity; Am: late diastolic peak myocardial velocity; E/Em: ratio of early diastolic transtricuspid flow velocity to early diastolic peak myocardial velocity.
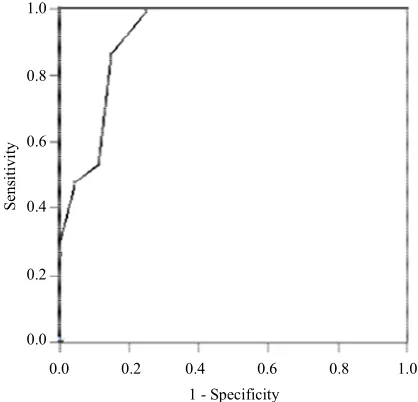
value of 86% and negative predictive value of 96%. (AUC = 0.913, P < 0.001) (Table 7, Figures1 and 2).
7. DISCUSSION
The most striking findings of the present study are: 1) There was significant prolongation of the maximum P-wave duration and P-wave dispersion in patients with MS compared with their age- and sex-matched healthy
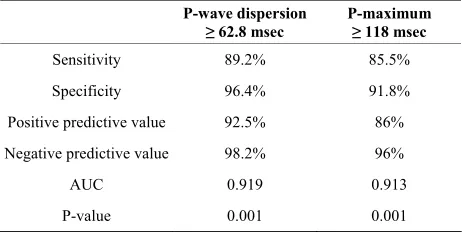
Table 7. Cut off values, Sensitivity, specificity, positive pre- dictive value, and negative predictive value of P-maximum and P-wave dispersion in prediction of cardiac events.
P-wave dispersion
≥ 62.8 msec P-maximum ≥ 118 msec
Sensitivity 89.2% 85.5%
Specificity 96.4% 91.8%
Positive predictive value 92.5% 86%
Negative predictive value 98.2% 96%
AUC 0.919 0.913
P-value 0.001 0.001
AUC = area under curve.
controls.
2) The maximum P-wave duration and P-wave disper- sion in patients with MS had a strong correlation with the degree of pulmonary artery pressure and tissue Doppler indices of right ventricular dysfunction.
[image:5.595.57.287.490.586.2] [image:5.595.308.539.501.617.2]0.0 0.2 0.4 0.6 0.8 1.0 1 - Specificity
1.0
0.8
0.6
0.4
0.2
0.0
Se
ns
iti
vit
[image:6.595.66.279.81.287.2]y
Figure 1. ROC curve for P-wave dispersion (AUC = 0.919, P < 0.001).
0.0 0.2 0.4 0.6 0.8 1.0 1 - Specificity
1.0
0.8
0.6
0.4
0.2
0.0
Se
ns
iti
vi
ty
Figure 2. ROC curve for P maximum (AUC = 0.913, P < 0.001).
4) Decrease in maximum P-wave duration and P-wave dispersion after PMBV showed a significant correlation with improvement of right ventricular function and re- gression of pulmonary artery pressure after balloon mi- tral valvuloplasty
5) P-maximum and P-wave dispersion are independent predictors of cardiac events during follow-up (atrial fib- rillation, development of embolic events and recurrent hospitalization) spite of successful PBMV.
6) The cut-of values of P-wave dispersion and P- maximum in prediction of cardiac events after successful PBMV were 62.8 msec and 118 msec respectively.
Left atrial dilation, fibrosis within the wall of the left atrium and disorganization of the atrial muscle bundles
may occur as a result of mitral valve disease and atrial inflammation due to rheumatic carditis. These structural changes can lead to electrical inhomogeneity, nonuni- form conduction velocities and inhomogeneous refract- tory periods within the atrial myocardium [20], which can be seen on the ECG as increased P-wave duration [21].
There are fewer studies which mention specific changes in the P wave of electrocardiograms or long term im- provement of left atrial enlargement after the procedure. In addition there are no studies in the medical literature which make a correlation between P-wave duration and dispersion before and after percutaneous balloon mitral valvuloplasty (PBMV) and cardiac events after success- ful PBMV
The current study reports a good correlation of P-wave dispersion with right ventricular dysfunction and in- creased pulmonary artery systolic pressure in patients with mitral stenosis. In addition significant decrease in P-wave dispersion was associated with significant im- provement of RV dysfunction and regression of pulmo- nary artery pressure during follow-up.
Chandrasekar et al. [22] demonstrated that acute hemo-
dynamic changes following mitral valvuloplasty with a balloon produce changes in the electrocardiogram, indic- ative of an important hemodynamic benefit resulting from the procedure. In their study patients who had changes in the P-wave patterns had a significant decrease in the left atrium average pressure, smaller residual transmitral gra- dient and a higher percentage in the opening of the mitral valve. However, the assessment was restricted to the first 72 hours post procedure. Turhan et al. [12] reported that
there was a significant decrease in P-wave dispersion fol- lowing mitral valvuloplasty in both the short and the long term.
During long-term follow-up of patients after success- ful PMBV, 27 (31.6%) patients out of 85 patients devel- oped cardiac events 22 patients developed persistent AF, 4 patients became symptomatic (NYHA class III and occurrence of symptoms with pulmonary pressure > 75 mmHg,), one underwent percutaneous valvuloplasty for restenosis), and two cases developed stroke (associated with recent paroxysmal AF).
The current study showed that patients with cardiac events during follow-up had significantly higher P- maximum and P-wave dispersion both before and after successful PMBV. Not only this but also the changes of these parameters before and after PMBV were insignifi- cants in patients with cardiac events, while there was a highly significant decrease in P-maximum and P-wave dispersion in patients without late events after PBMV.
[image:6.595.67.276.327.528.2]that maintained sinus rhythm. The largest cohort study included 64 subjects, and found the 28 with recurrence had significantly longer P wave indices. [23]. Prolonged P wave indices have been associated with increased risk for incident AF. A retrospective cohort study followed 97 patients with essential hypertension for a mean dura- tion of 25 ± 3 months, identifying incident AF in 20%. 26 Adjusting for age attenuated the odds ratio from 2.09 to 1.34 for prolonged P wave indices (maximum duration
≥ 130 msec and dispersion ≥ 40 msec) to predict AF [24]. In a case-control study of 308 hospitalized subjects, the prevalence of P wave duration ≥ 110 msec was 52% in the cohort with AF, compared to 18% of the 308 subjects in a referent cohort. [25] This study had a large age range (26 to 93 years) and calculated P wave duration from three leads. A nested case-control study from a popula- tion-based study found that 70% of 40 elderly subjects who developed AF after 10 years had baseline P wave durations > 120 msec, compared to 41% of the 120 con- trols [26]. P wave duration remained predictive of AF following adjustment for covariates of body mass index and hypertension.
8. CLINICAL IMPLICATION
Chronic AF is associated with an increased risk of em- bolic events and negative impact on cardiac function and, therefore, an increased morbidity and mortality risk in patients with rheumatic MS. Therefore, the identification of patients who are susceptible to the development of AF will be of great value. Erbay et al. [27] have shown that
four weeks of oral beta-blocker therapy in patients with moderate-to-severe rheumatic MS can significantly re- duce the maximum P-wave duration and the P-wave dis- persion. Prolongation of maximum P-wave duration and P-wave dispersion may help detect such patients and may be used as an indicator for early intervention in pa- tients with mitral stenosis.
Limitations
The most important limitation of our study is the manual calculation of P-wave measurements using a magnifying lens instead of computer-assisted P-wave calculations. However the main propose was to investigate the changes of P-wave indices before and after PBMV and whether these non-invasive parameters can predict cardiac events after successful PBMV.
9. CONCLUSION
P-wave maximum and dispersion are significantly in- creased in patients with mitral stenosis and these changes were correlated with significant impairment of right dys- function and the degree of pulmonary artery pressure. These changes were significantly decreased after suc-
cessful PMBV. P-maximum and P-wave dispersion could be considered as independent predictors of late outcome of patients with MS after successful PMBV. The cut-of values of P-dispersion ≥ 62.8 msec and P-maximum ≥
118 msec are highly sensitive and specific in prediction of AF and adverse cardiac events after PBMV
10. RECOMMENDATION
This study identifies other simple non-invasive factors that help in prediction long-term results after successful percutaneous balloon valvuloplasty, as P-wave duration and P-wave dispersion. The use of these factors in con- junction with the currently identified predictors allows optimal selection of patients for PMBV.
REFERENCES
[1] Aytemir, K., Ozer, N., Atalar, E., et al. (2000) P wave
dispersion on 12-lead electrocardiography in patients with paroxysmal atrial fibrillation. Pacing and Clinical Elec-
trophysiology, 23, 1109-1112.
doi:10.1111/j.1540-8159.2000.tb00910.x
[2] Gialafos, E.J. (1999) P wave dispersion. A valuable elec- trocardiographic marker for the prediction of paroxysmal lone atrial fibrillation. Annals of Noninvasive Electrocar-
diology, 4, 39-45.
doi:10.1111/j.1542-474X.1999.tb00363.x
[3] Dilaveris, P.E., Gialafos, E.J., Andrikopoulos, G.K., et al.
(2000) Clinical and electrocardiographic predictors of re- current atrial fibrillation. Pacing and Clinical Electro-
physiology, 23, 352-358.
doi:10.1111/j.1540-8159.2000.tb06761.x
[4] Boriani, G., Diemberger, I., Biffi, M., et al. (2005) P
wave dispersion and short-term versus late atrial fibrilla- tion recurrences after cardioversion. International Jour-
nal of Cardiology International Journal of Cardiology,
101, 355-361. doi:10.1016/j.ijcard.2004.03.039
[5] Perzanowski, C., Ho, A.T. and Jacobson, A.K. (2005) In- creased P-wave dispersion predicts recurrent atrila fibril- lation after cardioversion. Journal of Electrocardiology,
38, 43-60. doi:10.1016/j.jelectrocard.2004.09.008
[6] Palacios, I.F., Sanches, P.C., Harrel, L.C., et al. (2002)
Which patients benefit from percutaneous mitral balloon valvuloplasty? Prevalvuloplasty and postvalvuloplasty vari- ables that predict long-term outcome. Circulation, 105,
1465-1471. doi:10.1161/01.CIR.0000012143.27196.F4
[7] Hernandez, R., Banelos, C., Alfonso, F., et al. (1999) Long-
term clinical and echocardiographic follow-up after per- cutaneous mitral valvuloplasty with the Inoue balloon.
Circulation, 99, 1580-1586.
doi:10.1161/01.CIR.99.12.1580
[8] Iung, B., Cormier, B., Ducimetiere, P., et al. (1996) Func- tional results 5 years after successlful percutaneous mitral commissurotomy in a series of 528 patients and analysis of predictive factors. Journal of the American College of
Cardiology, 27, 407-414.
[9] Iung, B., Garbaz, E., Michaud, P., et al. (1999) Late results
of percutaneous mitral commissurotomy in a series of 1024 patients. Analysis of late clinical deterioration: Frequency, anatomic findings and predictive factors. Circulation, 99, 3272-3278. doi:10.1161/01.CIR.99.25.3272
[10] Orrange, S.E., Kawanish, D.T., Lopez, B.M., et al. (1997)
Acturial outcome after catheter balloon commissurotomy in patients with mitral stenosis. Circulation, 95, 382-389.
doi:10.1161/01.CIR.95.2.382
[11] Pan, M., Medina, A., Suarez de lezo, J., et al. (1993) Fac-
tors determining late success after mitral balloon valvu- lotomy. American Journal of Cardiology, 71, 1181-1185.
doi:10.1016/0002-9149(93)90643-Q
[12] Turhan, H., Yetkin, E., Senen, K., et al. (2002) Effects of
percutaneous mitral balloon valvuloplasty on p-wave dis- persion in patients with mitral stenosis. American Journal
of Cardiology, 89, 607-609.
doi:10.1016/S0002-9149(01)02307-4
[13] Marijon, E., Jani, D. and Garbarz, E. (2007) P-wave dis- persion and percutaneous mitral valvuloplasty. Cardiol-
ogy in Review, 15, 42-45.
[14] Dilaveris, P.E., Gialafos, E.J., Sideris, S.K., Theopistou, A.M., Andrikopoulos, G.K., Kyriakidis, M., Gialafos, J.E.,
et al. (1998) Simple electrocardiographic markers for the
prediction of paroxysmal idiopathic atrial fibrillation.
American Heart Journal, 135, 733-738.
doi:10.1016/S0002-8703(98)70030-4
[15] Steban, A., Alia, I., Tobin, M.J., Gil, A., Gordo, F., Vall- verdu, I., Blanch, L., Bonet, A., Vazquez, A., Pablo, R.D., Torres, A., de la Cal, M.A. and Macias, S. (1999) Effect of spontaneous breathing trial on outcome of attempts to discontinue mechanical ventilation. Spanish Lung Failure Collaborative Group. American Journal of Respiratory
and Critical Care Medicine, 159, 512-518.
[16] Ghio, S., Recusani, F., Klersy, C., Sebastiani, R., Laudisa, M.L., Campana, C., Gavazzi, A. and Tavazzi, L. (2000) Prognostic usefulness of the tricuspid annular plane sys- tolic excursion in patients with congestive heart failure secondary to idiopathic or ischemic dilated cardiomyo- pathy. American Journal of Cardiology, 85, 837-842.
doi:10.1016/S0002-9149(99)00877-2
[17] Vignon, P., AitHssain, A., François, B., Preux, P.M., Pichon, N., Clavel, M., Frat, J.P. and Gastinne, H. (2008) Echocardiographic assessment of pulmonary artery occlu- sion pressure in ventilated patients: A transoesophageal study. Critical Care, 12, R18. doi:10.1186/cc6792
[18] Mehta, C.R. and Patel, N.R. (1995) Exact logistic regres- sion: Theory and examples. Statistics in Medicine, 14, 2143-2160.
[19] Hanley, J.A. and McNeil, B.J. (1982) The meaning and use of the area under a receiver operating characteristics (ROC) curve. Radiology, 143, 29-36.
[20] Andrikopoulos, G.K., Dilaveris, P.E. and Richer, D.J. (2000) Increased variance of the P wave duration on the electrocardiogram distinguishes patients with idiopathic paroxysmal atrial fibrillation. Pacing and Clinical Elec-
trophysiology, 23, 1127-1132.
doi:10.1111/j.1540-8159.2000.tb00913.x
[21] Braunwald, E. (2001) Valvular heart disease. In: Braun- wald, E., Zipes, D.P. and Libby, P., Eds, Heart Disease:
A Text book of Cardiovascular Disease, 6th Edition, WB
Saunders, Philadelphia, 1643-1653.
[22] Chandrasekar, B., Loya, Y.S., Sharma, S., et al. (1998)
Acute effect of balloon mitral valvotomy on serial elec- trocardiographic changes and their haemodynamic corre- lation. Indian Heart Journal, 50, 179-182.
[23] Dogan, A., Avsar, A. and Ozturk, M. (2004) P-wave dis- persion for predicting maintenance of sinus rhythm after cardioversion of atrial fibrillation. American Journal of
Cardiology, 93, 368-371.
doi:10.1016/j.amjcard.2003.09.064
[24] Ciaroni, S., Cuenoud, L. and Bloch, A. (2000) Clinical study to investigate the predictive parameters for the on- set of atrial fibrillation in patients with essential. Ameri-
can Heart Journal, 139, 814-819.
doi:10.1016/S0002-8703(00)90012-7
[25] Agarwal, Y.K., Aronow, W.S., Levy, J.A. and Spodick, D.H. (2003) Association of interatrial block with devel- opment of atrial fibrillation. American Journal of Cardi-
ology, 91, 882. doi:10.1016/S0002-9149(03)00027-4
[26] De Bacquer, D., Willekens, J. and De Backer, G. (2007) Long-term prognostic value of p-wave characteristics for the development of atrial fibrillation in subjects aged 55 to 74 years at baseline. American Journal of Cardiology, 100, 850-854. doi:10.1016/j.amjcard.2007.04.017
[27] Erbay, A.R., Turhan, H., Yasar, A.S., et al. (2005) Effects
of long-term beta-blocker therapy on P-wave duration and dispersion in patients with rheumatic mitral stenosis.
International Journal of Cardiology, 102, 33-37.