http://www.scirp.org/journal/jwarp ISSN Online: 1945-3108
ISSN Print: 1945-3094
DOI: 10.4236/jwarp.2017.911079 Oct. 19, 2017 1213 Journal of Water Resource and Protection
Natural Disaster Risk in Municipal Solid Waste
Disposal Sites Using GIS: A Case Study in São
Paulo State, Brazil
Victor Fernandez Nascimento
1,2, Anahi Chimini Sobral
1, Pedro R. Andrade
1, Nazli Yesiller
2,
Jean Pierre Henry Balbaud Ometto
11Earth System Science Center (CCST), National Institute for Space Research (INPE), São José dos Campos, Brazil 2Global Waste Research Institute (GWRI), California Polytechnic State University (Cal Poly), San Luis Obispo, CA, USA
Abstract
Natural disasters and finding suitable areas to dispose of municipal solid waste (MSW) are two major global challenges, both of which have several influences in the water resources and are related to climatic change, especially in developing countries like Brazil. Currently the risk of natural disasters is not utilized in the process of locating areas to dispose of MSW. This study, using geographic information system (GIS), analyzed spatially the susceptibility for landslide and flooding hazards in MSW disposal sites in São Paulo state, Brazil. The re-sults showed that more than 90% of sanitary and ditch landfills are located in null, very low and low hazard classes (P0, P1 and P2). However, in this remain-ing 10% of landfills we still have approximately 55% of the total municipal solid waste disposed into susceptible areas with middle, high and very high hazard classes (P3, P4 and P5). This shows that São Paulo MSW disposal sites need more attention and control to prevent the occurrence of landslide/flooding and consequently the mitigation of environmental, economic and social impacts. In addition, the use of GIS is proved to be an appropriate tool to carry out this type of analysis, so we recommend that the risk of natural disasters should be taken into consideration in the process of finding landfill areas. Mainly, be-cause, there is a tendency for extreme weather events to increase causing more flood and landslide events and consequently contributing to water scarcity and water degradation.
Keywords
Landfills, Spatial Analysis, Susceptibility, Hazard, Landslides, Flood How to cite this paper: Nascimento, V.F.,
Sobral, A.C., Andrade, P.R., Yesiller, N. and Ometto, J.P.H.B. (2017) Natural Disaster Risk in Municipal Solid Waste Disposal Sites Using GIS: A Case Study in São Paulo State, Brazil. Journal of Water Resource and Protection, 9, 1213-1224.
https://doi.org/10.4236/jwarp.2017.911079
Received: August 22, 2017 Accepted: October 16, 2017 Published: October 19, 2017
Copyright © 2017 by authors and Scientific Research Publishing Inc. This work is licensed under the Creative Commons Attribution International License (CC BY 4.0).
DOI: 10.4236/jwarp.2017.911079 1214 Journal of Water Resource and Protection
1. Introduction
The Brazilian National Sanitation Policy establishes the principles for the provi-sion of public sanitation services, such as water supply, sewage treatment and man-agement of municipal solid waste (MSW) [1]. The proper disposal of solid waste is intrinsically linked to the preservation of the environment and public health [2]. It has been identified that the waste production in Brazil is growing in greater proportion than the population [3]. Thus, the proper final disposal of MSW is of great importance, because the environmental cost of inadequate provision is re-lated to the contamination of soil, groundwater and atmosphere [4].
The Brazilian National Solid Waste Policy—PNRS (2010) establishes that just the untreatable solid waste must be disposed of in landfills, in order to minimize environmental impacts and prevent damage to public health [5]. According to PNRS the disposal of MSW in open dumps and uncontrolled landfills should have ended by the year 2014; however, this did not happen. About 3344 Brazili-an cities still have their solid waste disposed of in inappropriate places [6]. The improper disposal of solid waste brings imminent danger to public health, be-sides being related to recurrent phenomena in Brazil, such as floods and landslides.
In Brazil, few landfills are properly managed, and the risks of natural disasters in these places are not taken into consideration. The problem gets worse when solid waste is disposed of in inappropriate places such as hillsides, due to the fact that the natural process of MSW decomposition causes instability on the ground surface. With the occurrence of heavy rainfall and human interventions, the soil becomes unstable and susceptible to landslides, which heightens the erosion and displacement of soil sediments in rivers, increasing the probability of flooding and consequently the population vulnerability to disaster risk [7].
According to the Brazilian National Civil Defense Policy, disasters are the re-sult of damaging effects, which can be caused by natural or human processes on a vulnerable ecosystem, resulting in economic, social and environmental damage [8]. The intensity of the disaster depends on the magnitude of the event and vul-nerability of the system. Natural disasters caused by floods and landslides are some of the main problems. Every year property and human life losses happen in sev-eral Brazilian cities [9].
DOI: 10.4236/jwarp.2017.911079 1215 Journal of Water Resource and Protection victims [13].
Land mass movements involve materials that cover the slopes surfaces, such as rocks, vegetation and soil. These processes are called landslides and occur in high land and mountainous regions, especially those where the climate is very wet, such as South and Southeast Brazil. Mass movements are natural processes that can be intensified by the indiscriminate growth of urban occupation in in-appropriate places without land use planning [11].
Landslides are a major geomorphological risk and Brazil is among the top ten countries affected by this kind of natural disaster in the world. Under this cir-cumstance, the decision makers need tools and instruments to know the risks in certain areas and, therefore, take preventative measures [14]. This study aims to identify the susceptibility of landslides and flooding hazard in municipal solid waste final disposal sites in the state of São Paulo, Brazil. It uses spatial analysis methods and statistics to consider classes of probability of these hazardous events.
2. Description of the Study Area
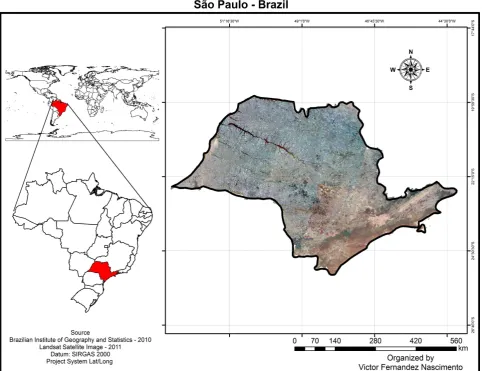
São Paulo state is the most populous Brazilian state, with approximately 44,396,484 inhabitants in 2015 living in an area of 248,222.362 km2 [15]. São Paulo is also the biggest producer of municipal solid waste (MSW), generating 39 thousand tons per day [16] (Figure 1).
3. Methods
The materials used for the development of this study were flood and landslide hazard maps, published by the Environment Department of the State of São Paulo in partnership with the FUNCATE and the Geological Survey to identify the ba-sic unit compartments of the phyba-sical environment [17].
To prepare the flood map, São Paulo (2014) calculated the flood hazard index using (Equation (1)):
(
)
_INU =0.4 * 1− +0.3* +0.3*
P SL DD HS (1)
where: SL = Slope; DD = Drainage Density; HS = Hydric Surplus.
To prepare the landslide map, São Paulo (2014) developed the landslide hazard index based on five equations for different slope scenarios (Equations (2)-(6)):
Scenario 1—Slope between 0˚ - 6˚ _ESC =0.8* +0.05* +0.05* +0.05* +0.05*
P SL TR DD HS FI
(2)
Scenario 2—Slope between 6˚ - 12˚ _ESC =0.5* +0.125* +0.125* +0.125* +0.125*
P SL TR DD HS FI
(3)
Scenario 3—Slope between 12˚ - 18˚ _ESC =0.2 * +0.2 * +0.2 * +0.2 * +0.2 *
P SL TR DD HS FI (4)
Scenario 4—Slope between 18˚ - 24˚ _ESC =0.5* +0.125* +0.125* +0.125* +0.125*
DOI: 10.4236/jwarp.2017.911079 1216 Journal of Water Resource and Protection Figure 1. Map of the state of São Paulo, Brazil. The figure represents the location of Brazil in the globe and the São Paulo state location in Brazil.
Scenario 5—Slope upper than 24˚ _ESC 0.8* 0.05* 0.05* 0.05* 0.05*
P = SL+ TR+ DD+ HS+ FI (6)
where: SL = Slope; TR = Temperature Ranges; DD = Drainage Density; HS =
Hydric Surplus; FI = Foliation Intensity.
In the flood and landslide hazard maps, São Paulo (2014) divided the danger level into six classes P0 to P5, where P0 is a null probability and P5 is the maxi-mum probability of the hazardous event occurring. The P0 class was set accord-ing to geomorphological criteria. For example, on the landslide hazard map the flat areas were classified as P0, likewise, the steep areas on the flood hazard map were classified as P0. The definition from the limits of P1 and P5 classes was set following the method of Natural Jenks breaks and were classified as follows: P1 (Very Low), P2 (Low), P3 (Medium), P4 (High) and P5 (Very High).
DOI: 10.4236/jwarp.2017.911079 1217 Journal of Water Resource and Protection cities use consortia to dispose solid waste, there are currently 420 final MSW disposal sites cataloged and evaluated by CETESB in 2015.
After visual assessment through RapidEye satellite images for the years 2013 and 2014, provided by the Ministry of Environment (MMA), it was found that some of the waste disposal sites were dislocated. So the points were edited visually on the images to correct location errors, and the areas of the sites were defined.
The spatial analysis was performed with the ArcGIS 10.2 software, by overlay-ing the hazard maps (landslide and flood) and the disposal municipal solid waste areas assessed by CETESB. Thus, it was possible to conduct a spatial analysis to check where the landfills are included in each hazard class of landslide/flood maps and classified statistically how much municipal solid waste is disposed of in susceptible areas.
4. Results and Discussion
This section presents the spatial and statistical results for the municipal solid waste disposal sites in each class of flood and landslide hazard maps.
4.1. Landslide Hazard in Municipal Solid Waste Disposal Sites
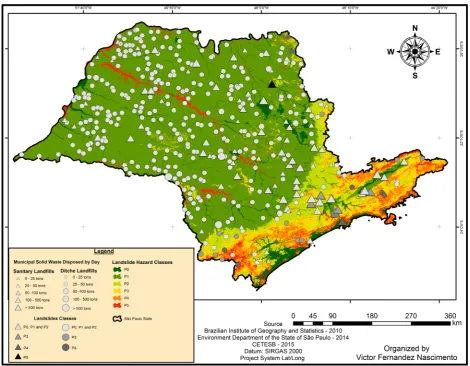
In order to evaluate the landslide hazard susceptibility of municipal solid waste disposal sites in São Paulo state (Figure 2) we developed a spatial and statistical analysis for each hazard class.
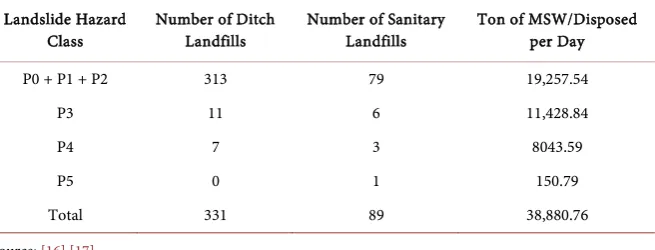
[image:5.595.211.539.537.662.2]It may be noted that the landfills on the Northwest are less susceptible to the danger of landslide than the ones on the Southeast, closer to the Mantiqueira/Mar mountain range. It is observed that 392 landfills are inserted in null, very low and low hazard landslide classes (P0, P1 and P2, respectively); six sanitary landfills and 11 ditch landfills1 in the medium hazard landslide class (P3); three sanitary land-fills and seven ditch landland-fills in the high landslide hazard class (P4) and only one sanitary landfill in a very high hazard landslide class (P5) (Table 1).
Table 1. Municipal solid waste disposal sites in the state of São Paulo according to hazard landslide class.
Landslide Hazard
Class Number of Ditch Landfills Number of Sanitary Landfills Ton of MSW/Disposed per Day
P0 + P1 + P2 313 79 19,257.54
P3 11 6 11,428.84
P4 7 3 8043.59
P5 0 1 150.79
Total 331 89 38,880.76
Source: [16] [17].
1Ditch landfills, is a confining technique of disposal municipal solid waste on the ground without
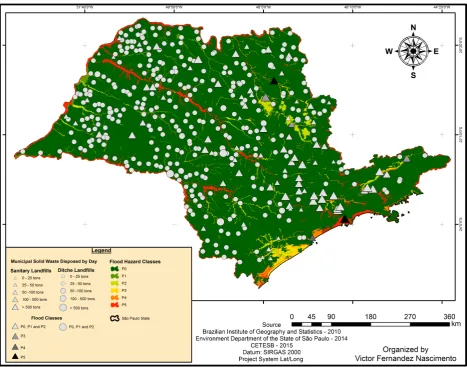
DOI: 10.4236/jwarp.2017.911079 1218 Journal of Water Resource and Protection Figure 2. Map of landslide hazard in MSW disposal sites in the state of São Paulo, Brazil. The quantity of municipal solid waste disposed by day is in tons, in ditch and sanitary landfills, is represented by circles and triangles respectively. The more waste is disposed, the bigger is the geometric forms. Ascending order of landslide classes are indicated in ascending order of grayscale. The map also contains landslides hazard classes, which are represented by color scale.
In São Paulo state 5.4% of the ditch landfills and 11.2% of the sanitary landfills are located in higher classes of hazard landslide (P3, P4 and P5). If we just con-sider the five largest landfills (São Paulo*, São Paulo**, Mauá, Caieras and San-tos) they receive together 17,896.67 tons of MSW per day, which is 46% of all MSW disposed of in the state (Table 2).
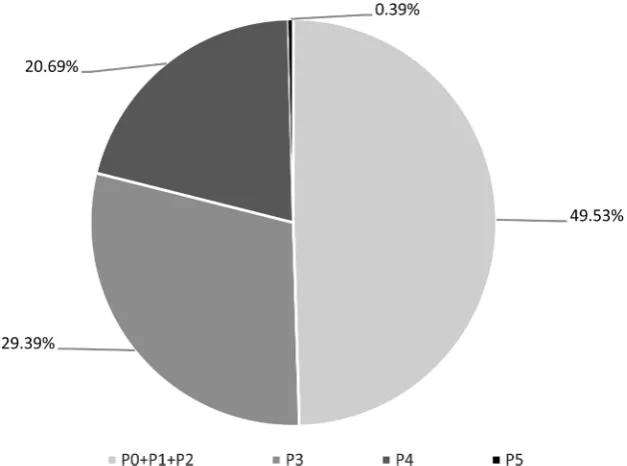
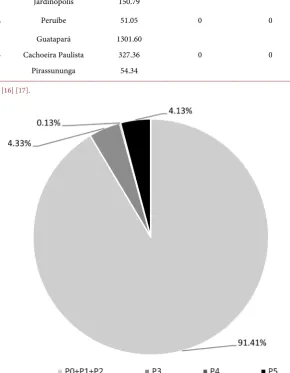
Ditch landfills, which are usually the smallest, located in medium, high and very high landslide hazard classes (P3, P4 and P5) receive daily 76.74 tons of municipal solid waste. Sanitary landfills, which are usually the large ones, also located in these same hazard classes P3, P4 and P5 receive daily 19,546.82 tons of solid waste. Together, sanitary and ditch landfills receive approximately 19,624 tons per day, accounting 50.5% of the total municipal solid waste disposed of in susceptible landslide hazard areas in São Paulo state (Figure 3).
4.2. Flood Hazard in Municipal Solid Waste Disposal Sites
DOI: 10.4236/jwarp.2017.911079 1219 Journal of Water Resource and Protection Table 2. Municipal solid waste disposed of in landfills that are in middle, high and very high classes (P3, P4 and P5) of hazard landslide.
Classes Sanitary Landfills MSW/Day (tons) Ditch Landfills MSW/Day (tons)
P5 Jardinópolis 150.79
P4
São Paulo**
Santos Juquia 6550.00 1454.82 8.59 Apiaí Igaratá Cristais Paulista
Barra do Turvo Rifaina Natividade da Serra
Redenção da Serra
12.82 5.16 4.17 2.26 2.20 1.99 1.58 P3
São Paulo*
Mauá Caieras Itapevi Jambeiro Santo André 5676.56 2585.55 1629.74 777.15 507.92 205.70 Piquete Itariri Divinolândia Pedro de Toledo
Guapiara Nova Campina Tapirai Areias Itapirapua Pta Itaoca Ribeira 9.31 7.42 5.41 5.25 5.06 4.36 4.05 1.81 1.40 1.27 0.88
Source: [16] [17]. *Landfill located at Av. Sapopemba, n˚ 22,254—CTL. **Landfill located at Estrada Pro-fessor Edmundo Rosset, n˚ 7450—Vila Bela-SP-CDR.
[image:7.595.217.531.460.693.2]DOI: 10.4236/jwarp.2017.911079 1220 Journal of Water Resource and Protection sites in São Paulo State (Figure 4) we developed a spatial and statistical analysis for each hazard class.
When considering the spatial distribution of municipal solid waste disposal sites in São Paulo state, it is observed that most of them, about 414, are on hill-sides or near them, so, in the flood hazard map, these areas are classified as null, very low and low classes, (P0, P1 and P2) respectively. The six remaining are sa-nitary landfills and are allocated as follows: three in medium (P3), one in high (P4), and two in very high flood hazard class (P5) (Table 3).
[image:8.595.65.533.304.671.2]Although most of the municipal solid waste is disposed of in areas of low flood hazard we still have the landfills of Santos, Jardinópolis, Peruíbe, Guata-pará, Cachoeira Paulista and Pirassununga situated in areas susceptible to flooding (Table 4). The other landfills located in middle, high and very high ha-zard classes, (P3, P4 and P5) receive daily 3339.93 tons of municipal solid waste, which corresponds to approximately 8.6% of the total solid waste daily disposal in São Paulo state (Figure 5).
DOI: 10.4236/jwarp.2017.911079 1221 Journal of Water Resource and Protection Table 3. Municipal solid waste disposal sites in the state of São Paulo according to hazard flood class.
Landslide Hazard
Class Number of Ditch Landfills Number of Sanitary Landfills Ton of MSW/Disposed per Day
P0 + P1 + P2 331 83 35,540.83
P3 0 3 1683.3
P4 0 1 51.04
P5 0 2 1605.59
Total 331 89 38,880.76
[image:9.595.205.539.277.396.2]Source: [16] [17].
Table 4. Municipal solid waste disposed of in landfills that are in middle, high and very high classes (P3, P4 and P5) of hazard flood.
Classes Sanitary Landfills MSW/Day (tons) Ditch Landfills MSW/Day (tons)
P5 Santos
Jardinópolis
1454.80
150.79 0 0
P4 Peruíbe 51.05 0 0
P3
Guatapará Cachoeira Paulista
Pirassununga
1301.60 327.36
54.34
0 0
Source: [16] [17].
[image:9.595.230.521.318.692.2]DOI: 10.4236/jwarp.2017.911079 1222 Journal of Water Resource and Protection
5. Conclusions
This study revealed that the majority of landfills in São Paulo state are located in landslide and flood hazard low classes (P0, P1 and P2), 93.3% and 98.6% respec-tively. Although these percentages cover much of the municipal solid waste dis-posal sites, we still have 8.6% of the generated municipal solid waste settled in areas of flood hazard and 50.5% in landslide hazard areas. From these findings, it is noteworthy that some landfills are susceptible to both hazards, such as Santos and Jardinópolis. Therefore, we concluded that in São Paulo state approximately 55% of municipal solid waste, which correspond to 21,357.54 tons per day, are disposed of in susceptible areas for both landslides and flood hazards.
Rain is one of the main factors related to both hazards analyzed in this study. During floods, rivers need to overflow their limits; many of Brazil’s rivers are formed through fluvial systems. During a landslide, in addition to geotechnical conditions of the areas, the accumulated amount of rainfall per time is one of the most important factors. For this reason, the distribution of rainfall is directly re-lated to flood and landslide hazards.
Climate models suggest that in the coming decades, there will be a decrease in the amount of rainfall in São Paulo state, but extreme events, such as heavy rains, will intensify. Therefore, the number of sites that are located in hazardous areas can increase, as the amount of MSW is disposed of in susceptible areas. The use of GIS is proved to be an appropriate tool to carry out this type of analysis, so we recommend that the risk of natural disasters should be taken into consideration in the process of finding landfill areas. Mainly, because, there is a tendency for extreme weather events to increase causing more flood and landslide events and consequently contributing to water scarcity and water degradation.
These results in this study identified the São Paulo’s MSW final disposal sites, which require more attention and control to prevent the occurrence of landslides and flooding. Prevention of these hazards will also reduce the environmental, economic and social consequences inherent to these events. In conclusion, this type of spatial analysis can help to promote the mitigation of these hazards and assist in identifying new areas for siting landfills; and, analysis should take into ac-count the current scenario of water resources and climate change.
Acknowledgements
Uni-DOI: 10.4236/jwarp.2017.911079 1223 Journal of Water Resource and Protection versity, for the support given during this research.
References
[1] Brasil (2007) Lei n.11445 de 5 de janeiro de 2007—Estabelece diretrizes nacionais para o saneamento básico.
[2] Karak, T., Bhagat, R.M. and Bhattacharyya, P. (2012) Municipal Solid Waste Genera-tion, ComposiGenera-tion, and Management: The World Scenario. Critical Reviews in En-vironmental Science and Technology, 42, 1509-1630.
https://doi.org/10.1080/10643389.2011.569871
[3] ABRELPE (2014) Panorama dos resíduos sólidos no Brasil—2013. [Overview of Solid Waste in Brazil 2013.] 114.
[4] Dalmas, F.B., Goveia, S.S., de Oliveira, F.R., do Amaral, C.H. and Macedo, A.B. (2011) Geoprocessamento Aplicado à Gestão de Resíduos Sólidos na UGRHI-11 Ribeira de Iguape e Litoral Sul. [Geoprocessing Applied to Solid Waste Management at UGRHI-11 Ribeira de Iguape and South Coast.] Geociências, 30, 285-299. [5] Brasil (2010) Lei n˚ 12.305, de 2 de agosto de 2010. Institui a Política Nacional de
Resíduos Sólidos; altera a Lei n˚ 9.605, de 12 de fevereiro de 1998; e dá outras providências. Diário Oficial da República Federativa do Brasil; Brasília; Distrito Federal.
[6] ABRELPE (2013) Panorama dos Resíduos Sólidos no Brasil—2012. [Overview of Solid Waste in Brazil 2012.]
[7] Filgueira, H.J.A., Nóbrega, C.C., Gadelha, C.L.M., Barbosa, M.P. and Mendoza, F.J.C. (2013) Deposição final dos resíduos sólidos: Proposta de desenvolvimento metodológico para mitigação de risco de desastres. [Final Disposal of Solid Waste: Proposal for Methodological Development for Disaster Risk Mitigation.] Vsiir-Redisa.
[8] BRASIL (2007) Política Nacional de Defesa Civil. [Brazilian National Civil Defense Policy.] Ministério da Integração Nacional.
[9] Vestena, L., Geffer, E., de Almeida, D.E.F. and Vestena, C.L.B. (2014) Percepção Ambiental Sobre As Causas Das Inundações, Guarapuava/Pr : Em Busca Da Cidade Resiliente. [Environmental Perceptions about the Causes of the Flood, Guarapuava/PR: The Quest for the Resilient City.] Revista do Departamento de Geografia, 28, 280-294. [10] United Nations Office for Disaster Risk Reduction (UNISDR) (2004) Living with
Risk: A Global Review of Disaster Reduction Initiatives. vol. 1, 429 p.
[11] Tominaga, L.K., Santoro, J. and Amaral, R. (2009) Desastres Naturais: Conhecer para prevenir, IG. [Natural Disasters: Knowing to Prevent.] São Paulo.
[12] Carlos Tavares, A. and Silva, A.C.F. (2008) Urbanização, Chuvas de Verão e Inun-dações: Uma Análise Episódica. [Urbanization, Summer Rainfall and Flood: A Epi-sodic Analysis.] Journal of Climatology and Landscape Studies, 3, 39-60.
[13] Guha-Sapir, D., Hoyois, P. and Below, R. (2015) Annual Disaster Statistical Review 2014: The Numbers and Trends. CRED, Brussels.
[14] Silva, E.L.E., Gomes, R.A.T., Guimarães, R.F. and Carvalho, O.A. (2013) Employment of Shallow Landslides Model for Disaster Hazard Management in the City of Vitória-ES. Sociedade & Natureza, 25, 119-131.
https://doi.org/10.1590/S1982-45132013000100010
[15] IBGE (2016) Perfil dos Estados Brasileiros. [Profile of the Brazilian States.]
DOI: 10.4236/jwarp.2017.911079 1224 Journal of Water Resource and Protection
[17] SÃO PAULO (2014) Unidade Básica de Compartimentação do Meio Físico (UBC) do Estado de São Paulo. [São Paulo State Basic Unit of Compartmentalization of the Physical Environment (UBC).] 28.