Munich Personal RePEc Archive
A new method of measuring stock
market manipulation through structural
equation modeling (SEM)
Maxim, Maruf Rahman and Ashif, Abu Sadat Muhammad
Charles Darwin University, East West University
10 October 2017
Online at
https://mpra.ub.uni-muenchen.de/82891/
A New Method of Measuring Stock Market Manipulation through SEM
Maruf Rahman Maxim
Abu Sadat Muhammad Ashif
ABSTRACT
This paper proposes a new model of measuring a latent variable, stock market manipulation. The model bears close resemblance with the literature on economic well-being. It interprets the manipulation of a stock as a latent variable, Q*, in the form of a multiple indicators and multiple causes (MIMIC) model. This approach exploits systematic relations between various indicators of manipulation and between manipulation and multiple causes, which allows it to identify the determinants of manipulation and an index of manipulation simultaneously. The main reason of stock market ma-nipulation comes from the fact that information availability is not universally equal. The mama-nipulation is thus critically linked to the creation, arrival and dissemination of information or rumors/mis-information. Thus, the immediate impact of manipulation is on the time profile of returns, or excess returns, from an asset and the excess volatility of returns in excess of the volatility explained by the fundamentals. In this basic set up, the model used these two variables as the indicators of stock market manipulation. The main intuition of the MIMIC approach is that some variables, or statistics, related to peace are indicators of manipulation, while others signify effects or outputs of causal factors, or inputs, of manipulation. In other words, distinction can be made between causes of manipulation and indicators of manipulation. The causal factors used in this model are classified into five different domains namely pure economic factors as determi-nants of manipulation, labour market conditions, international factors, quality of governance factors and systematic risk factors.
1
I
NTRODUCTIONhe financial world today is far more complex and integrated due to the rapid advancement of technology coupled with trade globalization. The comoplexity of the market however makes it more vulnerable to dif-ferent forms of market manipulation which subsequently creates inefficiency in the market. The true forces of the market, supply and demand cannot completely regulate the price in an inefficient market which harms the legitimate traders in the long run. It is easy to see why manipulation is detrimental to the market, however, quite difficult to define it in words and therefore challenging to observe and measure.
In loose terms, market manipulation would be any deliberate act that disrupts the true market price of a stock. Any effort to create an artificial or misleading price signal can be labeled as manipulation (Goldwasser 1999). A very holistic and well recognized classification of manipulation was given by Allen and Gale (1992) as they cat-egorized manipulation in three major categories; (I) action based manipulation, (ii) information based manipu-lation and (iii) size based manipumanipu-lation. As the name suggests, action based manipulation would be any action taken by the investor or the management of the firm with the intention to manipulate the price. The firm itself has the influence to sway public perception by taking intentional favorable or unfavorable managerial decisions to artificially alter the price (Chatterjea, Cherian & Jarrow 1993). Trading on any inside information or spreading any rumour to influence the market price and capitalize on that is categorized as information based manipulation. Manipulative strategies such as ‘bear raid’ (Vila 1989), ‘pump and dump’ (Pickholz & Pickholz 2001) etc. can be marked as prime examples of information based manipulation. Lastly, as Jarrow (1992) pointed out, large traders due to their size advantage have significant influence on the market. Therefore they can artificially distort the market price with their buying power and can calibrate it in their favor. Such manipulative act can be labelled as
size based manipulation. The definition of punishable manipulation however varies from country to country and it is difficult to give a uniform strict definition that is conformed by all judicial bodies. For example, HKEX (Hong Kong stock exchange) which is Asia’s third largest stock exchange has no clear definition of manipulation in the
Corporations Act 2001 (Cth) (Dionigi et al. 2014). For its latent nature and vague definition across markets, it often gets difficult to empirically prove the existence of manipulation.
Stock market manipulation started getting scholarly attention from early 1990s (John & Narayanan 1997). It’s a growing concern in the emerging Asian markets because they have securities that are very thinly traded and are vulnerable to manipulation. Developed markets are also not free from the insidious influence of manipulation. One of the most regulated markets in the world, ASX (Australia stock exchange) shows empirical evidence of
---
scarce (Armson 2009). For regulatory perspective, the difficulty is that it’s hard to detect manipulation for its latent nature.
This paper tries to give a simple yet practical approach to measuring stock market manipulation using Structural Equation Modelling (SEM). The model can be used to measure the overall prevalence of manipulation across markets. With such comparison, it will be possible to create an index of stock market manipulation which will allow investors to take more informed decisions, especially to those who consider international diversification. The following section of the paper explains the model in detail.
2 The Model
2.1 Quantification of a Hidden Variable: A Brief Introduction to the Well-being Studies as a Detour
The focal point for setting up such a model is to ensure financial well-being of investors. An uninformed investor becoming a victim of stock market manipulation can fall into a situation of financial predicament. There have been documented cases of immense sufferings and even suicide among the victims of manipulative acts, pre-dominantly in emerging markets (Mia 2012). Therefore, this model bears close resemblance with the literature on economic well-being. We hence provide a brief outline of the models used to capture economic well-being as a guidepost for our work. It is imperative to understand that the basic foundation of our approach is close to the evolving literature on the measurement of human well-being. In the existing literature on financial markets, ours is the first attempt to quantify manipulation on the basis of a hidden, or latent, variable.
At the early stage of development, well-being was measured by taking a weighted average of different indicators that are closely related to well-being. There are numerous examples of well-being indices which are based on such measurement approach. Out of them, Physical Quality of Life Index (PQLI), (Morris 1979) and Human Development Index (HDI), (UNDP 1990) are two of the most well-known indices. Both these indices basically try to measure variables that are latent in nature and therefore quantify them observing other visible indicators such as infant mortality, adult literacy, per capita income etc. Another well-known index that fall in this line would be the Human Poverty Index (Sen 1997).
Such approach of measuring a latent variable depends on two very crucial issues, (i) what indicators are chosen to indirectly measure the latent variable and (ii) the arbitrary weight given to each of those indicators. Over the recent years, other improved indices have been proposed that include extensive justification of the variables and indicators included in the model and also the weight distribution.
By studying the construction of these models, it can be concluded that (i) there is no direct method of measuring the underlying concept as it doesn’t manifest itself in quantifiable form (i.e. latent) and (ii) it depicts its presence through multiple indicators as just one indicator is not a true measurement of the underlying concept as a whole. Such line of reasoning is dealt with statistical approaches such as SEM, factor analysis and Multiple Indicators and Multiple Causes (MIMIC). Psychology is a field of study which requires quantification of many latent variables, hence use of latent variable models are quite common. Readers can find some great coverage on (Bollen 1983), (Knott & Bartholomew 1999), (Skrondal & Rabe-Hesketh 2004) and (Muthén 2002).
Out of all the prominent statistical approaches that deal with latent variables, the MIMIC model (Jöreskog & Goldberger 1975) has a very unique property in measuring the underlying concept (i.e. well-being). In its investigation approach, it not only believes that there are observable indicators of the latent concept but also exogenous causal factors (observable) that influence the hidden variable. Now if we consider stock market manipulation in this context, we can see the resemblance as it is also latent in nature, however, portrays the presence through different observable indicators. Simultaneously there are myriad of causal factors that influ-ence the occurrinflu-ence of manipulation. Thus, MIMIC is a perfect fit as a model to our measurement approach of manipulation. More on this is explained in the following section.
2.2The Prototype Index of Manipulation:
variable called market manipulation. More importantly, manipulation is propelled by various unobserved latent causes/variables like economic, legal, regulatory and social conditions, cultural issues, psychological factors (various fears and mania), institutional weaknesses and business climate within a market. The critical point for us to realize is that these latent variables have differential impacts on different indicators of manipulation, so we will need to endogenous the model to measure impacts of these latent variables on the indicators of manipula-tion. What is also extremely important is that a set of exogenous factors, which we term as observed variables in our model, impact on the latent variables, which thereby differentially impact on the indicators of manipulation.
By simultaneously modeling the observed variables, latent variables and indicators of peace in a single framework, we will be able to provide an appropriate mechanism to evaluate various indices of manipulation and from there carry out the “reverse-engineering” to tweak the observed variables to home on equilibrium levels of manipulation as expressed by different indicators of manipulation. The interactions between observed variables, latent variables and indicators of manipulation will be explained later.
2.4 Methodology, Data and Variables
Manipulation is often taken as a proxy for absence of frauds in financial markets and interpreted as a departure from the (market) equilibrium. Financial models came to be cast as general equilibrium models with presumed perfectly competitive product markets in which financial markets act as a conduit for the allocation of scarce resources across sectors. Thus, financial markets are a matching device between savers and investors. In the process of matching, information plays a critical role and substantial profits are made from the timings of pur-chases and sales of stocks. The manipulation is thus critically linked to the creation, arrival and dissemination of information or rumors/mis-information. Thus, the immediate impact of manipulation is on the time profile of returns, or excess returns, from an asset and the excess volatility of returns that can’t be explained by the fundamentals. In our basic set up, we will use these two variables as the indicators of stock market manipulation.
2.5 Manipulation as a Latent Variable: Major Contributions of our Model
We attempt to make two principal contributions: first, we model manipulation of a stock as an unobservable, or latent link, variable between observable causes and also observable indicators. This formulation will help to develop an index of manipulation by reducing the problem of bias, inconsistency, and arbitrary weights. Sec-ondly, from the postulated model we can estimate, compare, and analyse the manipulation indices for major stocks of countries. This will enable us to offer a ranking of stocks in terms of the index of manipulation for each country. We can then aggregate the indices for each country to generate an overall global index of manipulation.
We interpret the manipulation of a stock as a latent variable, Q*, in the form of a multiple indicators and multiple causes (MIMIC) model. This approach exploits systematic relations between various indicators of ma-nipulation and between mama-nipulation and multiple causes. Therefore to construct a model that can address ma-nipulation, we need to first identify the causal factors and the indicators.This subsequently will also enable us to identify the determinants of manipulation and eventually come up with a global index of manipulation. Thus our proposed model resembles (Jöreskog 1970) and (Jöreskog & Goldberger 1975) models of multiple indicators and multiple causes.
In our proposed model, manipulation (Q*) is a function of a vector of causalvariables, X as, Q* = f (X, u), where u is a stochastic discrepancy. The next step is to specify a string of equations to define the observable indicators, Y, that are assumed to be determined by both Q* and other exogenous variables, Z, as Y = g (Q*, Z, v) where v is a vector of stochastic discrepancies in the equations. The latent variable Q*, which is manipulation in the current context can then be measured by observing Y and X, and also observing other exogenous variables, Z. For each stock of a country, we can use a time series of X and Y wherefrom we can calculate Q* for each stock. This can allow us prepare a ranking of each stock within a country as an ordering in terms of the degree of manipulation. By aggregating the index for each nation, it will be possible to offer the ranking of each country in terms of the manipulation of their financial markets.
---
2.6 Methodology
The MIMIC model postulates the latent variable manipulation (Q*) to be a function of the causal factors:
Q*=f(X1, X2...Xn, ε) (1a)
X1, X2...Xn are the causal factors of manipulation and ε is the error term and f (.) is the functional relationship. The MIMIC model also postulates that the vector of indicators of manipulation (Y) is a function of the latent variable Q*:
Y1=G1(Q*, u1) Y2=G2(Q*, u2)
.... (1b)
Ym=Gm(Q*, um)
where G1(.),..., Gmindicate the form of the relationships between indicators and the latent variable Q* and u1 ,...,um are stochastic errors. The MIMIC model (1a)-(1b) represents a set of interdependent structural equations. In order to complete the specification of the model, one will need to specify the form of the interdependent structural equations (1a)-(1b), and one must also specify the form of the probability distribution of the errors u1,u2...um and ε. The linear specifications will lead to the following MIMIC model:
Y = βα'X + (βε+ u) (1c)
Where
Y=βQ*+ε (2a)
Q*=αX+u (2b)
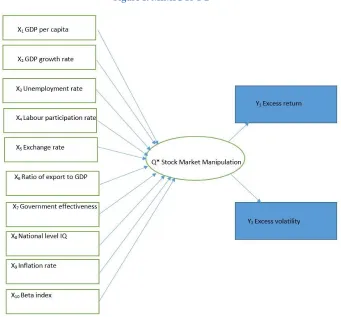
[image:5.612.145.486.393.710.2]Note that (2a) and (2b) are the linearised version of (1a) and (1b) and β is the vector of coefficients to measure the marginal impact of Q* on the manipulation indicators and α is the vector of coefficients that measure the marginal impacts of the “causes of manipulation” on the latent variable (Q*). A graphical demonstration of MIMIC (10-1-2) is given in figure 1.
2.7 Indicators and casual variables of manipulation
The main intuition of the MIMIC approach is that some variables, or statistics, related to consistency are indica-tors of manipulation, while others signify effects or outputs of causal facindica-tors, or inputs, of manipulation. In other words, distinction can be made between causes of manipulation and indicators of manipulation. In the context of MIMIC model, QOL is captured by several imperfect indicators and explained by several economic and social causes. QOL is thus a multidimensional index composed of life expectancy at birth, infant mortality rate, and death rate. In our empirical analysis of manipulation, similar to the construction of QOL index, we consider two indicators of manipulation. The overall manipulation index is a linear combination of these two indicators. The overall index is determined by the interaction of various causal variables. In what follows, we briefly discuss the various dimensions/domains of the causal factors that will be used in the model.
The two major indicators of manipulation that we used in our model are excess return and excess volatility. In general, excess return is defined as any risk adjusted return that is above the return suggested by a pricing model i.e CAPM. A study of 40 incidences of stock market manipulation in Hong Kong Stock exchange revealed the relationship between market manipulation and artificially generated excess return (Gerace et al. 2014). Excess return certainly can be caused by other non-manipulative reasons and is not always an indication of manipula-tion, however, is a major candidate for being one of the observable indicators in our model. Excess volatility on the other hand is fluctuation in the stock price that can’t be explained with the available discount factors and can’t be justified by fundamentals. Excessive market volatility is often considered as a sign of market manipula-tion, specially in emerging markets (Uppal & Mangla 2006). Hence we have included these two imperfect but observable indicators of manipulation in our proposed model.
Domain 1: Pure Economic Factors as Determinants of Manipulation
We have considered the following two economic factors as causal variables for determining manipulation of a stock in a nation, which thereby impacts on its degree of stock market manipulation: GDP per capita and GDP growth. Both these factors have direct and indirect positive and negative effects on manipulation. On the one hand, increasing GDP per capita and GDP growth are expected to increase the opportunity cost of manipulation and thereby lowers manipulation. On the other hand, they can precipitate manipulation if the degree of rivalry between sectors increases.
Domain 2: Labour Market Conditions
We have included the following two factors to capture the state of the labour market, which can influence the overall profitability in an economy and thereby manipulation. They are the unemployment rate and the labour force participation rate.
Domain 3: International Factors
The degree of international integration and the fluctuations in exchange rates can impact on profitability and thereby the incentives for market manipulation. In our work, we consider the exchange rates and the ratio of exports to GDP as causes of manipulation originating in the overseas sectors.
Domain 4: Quality of Governance Factors
---
system, we will use the IQ data of Lynn and Vanhanen as a proxy for quality of governance.
Domain 5: Systematic Risk Factors
In this work, we also need to consider the business confidence as an important factor for determining the legal framework of a country. It is important to note that this is a common environment that each final stock of a country faces. Hence, there is not much point in taking the business confidence as a determining factor. Instead, we choose the beta index of a stock as a measure of underlying risk for each asset, which in turn determines the scope and costs of manipulation.
3 Scope of this model and further research implications:
The model proposed here is at its very rudimentary state, however, it is a new line of reasoning and has the scope to build something much more profound based on this elementary idea. The possibility of coming up with a global manipulation index along the line signifies the wider scope this model has. Such an index will create significant value for the investors, therefore enhancing their financial wellbeing. Nevertheless, much more work is needed to shape this raw idea into something more practical and the work should start from identifying the causal factors and the indicating variables with a thorough review of the literature following this guideline pro-vided by us. Once the model has been refined, some empirical analysis will enable future researchers to initiate the work of preparing country specific index and finally a global index of manipulation.
4 Conclusion
In the existing literature there is a scanty attempt to measure market manipulation since it is difficult to capture and mostly hidden. Hence the operationalisation of an index of market manipulation calls forth measures. It is not an easy task to develop such index and this will be a preliminary attempt. The major problem for any ap-proach to measure manipulation is that it can’t be observed, hence an indirect and systematic apap-proach is needed and this is what we tried to propose in this paper. A similar approach has been used by Dell'Anno (2003) where the author postulated a model to measure shadow economy in Italy which is latent by nature. The pathway from theory to practice is full of obstacles, especially when a latent variable is involved. We only have certain indica-tors of manipulation, which depend on various dimensions of manipulation. This simple observation will allow us to measure manipulation by means of several indicators and constructed as a composite index aggregating all these indicators and causal factors.
References
Allen, F & Gale, D 1992, 'Stock-price manipulation', The Review of Financial Studies, vol. 5, no. 3, pp. 503-529.
Armson, E 2009, 'False Trading and Market Rigging in Australia'(2009)', Company and Securities Law Journal, vol. 27, pp. 11, 411.
Bollen, K 1983, 'A.(1989). Structural equations with latent variables', new york, ny: wiley. doi, vol. 10, p. 9781118619179.
Chatterjea, A, Cherian, JA & Jarrow, RA 1993, 'Market manipulation and corporate finance: A new perspective',
Financial management, pp. 200-209.
Dell'Anno, R 2003, 'Estimating the shadow economy in Italy: A structural equation approach'.
Dionigi, G, Charles, C, Christopher, W & Paul, M 2014, 'Stock Market Manipulation on the Hong Kong Stock Exchange',
Australasian Accounting, vol. 8, no. 4, pp. 105-140.
Ervik, AO 2003, 'IQ and the Wealth of Nations', The Economic Journal, vol. 113, no. 488.
Gerace, D, Chew, C, Whittaker, C & Mazzola, P 2014, 'Stock Market Manipulation on the Hong Kong Stock Exchange',
Australasian Accounting Business & Finance Journal, vol. 8, no. 4, p. 105.
Goldwasser, V 1999, 'Regulating Manipulation in Securities Markets: Historical Perspectives and Policy
Rationales’(1999)', Australian Journal of Legal History, vol. 5, p. 149.
Jarrow, RA 1992, 'Market manipulation, bubbles, corners, and short squeezes', Journal of financial and Quantitative Analysis, vol. 27, no. 3, pp. 311-336.
John, K & Narayanan, R 1997, 'Market manipulation and the role of insider trading regulations', The Journal of Business, vol. 70, no. 2, pp. 217-247.
Jöreskog, KG 1970, 'A general method for estimating a linear structural equation system', ETS Research Report Series, vol. 1970, no. 2.
Jöreskog, KG & Goldberger, AS 1975, 'Estimation of a model with multiple indicators and multiple causes of a single latent variable', journal of the American Statistical Association, vol. 70, no. 351a, pp. 631-639.
Knott, M & Bartholomew, DJ 1999, Latent variable models and factor analysis, Edward Arnold.
Lynn, R & Vanhanen, T 2006, IQ and global inequality, Washington Summit Publishers.
Mia, MAH 2012, 'Origin of & Solution to Global Financial Meltdown: An Islamic View', International Journal of Business and Management, vol. 7, no. 12, p. 114.
Morris, MD 1979, 'Measuring the condition of the worlds poor: the physical quality of life index'.
Muthén, BO 2002, 'Beyond SEM: General latent variable modeling', Behaviormetrika, vol. 29, no. 1, pp. 81-117.
Pickholz, MG & Pickholz, J 2001, 'Manipulation', Journal of Financial Crime, vol. 9, no. 2, pp. 117-133.
Richardson, K 2004, IQ and the Wealth of Nations, Nature Publishing Group, 0018-067X.
Sen, G 1997, 'Empowerment as an approach to poverty. Background paper to the Human Development Report, 1997',
Bangalore, India: Unpublished paper.
Skrondal, A & Rabe-Hesketh, S 2004, Generalized latent variable modeling: Multilevel, longitudinal, and structural equation models, Crc Press.
UNDP, U 1990, Human Development Report 1990: Concept and Measurement of human development, New York: Oxford University Press.
Uppal, JY & Mangla, IU 2006, 'Market volatility, manipulation, and regulatory response: a comparative study of Bombay and Karachi stock markets', The Pakistan Development Review, pp. 1071-1083.