Normatively Framed Relative
Performance Feedback – Field
Experiment and Replication
Brade, Raphael and Himmler, Oliver and Jäckle, Robert
5 September 2018
Online at
https://mpra.ub.uni-muenchen.de/88830/
– Field Experiment and Replication
RAPHAELBRADEa OLIVERHIMMLERb ROBERTJÄCKLEc
September 5, 2018
Abstract
Feedback can help individuals put their performance into perspective, especially when transitioning into a new environment such as university or a different job. In a random-ized field experiment we give first-year university students normatively framed relative performance feedback about their accumulated course credits. We find an increase in subsequent performance, but only when the feedback is positive. Using a regression discontinuity design, we show that the improved performance is not driven by unob-served characteristics of those receiving positive feedback, but that it is indeed due to the positive rather than negative nature of the feedback. We administer a replication experiment with the next wave of first-year students one year later and reproduce the results. Survey data provides suggestive evidence that positive feedback has an effect on behavior when students underestimate their relative performance, and that consis-tent with a mechanism of selective information processing, individuals focus on positive feedback to adjust their beliefs.
Keywords: Relative Performance Feedback, Higher Education, Randomized Field Exper-iment, Replication, Selective Information Processing
JEL Classification:I23, C93
aUniversity of Göttingen, Chair of Public Economics, Platz der Göttinger Sieben 3, 37073 Göttingen, Ger-many. email: [email protected].
bMax Planck Institute for Research on Collective Goods, Kurt-Schumacher-Strasse 10, 53113 Bonn, Ger-many, University of Erfurt, and University of Göttingen. email: [email protected].
cTH Nürnberg Georg Simon Ohm, Faculty of Business Administration, Bahnhofstrasse 87, 90402 Nürnberg, Germany. email: [email protected].
We would like to thank Robert Schwager, Philipp Weinschenk, and seminar participants at the ESA World Meeting, ifo Center for the Economics of Education, Imebess at the European University Institute Florence, Spring Meeting of Young Economists, the University of Augsburg, the University of Göttingen, and the Univer-sity of Nürnberg for valuable comments and discussions. Fabian Escher, Peter Frenzel, Burak Akkaymak, Milad Zargartalebi, and Nadine Gerlich provided excellent research assistance. We gratefully acknowledge financial support from the German Federal Ministry of Education and Research under grant 01PX16003A, 01PX16003B, and administrative and financial support from the TH Nürnberg and the Max Planck Institute for Research on Collective Goods. Jäckle also gratefully acknowledges financial support from the Staedtler Stiftung.
1 Introduction
Whenever individuals enter new environments, such as university or a different job, feed-back can help them appraise their performance. Absolute feedfeed-back, however, is often insuffi-cient to put performance into perspective, because objective benchmarks have not yet been established or are unknown to the individuals, leaving them with no appropriate frame of reference. The resulting uncertainty may compromise motivation, or lead to misguided and non-optimal decision-making, for example when it comes to effort provision. Under such conditions, social comparison theory suggests that information about the behavior of simi-lar others can provide an important benchmark or reference point against which individuals can compare their performance and gauge their abilities (Bandura 1991, Corcoran, Crusius and Mussweiler 2011, Festinger 1954, and Taylor, Wayment and Carrillo 1996). Offering per-formance feedback relative to a suitable peer group may therefore enhance decision-making and motivation, and therefore facilitate an efficient transition into the new environment.
The performance feedback literature largely relies on providing relative feedback in terms of objective information like rank or percentile in the performance distribution.1A
comple-mentary approach is frequently employed in the social norms literature, but has not been explored when it comes to performance feedback:2 the provision of normative feedback.3
Normative frames or injunctive messages can provide cues which make individuals aware of reference points and especially of what type of behavior is approved in a new environ-ment (see e.g., Allcott 2011, Cialdini, Reno and Kallgren 1990, Deutsch and Gerard 1955, and Schultz, Nolan, Cialdini, Goldstein and Griskevicius 2007). We combine objective relative performance information with normative frames to clearly convey what constitutes positive and negative feedback, respectively. There is some theoretical reason to believe that positive and negative feedback have diverging effects on performance, by differentially affecting mo-tivation or because negative information may be discounted (see Bénabou and Tirole 2016 or Golman, Hagmann and Loewenstein 2017). Augmenting objective relative performance feedback with normative messages allows us to separately investigate the effects of these
1Examples for the provision of rankings or distributional information range from workplace settings (e.g., Azmat and Iriberri 2016, Blanes i Vidal and Nossol 2011, Card, Mas, Moretti and Saez 2012, Gibbons and Murphy 1990, or Gill, Kissová, Lee and Prowse 2018) to educational environments (e.g., Azmat and Iriberri 2010, Azmat, Bagues, Cabrales and Iriberri 2018, and Goulas and Megalokonomou 2015) and have shown mixed effects on performance and other outcomes.
2Where we take performance to broadly encompass accomplishments at the workplace, in school or at other productive tasks.
different types of feedback.
Feedback is presumably especially important when the new tasks are complex and chal-lenging, and the stakes are high. An economically and socially important area to which this applies is higher education. Individuals at the start of their academic career may lack infor-mation on how difficult it will be to succeed in complex tasks like passing university exams and how much effort they should expend.4 Additionally, the stakes are relatively large.
Fail-ing exams always comes with a substantial cost in terms of re-takFail-ing classes and psychologi-cal pressures, but at the beginning of study programs this is often exacerbated by certain core exams being prerequisites to continue on with the program. This makes higher education an interesting and relevant setting to test the effectiveness of normatively framed performance feedback.
We conduct a randomized field experiment with a cohort of first-year students at a Ger-man university of applied sciences, and combine relative perforGer-mance feedback on obtained course credits with normative cues. After the first semester exams, control group students receive letters in the mail informing them about how many credits they obtained in the pre-vious semester. Students in the treatment group receive the same information but the letters also inform them about how well they performed relative to the average student and the stu-dent on the 80th percentile.5 This information is augmented with normative messages of
approval for those who obtained at least the average amount of credits. For those below the average the approving normative messages are greyed out. These individuals therefore receive no explicitly disapproving normative framing, but should be aware that their per-formance failed to qualify for an approving message. This design allows us to provide first evidence on the effects of performance feedback by type of feedback. We label the different types of feedback as follows: positive(= above average performance + approving normative message),ambiguous(= average performance + approving normative message) andnegative (= below average performance + no approving normative message).
We provide feedback on obtained course credits. The choice of credits over grades as the feedback dimension is driven by two important considerations. First, for students at the start of their university careers it is likely harder to assess their abilities with respect to how many exams they can take than to assess their ability to obtain good grades (Figure 16 provides
4Among other causes, this may contribute to a large share of students in higher education never obtaining a degree or taking much longer than scheduled to graduate. In the U.S., less than 40% of a cohort entering four-year institutions obtain a bachelor’s degree within four four-years (See the National Center for Education Statistics (NCES), Jan 19 2017, retrieved from http://nces.ed.gov/programs/digest/ d13/tables/dt13_326.10.asp). The U.S. is no exception. In many countries delayed graduation is prevalent, and about 30% of students entering a four-year tertiary education in the OECD do not complete their studies (OECD 2013).
some evidence on this). This is because in contrast to university, high school typically leaves little freedom to vary the amount of exams taken and so students have no experience in this domain. Such situations where individuals lack experience and therefore information are exactly where feedback can be most helpful. Second, obtained credits are an interesting out-come from a policy perspective, as they are not only a measure for academic performance, but ultimately determine time to graduation. Lower time to graduation has substantial pay-offs: on an individual level people forgo income with each semester taken longer to grad-uate, and from a social perspective faster graduation means higher contributions in terms of taxes and payments into the social security systems.6 It is thus not surprising that time
to graduation has started to receive more attention in recent years, possibly triggered by the observation that in many countries students take much longer than scheduled to obtain a degree (e.g., Bound, Lovenheim and Turner 2012, Garibaldi, Giavazzi, Ichino and Rettore 2012, Himmler, Jäckle and Weinschenk (forthcoming), and Leuven, Oosterbeek and Klaauw 2010).
Another important feature of our experiment is that we observe the entire universe of performance, i.e. the results of all exams taken. We thus measure the treatment effect of feedback on overall exam performance and not in a single course (in which case one may find effects simply due to students re-allocating effort between courses). Any positive effects can thus be interpreted as net gains. We give feedback on performance in terms of passing exams (obtained course credits), and expect to find effects in that domain. Yet an important but often neglected question is whether such gains can be had without sacrificing on another dimension. We thus also monitor student grades and dropout behavior, and we consider survey responses on measures of well-being such as life satisfaction and satisfaction with the study program. This allows us to paint a more encompassing picture of the effects of performance feedback on participants’ welfare.
We find that in the second semester (i.e. the first treatment semester), students who re-ceive positive feedback earn about 2.1 credit points (.2 standard deviations) more than the controls. With a regression discontinuity design we make use of the sharp cut-off for posi-tive feedback, and show that the treatment effect is indeed due to the posiposi-tive feedback, and not due to unobserved characteristics of those receiving positive feedback. Negative feed-back has no statistically significant effect on behavior. Neither does ambiguous feedfeed-back. The latter suggests that sending a normative message of approval has no effect without the fundamentals to back it up, i.e. without evidence of above average performance. Finally, we show that students who receive positive feedback maintain the same grade point
age as the controls, indicating that they do not buy gains on one performance dimension with losses on another. Similarly, we find no evidence of students being worse off on the well-being domains we observe.
We administer a replication experiment one year later with the new cohort of first-year students. The design is identical with one small tweak. Because we found effects of positive feedback, we now report the mean instead of the median for the average performance in the feedback letters. Since the performance of many students in the first experiment was ex-actly equal to the median and because the mean is smaller than the median in our data, this enables us to give positive feedback to a larger share of the treatment group (56% vs 37.5% in the original experiment). We reproduce all findings of the original experiment. Most im-portantly, we validate the result that positive feedback significantly increases performance (although the effects are somewhat smaller: 1.7 credit points or .16 standard deviations). This is particularly interesting, because it implies that through the simple design tweak, we can extend the positive effects to also benefit weaker students (who obtain median or slightly below median credits).
In both the original experiment and the replication we find no further performance gain of the treatment groups versus the controls in the third semester. In order to better under-stand these dynamics and the differential effects of feedback types, in the replication ex-periment we gather survey data on the pre- and post-treatment expectations about relative performance. In particular, we investigate two questions: first, do effects depend on whether the feedback provides new or unexpected information, and, second, are the results driven by the different feedback types being asymmetrically processed? We find suggestive evidence that positive feedback is effective when students underestimate their relative performance pre-treatment. Further, a post-treatment survey in the second semester shows that students update their expectations in response to positive relative feedback, and that the expectations of these students are significantly more accurate than the expectations of the controls qual-ifying for positive feedback. At the same time, we see no evidence of updated expectations in response to negative feedback, suggesting that students possibly ignore or disregard such information (although the sample size here is very small and the confidence intervals wide). Finally, in the third semester, the expectations of the controls who would have qualified for positive feedback are almost as accurate as the expectations in the treatment group. This indicates that after a while there is no longer an informational difference between treatment and control group, in line with no further effects of positive feedback in the third semester. In contrast, with negative feedback, neither control nor treatment group improve the accu-racy of their expectations in the third semester – which again suggests that students do not process negative information.
sig-nificant motivational and potentially performance enhancing factor (see Bénabou and Tirole 2002). Individuals may therefore maintain a positive self-assessment by selectively process-ing positive feedback while discardprocess-ing negative feedback.7 This idea is also expressed in Eil
and Rao (2011): individuals who receive negative feedback have little willingness do update their self-concept, whereas people who receive positive information are willing to incorpo-rate the positive news in their future behavior. The finding that positive feedback increases performance is also in line with the models of Ertac (2005) as well as Azmat and Iriberri (2010), who argue that individuals use feedback to update self-perceived ability. Similarly, in the presence of selective information processing, competitive preferences and social norms theory can be aligned with our findings.
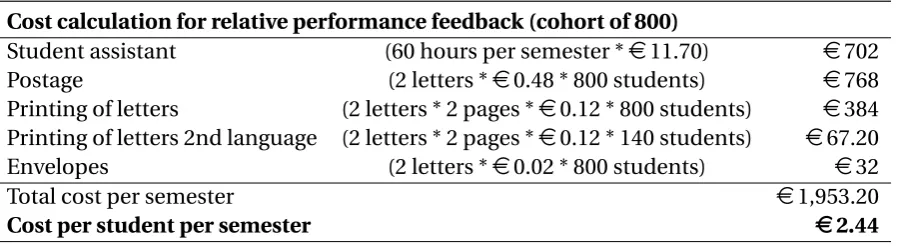
Overall, our results show that identifying information deficiencies and providing norma-tively framed feedback can help individuals who underestimate their abilities. This strategy is not only effective but also inexpensive. The total cost of our measure per semester and student is less thane2.5 (see Table 3). In education contexts, this compares very favorably
to more traditional measures of improving outcomes, such as hiring new faculty in order to reduce class size or grant schemes.8
Relation to the Literature Our findings contribute to the literature on several dimensions. First, we add to the relative performance feedback literature in general. Most of the research in this area is concerned with effects on the performance of employees, and is implemented in the lab or workplace contexts. In lab experiments the subjects are typically asked to com-plete real-effort tasks such as decoding, adding, or multiplying numbers and are given feed-back on their performance (Azmat and Iriberri 2016, Charness, Masclet and Villeval 2013, Eriksson, Poulsen and Villeval 2009, and Kuhnen and Tymula 2012). When it comes to field evidence, the tasks include dispatching goods, picking fruits, and selling clothing or furni-ture (Bandiera, Barankay and Rasul 2013, Barankay 2012, Blanes i Vidal and Nossol 2011, and Delfgaauw, Dur, Sol and Verbeke 2013). The tasks in those studies usually are repeatedly performed over a longer period of time, and the relative performance feedback is introduced
7A strand of the psychological literature has argued that individuals increase their efforts only after receiving positive feedback, and underweight adverse information about themselves (Ilgen, Fisher and Taylor 1979, Ilgen and Davis 2000, and Pearce and Porter 1986). In economics the reasoning is similar: Bénabou and Tirole (2002) argue that individuals choose to selectively remember positive information in order to maintain a positive self-image, whereas in Compte and Postlewaite (2004) individuals put little weight on negative information because they attribute negative outcomes to e.g. bad luck, as opposed to positive outcomes, which are attributed to own abilities or efforts.
at a time when workers are familiar with the task (Barankay 2012, Blanes i Vidal and Nossol 2011, or Delfgaauw, Dur, Sol and Verbeke 2013). We complement this literature by investigat-ing the effects of relative performance feedback in a new environment, where the stakes are relatively high, the task is rather complex, and individuals have little intuition about the un-derlying performance distribution. Furthermore, the performance feedback literature has focused on providing feedback in the form of rankings or distributional information. Our approach of combining this type of information with normative messages is novel in the performance feedback literature. It clearly communicates to the subjects what constitutes (un-)desirable performance and what therefore should be perceived as positive and negative feedback – allowing us to separately analyze the effects of these different feedback types.
More specifically, our results contribute to the scarce literature about relative perfor-mance feedback in higher education, which so far provides mixed results.9 There are two
studies which find that relative feedback on the performance in a practice test or midterm exam improves the outcome of the final exam (Kajitani, Morimoto and Suzuki 2017 and Tran and Zeckhauser 2012). However, two other studies that provide students with infor-mation about their rank in the GPA distribution find zero or negative effects (Azmat, Bagues, Cabrales and Iriberri 2018 and Cabrera and Cid 2017). Our study adds a number of aspects to this literature. First, we provide evidence that feedback type (positive or negative) matters and that positive relative performance feedback increases subsequent performance. Repli-cating the original experiment with a later cohort of students shows that this is a robust find-ing. Second, we are the first to provide relative performance feedback on obtained credits in-stead of GPA; a domain where it is likely hard for students to assess their own ability (as they just entered university), and where it is also likely that they have only little prior knowledge about the performance distribution of others students. Third, by also considering effects on grades we can make sure that the positive effects are not accompanied by students trading off credits and grades. Finally, by observing the entire universe of performance we can check that any effects are indeed net gains, and are not generated by sacrificing performance in other courses (which could be a concern when only observing outcomes in one course).
Furthermore, the results of our study are related to the literature that studies the relation between confidence and performance. Bénabou and Tirole (2002) develop a model in which higher confidence in their abilities motivates individuals to work harder and take benefi-cial risks. Consequently, individuals may engage in confidence enhancing and/or preserv-ing behavior, e.g. in asymmetric updatpreserv-ing of beliefs in the face of good or bad news. Both aspects have been studied empirically. Individuals with higher levels of confidence have
been found to work harder (Puri and Robinson 2007), even in tasks that are unrelated to the source of confidence (Pikulina, Luc and Philippe 2018). Also, individuals do indeed engage in asymmetric updating, depending on whether news are good or bad (Eil and Rao 2011, and Möbius, Niederle, Niehaus and Rosenblat 2014). Our findings are consistent with both aspects. First, we see an increase in performance in response to positive feedback. Second, we observe that individuals correctly revise their beliefs about their expected relative perfor-mance in the face of positive feedback, while there is no evidence they do so when presented with negative feedback. Our field experiments therefore add to the existing literature on the asymmetric updating of beliefs, especially the very scarce evidence from the field. Taken to-gether, the results are in line with the notion that enhanced confidence constitutes the link between positive feedback and increases in performance.
Finally, we contribute to the literature that applies informational nudges in public pol-icy, where the provision of information has been shown to e.g. influence medical choices, advance environmentally friendly behavior, tax compliance, and social benefit take-up (for an overview see e.g., Madrian 2014 or Chetty 2015). In particular, our intervention adds to the strand of research which aims to improve outcomes in higher education by providing information.10 For example, Hoxby and Turner (2013) find that high-achieving, low-income
students attend more selective colleges, when they are given information about the applica-tion process and the net cost of colleges. Castleman and Page (2015, 2016) use personalized text messages to increase the number of individuals that enrol in college among low-income high school graduates, and to increase college persistence, respectively. Wiswall and Zafar (2015a, 2015b) find that students revise their beliefs about expected earnings in response to information about the true population distribution of earnings. The revised beliefs then influence the college major choice of students. Our study shows that the provision of (nor-matively framed) information can be an effective means of targeting performance directly. This complements studies that e.g. try to directly influence student performance via finan-cial incentives (e.g., De Paola, Scoppa and Nisticò 2012 and Leuven, Oosterbeek and Klaauw 2010), by providing a low cost and easily scalable alternative.
The remainder of the paper is structured as follows. Section 2 describes the institu-tional background, data, and design of our two experiments. We discuss different theoret-ical frameworks in Section 3. The empirtheoret-ical analysis is presented in Section 4. Section 5 concludes.
2 Institutional Background and Research Design
Our field experiments take place at one of the largest universities of applied sciences in Ger-many, with twelve faculties and more than 13,000 students. All students in our experiments are enrolled in bachelor’s degree programs at the largest and third-largest faculties of the university: Business Administration and Mechanical Engineering.
2.1 Institutional Background
In order to obtain their degree, students need to acquire a total of 210 credits (ECTS), and the scheduled study duration is seven semesters, i.e. on average they are supposed to obtain 30 credits per semester.11 The study programs follow a modular structure, where credits
are awarded for passed exams. For many, these exams are challenging and complex tasks, especially at the beginning of an academic career. Arguably, they also have a high stakes nature for several reasons. First, passing obviously determines whether or not the student obtains the credits needed to graduate. Second, passing more exams per semester reduces the time to graduation, which typically translates into earlier entry into the workforce and higher lifetime income.12Third, students have to pass certain exams early in their studies in
order to be allowed to continue with the program.13 Fourth, the cost of not passing can be
substantial, both in terms of time as well as psychologically: Students will have to study for the exams again, and potentially have to attend the same classes again in the next semester. On top, failing exams may incur psychological distress.14
Students can at all times access information on their progress via a web portal main-tained by the university. The portal provides data on absolute performance – credits and GPA. It is important to note, however, that in absence of our treatment, the university does not provide any information or feedback on a student’s relative performance.
2.2 Field Experiment I
The original field experiment is conducted with a cohort of first-year students who just started in their bachelor’s programs. Treatment commences as soon as information on previous per-formance is available, i.e. at the start of the second semester. At this point 812 students study
11The European Credit Transfer and Accumulation System (ECTS) is the Europe-wide standardized point system which allows students to transfer their credit points from one European university to another.
12However, since these benefits materialize far in the future, they may not be very salient to students. 13For example, the programs typically include an internship semester and students are not allowed to start the practical part of their education before they have earned at least 60 credit points.
towards degrees in five bachelor programs at the faculties for Business Administration and Mechanical Engineering. Roughly 80% of these students are enrolled in two large programs: Business Administration and Mechanical Engineering (Table 2 provides an overview of all degree programs and the number of students in our intervention).
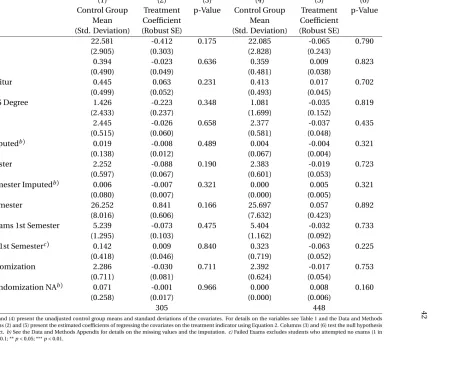
Randomization. Randomization was carried out after the first semester, using stratifica-tion and balancing (see Morgan and Rubin 2012). We applied informastratifica-tion on study pro-grams and obtained accumulated first-semester credits (ACP) to divide students into sepa-rate strata and balanced on age, sex, high school grade, time since high school graduation, pre-treatment grade point average and type of high school degree (only Experiment II).15
The rightmost columns of Table 2 display the fraction of students in treatment and control, by degree program. Tables 4 and 5 show the balancing properties across the control and treatment groups for the full sample and the subsample of students that were eligible to re-ceive positive feedback.
Feedback Letter I. In the week before the second semester lectures start (see Figure 1), students in the control and treatment group receive an unannounced letter in the mail, pro-viding them with information on their accumulated credits (ACP) and their cumulative GPA (AGPA). The envelope bears the official seal of the university, in order to ensure that students will open and read the letter. To further stress the official character, the letters are signed by the dean of the respective faculty. In the few cases where letters came back as undeliverable, we re-sent them via email (N=32).
In both groups the letter states that the faculty "[...] would like to assist you in the further organization and planning of your studies. To this end we provide you with feedback infor-mation about your current academic performance" (see Figures 3 and 4). The control group letter then lists the student’s credits and GPA obtained in the first semester – with no com-parison to fellow students. In contrast, the treatment group letter continues with a graphical illustration that provides relative performance feedback on accumulated credit points. The visualization of this social comparison feedback information is shown in Figures 2 and 3, and we explain the design in detail below. Finally, as in the control group, the letter also quotes the student’s cumulative first semester GPA (with no relative comparison).
Feedback Letter II. About four to five weeks before the exam period, students of the control and treatment group receive a second feedback letter (see Figure 1 and Figures 5 and 6). The letter design is identical to the first letter, and for most students the contained information
will also be identical to the first letter. In some cases the university updated the information on grades and credits (e.g., because course results were not yet available), which can lead to different feedback compared to the first letter.16 Apart from providing the most accurate
information, the purpose of the second letter is to keep the feedback information salient as the exam period draws nearer. Consequently, we base our estimates of the effects of different feedback types on the content of the second letter.
Social Comparison. The visualization of the relative performance information in the treat-ment group can be seen in Figure 2.17A bar chart compares the individual student’s obtained
credits to the “Top 20%” and to the “Average” student enrolled in the same bachelor’s pro-gram and the same semester as the student receiving the letter. “Average” performance is defined as the number of credits obtained by the median student(s), and "Top 20%" refers to the performance of the student(s) on the 80th percentile.
Social comparison theory suggests that perceived similarity increases the tendency to engage in social comparisons (Festinger 1954). In order to increase perceived similarity with and to minimize ‘psychological distance’ to the reference group (compare Trope and Liber-man 2010) we further personalize the relative perforLiber-mance information. We define several comparison groups within each degree program: In smaller programs the comparison group consists of students "who in/before ⟨year⟩earned their school leaving certificate.", where yearequals the year in which the addressee of the letter received their school leaving certifi-cate (this is in the International Business, Business Engineering, and the Energy and Building Services Engineering programs; see Table 2). In the large bachelor programs Business Ad-ministration and Mechanical Engineering, we further decompose the comparison groups by additionally referring to “students who in/before⟨year⟩earnedthe same kindof school leav-ing certificateas you", and we distinguish between the certificates “vocational track degree (or below)” and “general track degree”.
Finally, an important feature of the feedback is that it provides a normative framing of the student’s relative performance. The framing conveys that performing at least at the average level is approved of. It categorizes the students’ performance as “good” (plus one “smiley” emoticon) for students at or above the average, and “great” (plus two “smiley” emoticons) for students in the top 20%. Students below average receive a neutral statement "currently below average" (and no emoticon), and the approving normative messages are greyed out.
We define as “positive feedback” a situation where the student both receives an
approv-16See the Data and Methods Appendix for details on the reasons and the number of observations that are affected.
ing normative framing (“great” or “good”) and the information that they have obtained an above average number of credits, i.e. they are also given fundamentals that match the ap-proving normative framing – this is true for all students above the average. Students on the average receive “ambiguous feedback”: an approving normative statement that is not backed by matching fundamentals, because the student receives information that the ob-tained number of credits is only average.18 Finally, we label the feedback that students below
the average receive as “negative” since they do not see an approving normative framing, and also receive information that their performance was below average.
2.3 Field Experiment II: Replication
We replicate the experiment one year later (N=797, Table 2 provides an overview of all degree programs and the number of students in the replication; Tables 4 and 5 show the balanc-ing properties19). The aim is to establish with a new cohort of students whether the results
are reproducible. Finding credible evidence that results can be reproduced is an important goal of our study, especially given the inconclusive results in the literature and the recent debate about replicability in economics and other fields (Camerer, Dreber, Forsell, Ho, Hu-ber, Johannesson, Kirchler, Almenberg, Altmejd, Chan et al. 2016, Duvendack, Palmer-Jones and Reed 2017, and Open Science Collaboration 2015). The replication experiment uses the same design as the original experiment. The only small tweak is that as a reaction to find-ing performance enhancfind-ing effects of positive feedback in Experiment I (see Section 4.3), we now use the mean instead of the median as the cutoff above which students receive positive feedback. This retains all features of the original experiment while at the same time allowing us to provide 56% of the students instead of 37.5% with positive feedback and reducing the number of students that receive ambiguous feedback from 165 to 29 (because many students obtained exactly the median amount of credits in the first semester and because the mean is smaller than the median for observed credits in the first semester).
3 Theoretical Considerations
This section provides some theoretical intuition on how our intervention may affect behav-ior. As described above, we provide individuals with normatively framed information about
18In one of the smaller study programs in Experiment I, the median coincides with the 80th percentile. 15 students therefore receive feedback indicating that they are in the top 20%, but at the same time their perfor-mance is average. Because they do not meet all our criteria necessary for the label “positive feedback” they are in the “ambiguous feedback” category. Our results are robust to classifying them into the “positive feedback” category.
their performance relative to their peers. Social comparison theory suggests that such infor-mation will set social reference points (e.g., Festinger 1954, Suls and Wheeler 2000, or Wood 1989), and there are several theoretical reasons why individuals may change their behavior in response to reference points established by the feedback.
First, feedback may affect self-confidence and have a positive effect on motivation, thus increasing willpower and perseverance – which can ultimately lead to better performance. In Bénabou and Tirole (2002), positive news serves individuals to maintain a positive self-image, which in turn motivates them. Negative news on the other hand does not adequately enter into beliefs: individuals selectively process good information. In Compte and Postle-waite (2004) the mechanism is similar (but not a deliberate choice of the individual): positive outcomes are attributed to own abilities or efforts. Negative outcomes are attributed to e.g. unfortunate circumstances and therefore do not appropriately depress self-confidence. In both models, the induced optimism and confidence in own abilities can then lead to better performance. Applied to our setting, a lower perceived probability of failure in an exam may lead to higher effort levels and subsequent performance. Beyond this mechanism, confi-dence may also have a direct effect on utility, i.e. individuals may simply enjoy feeling good about themselves (Bénabou and Tirole 2002, Compte and Postlewaite 2004, and Köszegi 2006). This may also be a motivational factor for effort allocation.
The normative framing of feedback with approving messages (or their absence) gives the recipient of the feedback clear indication of when performance should be considered good and therefore is suited to bolster confidence.20 Applied to our setting, for students who
re-ceive good news (positive feedback) the treatment may cause an increase in self-confidence, which helps subsequent performance. On the other hand, the postulated selective process-ing of information suggests that we may not see adverse effects of bad news, i.e. of negative feedback (this potential dichotomy in information processing is closely related to the liter-ature on the disregarding and discounting of negative information, which we also discuss later in this section).
The idea in Bénabou and Tirole (2002), where confidence is manifested as beliefs over ability, is closely related to the models in Azmat and Iriberri (2010) and Ertac (2005). Here, individuals have only incomplete knowledge of their own ability.21Formally, they only know
that their ability is drawn from a normal distribution with known parameters. All individuals
20The approving normative frame should e.g. make it more likely that a very ambitious individual will take performance between the average and the 80th percentile as good news rather than negative information.
then receive a private signal about their performance, which can be used to update beliefs about ability. In our setting one could think of the individually passed exams and obtained credits as this private signal. When relative feedback is given, this signal about the average performance of the other students will additionally affect self-perceived ability by providing information about how hard the task was. It can be shown that if the task was of average difficulty22and under the assumption that ability and effort are complements in generating
performance, students will invest more effort if they receive information that they have per-formed above average, and less effort if they receive information that they have perper-formed below average. In our setting this translates to higher (lower) performance after receiving positive (negative) feedback. Combined with the idea of self-confidence managing individ-uals in Bénabou and Tirole (2002), we may however only see an effect of positive feedback, as the negative feedback may be discarded.
Second, relative performance information can influence the behavior of individuals with competitive preferences. One way to specify these is to include an additive social compar-ison component in the utility function that penalizes individuals for performing below the expected average and rewards them for performing above the expected average (see, e.g. Azmat and Iriberri 2010 or Kandel and Lazear 1992). Following Azmat and Iriberri (2010), relative performance information will increase the precision of the expectation about aver-age performance, and individuals will put more weight on the competitive part of the utility function. The weight should be especially high when the competitive situation is stressed and made salient, as may be the case when normative messages are included. As a conse-quence, we expect treated students to increase performance relative to the control group. Note that this is the case irrespective of a student’s position relative to the reference point.
Third, the reference points in the feedback letter may convey a descriptive social norm, by describing how others behave. The focus theory of normative conduct suggests that indi-viduals try to comply with descriptive norms, predicting positive treatment effects for those below the descriptive norm (Cialdini, Reno and Kallgren 1990 or Cialdini 2011). However, at the same time negative effects for individuals who perform above the norm are implied (labeled a “boomerang” effect in the social norms literature).
The solution suggested in the literature is to add an approving normative message, i.e. an injunctive norm for those who exceed the descriptive norm. This can prevent boomerang effects and sometimes generates additional positive treatment effects (Allcott 2011, Cialdini 2003, Hallsworth, List, Metcalfe and Vlaev 2017, and Schultz, Nolan, Cialdini, Goldstein and Griskevicius 2007). Our normatively framed relative performance feedback can be
stood as such a combination of descriptive and injunctive norms. An important caveat is that this may fail to produce beneficial effects if the two norms are not in alignment (Cial-dini, Demaine, Sagarin, Barrett, Rhoads and Winter 2006). In our case this could mean that the normative message only works if it is aligned with the information of the relative perfor-mance feedback, e.g. if the approving normative message is supported by information about an above average performance. Ambiguous feedback could then possibly result in zero ef-fects because the descriptive norm and the normative message are not aligned. Negative feedback should increase performance, and students who receive positive feedback should keep their behavior unchanged or exert more effort.23
All three mechanisms predict that students who receive positive feedback will increase their subsequent performance, or leave it unchanged. The prediction for negative feedback is less clear. While descriptive norms and competitive preferences suggest an increase in performance, a downward adjustment of perceived ability should lower performance when effort and ability are complements. This ambiguity is further complicated by the above de-scribed potentially selective processing of information when self-confidence matters, and information avoidance in general. Individuals may choose not to receive information at all, or discount negative information (see e.g., Eil and Rao 2011, Grossman and Owens 2012, and Möbius, Niederle, Niehaus and Rosenblat 2014). Potential reasons for this behavior in our context could be disappointment aversion, anxiety, and optimism maintenance (Golman, Hagmann and Loewenstein 2017).24 Hence, it could be the case that students who receive
negative feedback will discount or disregard it. As a consequence, the relative performance information would not set a social reference point for those students, and we would thus expect that they do not change their subsequent performance.
It is important to note that the experiments were not designed with the goal of testing the different mechanisms against each other. In the empirical analysis, we will therefore not be able to pin down what mechanism exactly is driving the results. However, this section has shown that the notion of positive feedback being (weakly) beneficial to performance is common to all of the discussed theories. Consistent with this overarching sentiment, our re-sults will provide robust evidence that positive feedback does indeed increase performance.
23Note that in our case the average performance and the performance of the 80th percentile may both con-stitute descriptive norms. Students below average (negative feedback) are below both reference points, so no matter which norm they pick, the theory suggests positive effects of feedback. Similarly, students in the top 20% are above both reference points and the approving framing should prevent boomerang effects and pos-sibly even generate performance gains. Students above average and below the 80th percentile may choose a reference point above or below. The predictions differ depending on this choice: positive effects if they choose the higher reference point, and a possible boomerang effect if they choose the lower reference point. However, since they also receive a normative message of approval, we expect zero or positive effects in either case.
In our field experiments we find no evidence of negative feedback significantly affecting be-havior in any direction. This may be because multiple mechanisms work in different direc-tions, or because individuals discount negative information. We will provide some tentative evidence pointing to the latter.
4 Results
In this section we first present our data, specifications, and the main findings. We then in-vestigate drivers of the effect and potential mechanisms, as well as the effects of repeated treatment.
4.1 Data
We use anonymized administrative student-level data provided by the university. As de-scribed in Section 2.1, students received feedback based on the accumulated credits (ACP) and their cumulative GPA (AGPA) and we used those variables together with demographic information for the randomization. The administrative data is augmented by four online surveys.
For the empirical analysis, we use exam-level data instead of the cumulative figures. This provides more accurate information on student performance in each semester and as ex-plained in the Data Appendix it is also the more conservative approach.25Our main outcome
of interest is the number of obtained credits.26 In auxiliary analyses, we will also investigate
potential effects on other domains such as the number of attempted and failed exams, GPA, dropout, and well-being. Failed exams are conditional on attempting at least one exam, the GPA is based on passing grades, and we elicited the measures of well-being with online surveys (see Figure 1 and Table 21 for the timing and response rates of the surveys and Ta-ble 18 for the questions and the variaTa-bles used in the estimations). As shown in the next section, we use demographic information and baseline outcomes (first semester credits and first semester GPA) as covariates in our estimations (see Table 1).
25The Data and Methods Appendix provides an example, and a detailed discussion of the differences between the accumulated and the exam-level figures.
4.2 Estimation
Unless otherwise specified, we provide intention-to-treat (ITT) effects from OLS estimations that compare the average outcomes of the control and the treatment group.
The baseline specification is:
Yik=α0+α1Tr eat menti+εi, (1)
whereYik denotes the level of outcome measurek for individuali. Tr eat menti is an
indi-cator for being randomized into the treatment group.
In the second specification we follow the recommendations of Bruhn and McKenzie (2009) and control for the method of randomization:
Yik=α0+α1Tr eat menti+siα2+εi, (2)
The vectorsiincludes strata fixed effects which control for the random assignment of
treat-ment and control units within blocks. Strata are defined by study program dummies and accumulated credits. In the estimation with pooled data from both experiments we also in-clude cohort fixed effects and their interactions with the other strata variables.
For the third specification, we add a vectorxiwhich includes covariates that capture
stu-dent ability:
Yik=α0+α1Tr eat menti+siα2+xiα3+εi. (3)
The vector contains the high school GPA and the first semester credits (description of vari-ables in Table 1).
In the fourth specification, we add a vectorziof additional control variables:
Yik=α0+α1Tr eat menti+siα2+xiα3+ziα4+εi. (4)
It includes the age at randomization, an indicator for being female, the time since high school graduation, and an indicator for the type of high school degree.
Lastly, we estimate a fifth specification in which we control for the baseline GPA (GPA first semester):
Yik=α0+α1Tr eat menti+siα2+xiα3+ziα4+α5B asel i neGP Ai+εi. (5)
in the sample, we impute values of the first semester GPA for students with a missing GPA.27
4.3 Effects of feedback types on performance
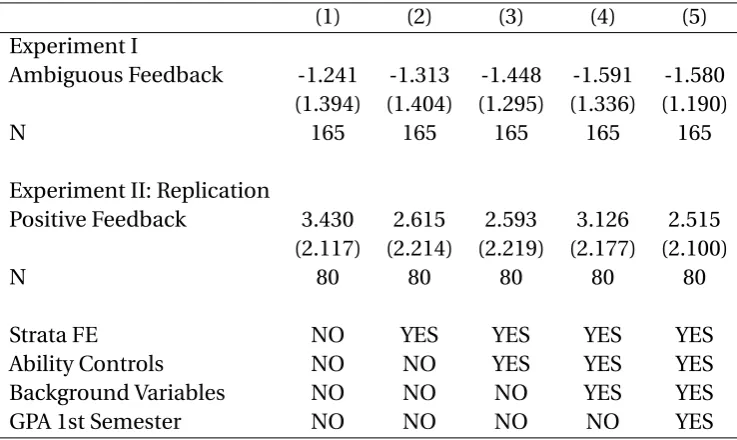
Field Experiment I. The top panel of Table 6 shows that across all types of relative per-formance feedback, the treatment group obtains on average roughly .6 additional credits (Column 1). This effect is not statistically significant, and if anything, adding the control variables in Columns (2) to (5) reduces the estimated effect.
Based on the theoretical considerations in Section 3, we are interested in whether differ-ent feedback types lead to differdiffer-ent behavioral responses. As explained in Section 2, studdiffer-ents below the average received negative feedback, while students above the average received positive feedback. Column (7) shows that students who received positive feedback perform significantly better than the control group counterparts (who would have also received pos-itive feedback had they been allocated to the treatment group): they obtain on average 2.4 credits more. Adding covariates in Columns (8) to (11) reduces the effect to about 2.1 credits, which corresponds to an effect size of roughly .2 control group standard deviations.
Columns (5) to (8) in Table 7 show that among the students receiving positive feedback, those who range at or above the 80th percentile do not react as strongly to the treatment as those students between the 50th and 80th percentile. How positive feedback affects the dis-tribution of the outcome variable can be seen in the top panel of Figure 8, which shows the density of standardized credits for individuals receiving positive feedback in the treatment group and individuals eligible for positive feedback in the control group. Credits are stan-dardized within study programs in order to make the distribution of the outcome variable comparable between the different study programs.28 The distribution is left-skewed in the
treatment and the control group, but more so in the treatment group. The reason is that pos-itive feedback predominantly moves up students from the bottom part of the distribution. At the same time there appears to be no treatment effect for the top part of the distribution. We analyze this more formally in the top panel of Figure 9, which depicts the coefficients of simultaneous quantile regressions (QR) for the 10th to the 90th percentile of the credits (us-ing the set of controls from Equation 5). The OLS estimate is also depicted for comparison, and the figure shows a clear pattern: While the QR estimates are roughly the same as the OLS estimate for the first five deciles, the QR estimates decrease for the upper deciles. This shows that there are indeed no effects of positive feedback for the individuals at the top of the credit point distribution.
27See the Data and Methods Appendix for details.
The heterogeneous effects of positive feedback across the distribution of the outcome variable could arise from ceiling effects if students are only capable of passing a certain num-ber of exams per semester. The curriculum may also generate “artificial” ceilings if students do not go beyond the 30 credits per semester that are on average required to graduate on time.
While positive feedback has large and statistically significant effects, the same is not true for other types of feedback. Table 7 shows that negative feedback (Columns 1 and 2) has no significant effect on subsequent performance. Students whose achieved credits exactly match the average receive ambiguous feedback, i.e. approving framing plus descriptive data which shows that their performance was average. Interestingly, the coefficient is negative, albeit not statistically significant (Columns 3 and 4). We further investigate the effects of ambiguous treatment in Section 4.5.
The finding that positive feedback leads to an increase in subsequent performance is broadly consistent with the theoretical mechanisms discussed in Section 3. We find no ef-fect of negative feedback, which is in line with the literature if either multiple mechanisms are relevant and work in different directions (within or across individuals), or if individuals discount or discard negative information, e.g. in order to preserve their self-concept. We will provide tentative evidence for the latter in Section 4.6.
Field Experiment II: Replication. In order to validate the results we found in the original experiment, we replicate our study one year later with a new cohort of first-year students. Our prediction for the replication was that there would again be an effect of positive feedback on performance, and no significant effects of the other feedback types. The middle panel of Table 6 shows the results for the replication experiment. The estimated treatment effects for the entire sample in Columns (1 to 5) are very similar to the original experiment. More im-portantly, we replicate the result that receiving positive feedback significantly increases per-formance (Columns 7 to 11). This is not only interesting because the positive feedback again generated performance-enhancing effects, but in particular because the minimal change in design now extends the positive effects to a number of weaker students (who obtain median or slightly below median credits). Although the differences in treatment effects across origi-nal experiment and replication are not statistically significant, it appears that the effects are somewhat smaller in the replication study. Even so, positive feedback increases performance by 1.7 credits, or .16 control group standard deviations.
again see only small effects for the top part of the credit distribution.
The patterns for the other subgroups in Table 7 are also comparable. Again, we find no significant change in performance with regard to negative feedback (though the coefficient is negative). For the few people who still obtained exactly the average number of credits (N=29), we again find an insignificant negative coefficient.
Pooled results. Because the two experiments share the same design, we can pool the ob-servations from both cohorts to increase the power of our statistical analysis. The bottom panel of Table 6 presents the results for the pooled sample. As expected, the estimated treat-ment effect lies between the original and replication experitreat-ment at roughly 1.8 credits (.17 control group standard deviations). The estimates are more precise due to the larger sample size, and the effects of positive feedback are statistically significant at the 1%-level.
Overall, the results of the two field experiments provide consistent and robust evidence that normatively framed relative performance feedback leads to an increase in subsequent performance, but only if it is positive. The fact that we are able to reproduce the results is an important feature of our study, especially against the backdrop of inconclusive findings on relative performance feedback in the literature.
Magnitude of the effects. The effect sizes for positive feedback are in the range of .16 to .2 control group standard deviations and correspond to a 6-8% increase in performance rela-tive to the control group. In the literature, the effect sizes for relarela-tive performance feedback are very much context-dependent. Studying the effects of relative performance information for workers, Blanes i Vidal and Nossol (2011) find an average effect of 6.8%. In a lab setting Kuhnen and Tymula (2012) find an increase in output of 12.2%. In education, Azmat and Iriberri (2010) find that the provision of information leads to a 5% improvement in grades and Tran and Zeckhauser (2012) find increases in performance after rank provision of about 10%. Our effects are in the mid-range of these estimates.
that monetary incentives increase the obtained credits of high ability students by about 17%. De Paola, Scoppa and Nisticò (2012) also look at financial incentives, and find that it leads to an increase in obtained credits by .18 standard deviations.
Overall, this tentatively suggests that providing a specific type of feedback – positive feed-back – may be an attractive way of inducing changes in behavior, especially when consider-ing the low cost compared to some of the other interventions just mentioned.29
4.4 Positive feedback or unobserved factors?
So far, we have shown robust evidence that positive feedback substantially improves student performance. One possible explanation could be the following: Students receive positive feedback (or qualify for positive feedback but were allocated to the control group), because they have a higher first semester performance, and are therefore also likely to have on aver-age different underlying characteristics than students who do not receive positive feedback. For example, they may have higher ability and a better learning technology at their disposal, and therefore they may be more able to respond to the treatment. In that case, the positive nature of the treatment may not matter, it could simply be the case that high ability stu-dents react better to relative performance feedback. In the following, we show that higher ability or other unobserved characteristics of students that receive positive feedback cannot explain our findings, and that it is in fact the positive nature of the feedback that changes the subsequent performance.
Similar to Allcott (2011) the design of our feedback intervention allows us to employ a sharp regression discontinuity design (RDD) for the treated students, as receiving positive or negative feedback follows a clear rule. Because here we are interested in the effect of positive versus negative feedback, we exclude individuals that receive ambiguous feedback. When implementing the RDD we follow in large parts the suggestions of Lee and Lemieux (2010). If the usual assumption for RDD holds, i.e. if there are no other discontinuities around the cut-off, it will provide a causal local average treatment effect (LATE) of receiving positive in-stead of negative feedback. To gather some intuition if this assumption is likely to hold, we can look at the behavior of the control group in absence of relative feedback information.30
As running variable we are using the accumulated credits (ACP) a student obtained in the
29Table 3 shows that our intervention has a per student cost of undere2.5 per semester.
first semester, divided by the average ACP of her respective comparison group31 (the
cor-responding distributions for the first experiment are shown in the left panels of Figure 10). Next, the left panels in Figure 11 provide a graphical depiction of the behavior of the outcome variable around the cut-off. For the treatment group we see a notable jump in the second semester credits, while we only observe a small jump for the control group. One explanation for the small jump in the control group could be the exclusion of individuals that receive ambiguous feedback, which could lead to discontinuities in the distributions of unobserved variables that are correlated with the obtained credits in the second semester.32 To estimate
the size of the jumps we implement a parametric RDD, using the following equation:
Yik=α0+α1Pi+f(xi) +f(xi)Pi+siα2+εi, (6)
wherePi indicates if a person receives positive feedback or, in case of the control group, is
eligible to receive it. f(xi)is any smooth function of the running variablexi that we allow
to vary between the left and the right side of the cut-off andsiis a vector including study
program fixed effects and, in pooled estimations, also a cohort fixed effect and its interac-tion with the study program fixed effects.33 The two upper panels of Columns (1) and (2)
in Table 8 provide the estimated coefficients ofα1for the treatment and the control group
using two different discontinuity samples and a first order polynomial. The estimations con-firm the results from the graphical illustration. For the treatment group the RDD indicates that receiving positive instead of negative feedback increases subsequent performance by at least seven credits. However, because of their size, the insignificant estimates for the con-trol group could still suggest unobserved discontinuities around the cut-off. To account for any jump in our outcome variable due to unobserved discontinuities that are the same in the treatment and the control group we estimate the following regression discontinuity difference-in-difference (RD-DID) specification:34
Yik=α0+α1Tr eat menti+α2Pi+α3Tr eat mentiPi
+xi+xiTr eat menti+xiPi+xiTr eat mentiPi+siα4+εi,
(7)
31This provides a smoother distribution around the cut-off than using the raw distance to the cut-off, because of differences in the credit point distributions within the different comparison groups.
32Another reason for a jump in the control group outcome at the cut-off could be that students share the content of the letters with each others, which could create spillovers. Observing no jump for the control group would therefore indicate that this is either not the case, or that there are no effects from this spillover on control group behavior.
33We do not include the vectorx
i,zi, and the baseline GAP as covariates, as this can make it difficult to
differ-entiate between an inappropriate functional form and discontinuities in the covariates (see Lee and Lemieux 2010).
where we are interested in the parameterα3. The results for this specification are shown in
the bottom panel of Table 8. The coefficients in Column (1) and (2) indicate that there is still an effect of receiving positive instead of negative feedback, though the effect loses much of its significance.
As before, we can study the robustness of those findings by looking at the results for the second experiment. Using the mean as a cut-off leads to some differences. The right panel of Figure 10 shows that larger parts of the distribution are now above the cut-off, in part because the median of this distribution lies above the mean. Moreover, there are now far fewer stu-dents that receive ambiguous feedback, and therefore, less observations are excluded from the analysis. The results of this can be seen in the RDD plots in the right panel of Figure 11. The jump for the treatment group is larger in the second experiment and we do not observe any jump for the control group, which suggests that it is indeed the higher number of ex-cluded individuals that leads to the jump in the control group of the first experiment. The corresponding estimates of Equations 6 and 7 are shown in Columns (3) and (4) of Table 8 and they confirm the results from the first experiment.
Columns (5) and (6) of Table 8 show the results for the pooled sample. The higher num-ber of observations also allows us to show that the estimated coefficients are robust to dif-ferent polynomial specifications and discontinuity samples (Table 9).35 As an additional
ro-bustness check, Figures 12 to 15 depict the behavior of pre-treatment covariates around the cut-off for the two experiments. Many of them behave smoothly. In the cases where we do observe discontinuities, they behave very similar in the treatment and the control group. Therefore, Equation 7 should provide credible estimates.
The RDD results provide robust evidence that receiving positive instead of negative feed-back leads to an increase in performance by at least six credits, for a student around the cut-off. This shows that for students of the same underlying ability the type of feedback is crucial for subsequent performance. This is in stark contrast to Allcott (2011), Brent, Lott, Taylor, Cook, Rollins and Stoddard (2017), and Costa and Kahn (2013) who implement simi-lar RDD designs in an environmental context and find zero effects around the cutoff – which they interpret as evidence that varying normative framing alone does not affect behavior. The fact that we find a different effect and reproduce it in another experiment indicates that the context in which relative feedback and normative frames are provided plays an impor-tant role, and that the combination of both should receive more attention in contexts with complex and high-stakes tasks.
Regarding the theoretical considerations in Section 3, the results of the RDD tentatively
indicate that more precise knowledge about one’s ability alone cannot fully explain the in-crease in performance. The RDD minimizes the difference in the credit points to the left and right of the cut-off point, and information updating about one’s ability should lead to a continuous increase in performance. The approving normative framing of above average performance (aligned with matching descriptive information) could generate a discontinu-ous jump in subsequent performance, and if positive and negative feedback have diverging effects on performance, e.g. because negative information is discounted, this could also trig-ger a jump in performance.
4.5 Approving normative framing with(out) matching fundamentals
With the RDD we have shown that receiving positive instead of negative feedback matters for students around the cut-off. The positive feedback consists of two elements that nega-tive feedback does not have: an approving normanega-tive framing and matching fundamentals showing that the student is better than average. This leads to the question of whether the ap-proving normative framing alone can raise performance. The fact that in the original exper-iment we find no effect (even negative point estimates) for students on the median suggests otherwise (these students receive a normative message of approval without the matching fundamentals; see the results in Table 7). However, the lack of positive effects on these indi-viduals may be due to some unobserved underlying characteristic.
The replication experiment allows us to further investigate this. Again, we saw no signif-icant effect and a negative point estimate for students with ambiguous feedback in Exper-iment II (Table 7). But in addition, switching the peer information from the median to the mean in Experiment II allows more insights. We can calculate the median performance, and identify students who under the median rule of the original experiment would have received ambiguous feedback. Because they are now being compared to the mean, and mean credits are lower than median credits in most comparison groups, 80 of those students now receive positive feedback or are eligible to receive it. Assuming that those obtaining median credits are similar across cohorts, we can compare the treatment effect for those on the median in the original experiment with the treatment effect for those on the median in the replication. The only difference between the two groups is that those in the replication are shown funda-mentals that match the approving normative message, and hence receive positive feedback.
with-out the matching fundamentals has no effect on performance. Our results then tentatively suggest that providing the same individuals with matching fundamentals in addition to the normative message of approval may actually turn the zero-effect into a positive effect on performance.
The above finding additionally suggests that competitive preferences alone do not ex-plain our results. Students who receive ambiguous feedback do not improve their perfor-mance. However, unless ambiguous feedback is disregarded, individuals with competitive preferences should exert more effort when the information about the reference group’s per-formance becomes more precise (see e.g., Azmat and Iriberri 2010).
4.6 Expectations and Treatment Effects
As discussed in Section 3 there are a number of theoretical reasons why students might react to feedback. One prerequisite in all considered mechanisms is that the feedback provides new or unexpected information. Therefore, a natural question that arises is how student expectations about relative performance line up with actual relative performance. In the replication experiment, we surveyed students on their expected performance in terms of credits and GPA (Table 11 shows the questions36).
One caveat applies when considering the data from the surveys: the response rates are between 15 and 20% (see Table 21 in the Data and Methods Appendix). Accordingly our sample is rather small, and we find evidence that the respondents are a positively selected subpopulation. It is reassuring that in the subsample we use for the estimations in Table 12 the covariates are overall well balanced between the treatment and the control group (see Table 22).
We first assess how accurately students predict their actual rank in terms of credits and GPA in the pre-treatment semester. The top panel in Figure 16 plots the rank students ex-pected to have in the first semester against the actual rank, in terms of credits. The in-significant rank correlation coefficient of .084 indicates that students have very little intu-ition about their actual relative performance. The bottom panel shows the corresponding figure for the GPA. In this case, the significant rank correlation coefficient of .228 suggests
that students have at least some idea about their actual relative performance in terms of GPA, even before they receive their first grades. This supports our notion that relative per-formance feedback on grades as in Azmat, Bagues, Cabrales and Iriberri (2018) may well have different effects compared to our study, because students already have a better idea about the underlying performance distribution in terms of grades.
The second important question is whether students incorporate the feedback informa-tion into their post-treatment expectainforma-tions. The top panel of Figure 17 displays the share among above average students who correctly expected an above average performance, be-fore and after receiving positive feedback. The left panel supports what we saw in Figure 16. Before our treatment, only around 50% of students eligible for positive feedback cor-rectly expected to perform above average, both in the treatment and the control group. In the semester after the start of our intervention, among above average performers, 87% in the treatment group and 68% in the control group correctly expected to be above average per-formers, and the difference of 19 percentage points is significant at the 5% level. This sug-gests two things. First, those who performed above average learn about their relative perfor-mance, even in the absence of relative feedback. Second, and more importantly, providing students with feedback leads to a stronger update in the expected relative performance.
The bottom panel of Figure 17 shows the share among below average students who in-correctly expected an above average performance. In the first semester, nearly half of these students overestimated their performance. Interestingly, in this case neither the control nor the treatment group appears to update their expected relative performance in the second or third semester. However, the number of below average students who took part in the survey is very low (N in the three surveys is never larger than 30), and this is reflected in the large confidence intervals. We thus very cautiously take this as evidence that students who receive negative feedback do indeed discard or discount the information.
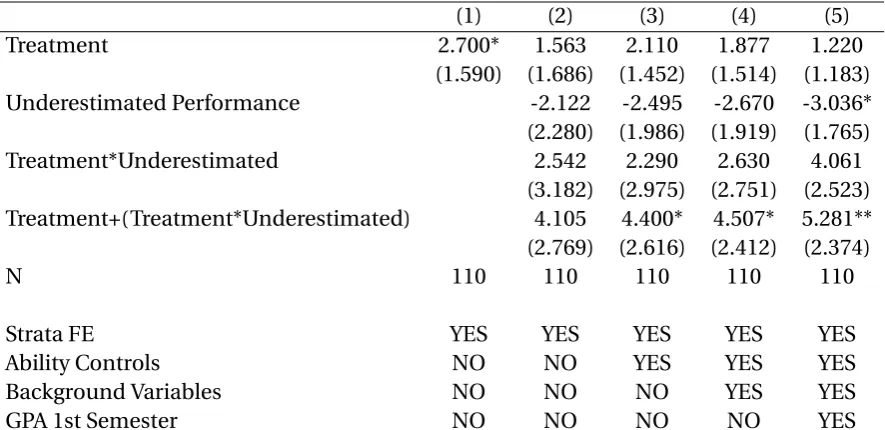
Finally, as discussed in Section 3, we expect that individuals who initially expected to per-form below average respond to positive feedback. These students received new inper-formation, in contrast to students who already expected that they would perform above average. To test if this does indeed affect the treatment effect, we create a dummyUi that is 1 if students