Physiological and Morphological Characterization of Basalt Milkvetch (Astragalus filipes): Basis for Plant Improvement
Kishor Bhattarai, 1 Douglas A. Johnson, 2 Thomas A. Jones, 2 Kevin J. Connors, 2 and Dale R. Gardner 3
Authors are
1Research Assistant, Department of Plants, Soils, and Climate, Utah State University, Logan, UT 84322-4820, USA;
2Plant Physiologist, Research Geneticist, and Plant Physiologist, respectively, USDA-ARS Forage and Range Research Laboratory, Utah State University, Logan, UT 84322-
6300, USA; and
3Research Chemist, USDA-ARS Poisonous Plant Research Laboratory, Utah State University, Logan, UT 84322-6300, USA.
Abstract
Astragalus filipes Torr. ex A. Gray (basalt milkvetch or threadstalk milkvetch) is a legume that is widely distributed in western North America and holds promise for revegetation and restoration programs in the western United States. Seed of 67 accessions was collected in 2003 from Utah, Nevada, Idaho, Oregon, California, and Washington. Field-collected forage samples from these accessions had nondetectable or low levels of selenium, swainsonine, and nitrotoxins. Accessions were evaluated at Providence and Millville in northern Utah in 2005 and 2006. At Providence accessions from north-central Oregon exhibited comparatively high biomass yield in summer and fall during both years.
Basalt milkvetch accessions with low biomass generally had high crude protein concentration. Acid-detergent fiber and neutral-detergent fiber were positively correlated with biomass yield (r 5 0.42, P , 0.0001; r 5 0.57, P , 0.0001, respectively). At Millville accessions from north- central Oregon exhibited comparatively high biomass and seed yield. Seed weight per 100 seeds varied among basalt milkvetch accessions in both years at Millville. Plants at Millville treated with imadicloprid insecticide had greater seed yields than nontreated plants in 2006, but not in 2005. When averaged across sites and years, a high correlation between number of stems and biomass (r 5 0.82, P , 0.0001) indicated that number of stems is a reliable predictor of high biomass and seed yield. Principal component analysis of seven consolidated plant traits identified two principal components that accounted for 60% and 15% of the variation among accessions. The first principal component was negatively correlated with elevation (r 5 20.71, P , 0.01) and positively correlated with latitude (r 5 0.46, P , 0.01). The second principal component was positively correlated with elevation (r 5 0.36, P , 0.01) and negatively correlated with latitude (r 5 20.47, P , 0.01). These results are beneficial in identifying basalt milkvetch accessions that hold promise for plant improvement efforts.
Resumen
La Astragalus filipes Torr. ex A. Gray (basalt milkvetch or threadstalk milkvetch) es una leguminosa que esta´ ampliamente distribuida en el oeste de Ame´rica del Norte y que resulta prometedora para los programas de restablecimiento de vegetacio´n y de restauracio´n en el oeste de los EE.UU. Semillas de 67 accesiones fueron colectadas en el 2003 en Utah, Nevada, Idaho, Orego´n, California y Washington. Las muestras de forraje colectadas en el campo de esas accesiones tenı´an niveles bajos o´ no detectables de selenio, trigoldosir y nitrotoxinas.
Las accesiones fueron evaluadas en Providencia y Millville en el norte de Utah en el 2005 y el 2006. En Providence, las adhesiones de la regio´n norte central de Orego´n exhibieron una alta produccio´n de biomasa comparativa en el verano y el oton˜o durante ambos an˜os. Las accesiones de ‘‘basalt milkvetch’’ con baja biomasa generalmente tienen una alta concentracio´n de proteı´na cruda. La fibra de a´cido detergente y la fibra neutral detergente fueron correlacionadas positivamente con la produccio´n de biomasa (r 5 0.42, P , 0.0001;
r 5 0.57, P , 0.0001, respectivamente). En Millville, las accesiones del norte central de Orego´n exhibieron comparativamente una alta produccio´n de biomasa y semillas. El peso de semilla por cada 100 semillas vario´ entre las adhesiones de ‘‘basalt milkvetch’’ en ambos an˜os en Millville. Las plantas en Millville tratadas con el insecticida imidacloprid tuvieron una mayor produccio´n de semillas que las plantas no tratadas en el 2006, pero no ası´ en el 2005. Cuando promediamos entre los sitios y los an˜os, una alta correlacio´n entre el nu´mero de tallos y la biomasa indico´ que el nu´mero de tallos es un indicador fiable de una alta produccio´n de biomasa y semillas. El ana´lisis del componente principal de siete caracterı´sticas consolidadas de plantas identifico´ dos principales componentes que representan el 60% y el 15% de la variacio´n entre las adhesiones. El primer componente fue correlacionado negativamente con la elevacio´n (r 5 20.71, P , 0.01) y correlacionado positivamente con la latitud (r 5 0.46, P , 0.01). El segundo componente fue correlacionado positivamente con la elevacio´n (r 5 0.36, P , 0.01) y correlacionado negativamente con la latitud (r 5 20.47, P , 0.01). Estos resultados son beneficiosos en identificar las adhesiones de ‘‘basalt milkvetch’’ que resultan prometedoras para los esfuerzos de mejoramiento de la planta.
Key Words: Astragalus filipes, restoration, revegetation, sagebrush steppe, western United States
INTRODUCTION
Legumes in rangelands and pastures fix atmospheric nitrogen in association with rhizobia, enhance plant diversity, and increase the quantity and quality of forage for livestock and wildlife (Becker and Crockett 1976; Madison and Robel 2001).
Legumes may directly or indirectly increase the productivity of associated species in plant communities by releasing symbiotically fixed nitrogen through root exudates, decaying
This research was partly funded by Great Basin Native Plant Selection and Increase Project through the DOI/BLM Great Basin Restoration Initiative and the USDA Forest Service Rocky Mountain Research Station.
At the time of research, the senior author was a graduate student, Dept of Wildland Resources, Utah State University, Logan, UT, USA.
Correspondence: Douglas A. Johnson, USDA-ARS Forage and Range Research Laboratory, Logan, UT 84322, USA. Email: [email protected]
Manuscript received 15 January 2008; manuscript accepted 28 March 2008.
Mention of a proprietary product does not constitute a guarantee or warranty of the product by USDA, Utah State University, or the authors and does not imply its approval to the exclusion of other products.
Rangeland Ecol Manage 61:444–455 | July 2008
plant materials, or mycorrhizal hyphae networks (Rumbaugh et al. 1982; Hogh-Jensen and Schjoerring 2000; van der Heijden et al. 2006). Posler et al. (1993) found that five native legumes grown with three different grasses increased grass yield and protein content compared to grasses grown alone. Legumes generally contain more protein and less fiber than grasses at similar stages of maturity (Cherney and Allen 1995).
Basalt milkvetch (Astragalus filipes Torr. ex A. Gray), also known as threadstalk milkvetch, is a North American legume native to California, Idaho, Nevada, Oregon, Utah, Washing- ton, northern Mexico, and British Columbia, Canada (Isely 1998). Its high seed production and prominence in recently burned areas makes basalt milkvetch a promising species for restoration and revegetation on western rangelands. Its prevalence after fire may be especially important considering the increasing fire frequency on western rangelands (Whise- nant 1990) and the importance of fire as an ecosystem management tool in restoring rangeland function. However, many species of Astragalus are toxic to livestock because of problems related to selenium, indolizidine alkaloids such as swainsonine, and/or nitrotoxins (Williams and James 1975;
Rumbaugh 1983). Although livestock toxicity problems have not been reported for basalt milkvetch, this species needs to be systematically examined for toxic constituents and other important plant traits before plant improvement efforts proceed.
In the present study, we were interested in determining if broad-based collections of basalt milkvetch differ for toxicity, forage and seed production, forage quality, seed mass, and plant morphological characteristics. We were also interested in knowing if seed production in basalt milkvetch could be increased with the application of imadicloprid insecticide. This information is critical in identifying promising basalt milkvetch accessions for plant improvement programs.
MATERIALS AND METHODS
Seed Collections
Seed of 67 accessions of basalt milkvetch were collected along with associated passport data (latitude, longitude, elevation, site characteristics, and associated species) from sites across six western states of the United States (California, Idaho, Nevada, Oregon, Utah, and Washington) during July and August 2003.
Seeds were cleaned and stored in a dark room maintained at 3 uC and 20–25% relative humidity until use.
Selenium Analysis
In June and July 2003, six above-ground stems with attached leaves were harvested at a 2-cm stubble height from 10 individual plants at each of the 67 field-collection sites.
Harvested plants were placed in paper bags and dried in a greenhouse for 2 mo. One stem from each of the 10 individual plants from each seed collection site was pooled into a composite sample and ground (Cyclotec 1093 Sample Mill, Hoganas, Sweden) to pass through a 1-mm diameter screen.
Ground plant samples were analyzed for selenium content at the Utah Veterinary Diagnostic Laboratory, Logan, Utah, by digesting samples in trace mineral grade 5% nitric acid content, which provided a matrix match for the analytical standards.
The prepared samples were analyzed by inductively coupled plasma-mass spectrometry (Perkin Elmer, Waltham, MA) and assessed against concentration curves of known standards.
Standard curves and quality control samples were analyzed every five samples.
Swainsonine Analysis
Swainsonine content was determined from ground plant samples using the method of Gardner et al. (2001). In brief, a 100-mg dried, ground sample was extracted with chloroform and acetic acid. The resulting solution was placed in an ion- exchange extraction tube and mixed, allowing any swainsonine cations to bind to the resin. To remove the swainsonine from the resin, ammonium hydroxide (1 M, 5 mL) was added, mixed for 15 min, and centrifuged. The aqueous ammonium hydroxide sample solutions were capped and stored at 220 uC.
Samples and external calibration standards were then analyzed by liquid chromatography-mass spectrometry (Finnigan MAT, San Jose, CA). Swainsonine peak area was quantified based on external calibration standards and then converted to percentage dry weight of the analyzed plant sample.
Nitrotoxin Analysis
The presence or absence of 3-nitropropanol and 3-nitropro- pionic acid was determined by Fourier transform infrared spectroscopy (FT-IR; Nicolet, Madison, WI; Schoch et al.
1998). In brief, 100 mg of plant sample was weighed into 7-mL screw cap vials, and 4 mL of acetone was added. The samples were capped with Teflon-lined caps, and the samples were mixed by mechanical rotation for 16 hr. Samples were centrifuged, and a 5-mL aliquot was removed with a 10-mL glass syringe for deposition on a KBr microcell for FT-IR analysis. A diffuse reflectance (DRIFTS, Spectra-Tech, Stam- ford, CT) micro-sample cup was filled with powdered KBr to which 5 mL of the acetone extract was added, and then the sample was allowed to dry for 2 to 3 min under a constant flow of ambient air passing through a standard laboratory fume hood. The sample cup was subsequently placed in the DRIFTS apparatus, and infrared spectra were recorded after 16 scans at 4 ? cm 21 resolution. The presence of 3-nitropropanol (3- NPOH) was determined from absorbance at 1 552 ? cm 21 , and 3-nitropropionic acid was determined from absorbance at 1 557 ? cm 21 .
For each composite sample that tested positive for 3- nitroproponal or 3-nitropropionic acid, each of the 10 individual samples from that particular location was reana- lyzed quantitatively to measure the concentration (mg/g NO 2 ) in the individual samples. For quantitative analysis, 100 mg of each sample was extracted with 2 mL of acetone containing 400 mg/mL potassiun thiocyanate (KSCN) for 16 h. The acetone extract was again analyzed by DRIFTS, and the peak area ratio was measured between 1 552 ? cm 21 (3-NPOH) and 2 060 ? cm 21 (KSCN), which was referenced to a calibration curve of known concentration.
Common Garden Studies
During January 2004, the 67 seed accessions of basalt
milkvetch (Table 1) were germinated on moistened blotter
paper and transplanted to cone-shaped plastic containers (4-cm
diameter, 22-cm length) filled with a 3:1 sand:peat moss mixture. The seedlings were grown in a greenhouse at the USDA-ARS Forage and Range Research Laboratory at Logan, Utah (lat 41 u459N, long 110u489W, 1 350 m above sea level) under a day/night temperature regime of about 30/15 uC and were watered and fertilized to maintain growth. After one week of growth, about 5 mm of homogenized sieved soil from the 67 collection sites was added to each seedling container for rhizobial inoculation. In addition, a slurry of common rhizobial inoculum (Astragalus Special No. 1, EMD Crop Bioscience, Milwaukee, WI) was added to each container after about 3 wk of growth.
After about 90 days of greenhouse growth, seedlings were transplanted to field plots at Providence (lat 41u419N, long 111u499W, 1 350 m above sea level) and Millville (lat 41u399N, long 111 u489W, 1 370 m above sea level) located about 2 km and 9 km south of Logan, Utah, respectively. Soil at Providence is a Nibley silty clay loam (fine, mixed, mesic Aquic Argiustolls), whereas soil at Millville is a Ricks gravelly loam (coarse-loamy over sandy or sand-skeletal, mixed, superactive mesic, Calcic Haploxerolls). The experimental design at Providence was a randomized complete block design with six replications. The experimental design at Millville was a split- plot design with an insecticide treatment (described later) applied on three of the six replications as a whole-plot factor with accession as the subplot factor. At both locations plots consisted of five plants of an accession with a 0.5-m spacing within and between rows. Plots were irrigated only during the establishment year after transplanting, except for plants at Millville, which were also irrigated after insecticide application in 2005 and 2006.
Plant height, number of stems, number of inflorescences, winter mortality, and plant vigor score (on a scale of 0 to 9) were determined for each plot at both sites in both years during late May to early June. Dry-matter yield was determined for plants from Providence. Plants at Providence were harvested at a 5-cm stubble height at about 50% bloom (Miller 1984) during 24–27 June 2005 and on 7 June 2006. Regrowth biomass was also harvested at Providence on 17 October 2005 and 18 October in 2006. At Millville biomass was harvested on 2 August 2005 and 8 August 2006 (after mature seed was harvested), and regrowth biomass was harvested on 26 October 2005. Negligible regrowth occurred at Millville in 2006, so regrowth biomass was not harvested in 2006. Plant samples were oven dried at 60uC for 72 h, and then dry weights were determined.
Forage quality was determined for samples from the June harvest in 2005 and 2006 at Providence. Samples were ground (Clycotec 1093 Sample Mill) to pass through a 1-mm diameter screen. Ground samples were analyzed for crude protein by Utah State University Analytical Laboratories using total combustion procedures (LECO TruSpec C/N analyzer, LECO Corp., St. Joseph, MI). Because of limited funds, a subset of ground samples from the 2006 harvest at Providence was analyzed at the Utah State University Analytical Laboratories for acid-detergent fiber (ADF) following procedures of Asso- ciation of Official Analytical Chemists (1990) and for neutral- detergent fiber (NDF) according to Goering and Van Soest (1970), as modified by Mertens (1992) at the Utah State Analytical Laboratories.
Seed production was evaluated at Millville only. Insecticide was applied to evaluate the effect of insecticide on seed yield.
For three of the six replications, Admire 2 (a flowable insecticide with 21.4% of active ingredient imadicloprid, 1- [(6-Chloro-3-pyridinyl) methyl]-N-nitro-2-imidazolidinimine;
Bayer CropScience, Kansas City, MO) was applied on 2 June 2005 at a rate of 47.1 mL per whole plot. Provado 1.6 (a flowable insecticide with 17.4% imadicloprid) was applied on 8 June 2006 at a rate of 58.8 mL per whole plot on three of the six replications. These rates allowed the application of the same amount of active ingredient in each study year. Irrigation was applied after insecticide application to facilitate plant absorp- tion of the insecticide. Seeds were sequentially harvested from mid-July to early August in both years after pods matured. Seed mass was determined from 100-seed samples.
For principal component analysis, a total of 23 measurement variables (two measurements each for plant height, number of stems, number of inflorescences, plant vigor, June biomass, October biomass, crude protein concentration; one measure- ment of winter mortality at Providence; two measurements each for August biomass, seed yield, and seed mass; and one measurement each for October biomass and winter mortality at Millville) for each accession were consolidated into seven new variables. This allowed data of similar traits to be combined into a smaller number of variables. For example, a new single biomass variable was consolidated from seven individual biomass harvests using the first principal component score. In this case, the first principal component described 78% of the variation of the seven individual biomass-related measure- ments. Similarly, the multiple determinations for seed yield, seed weight, crude protein concentration, and plant mortality were consolidated into four new single variables that described 72%, 90%, 71%, and 74% of the total variation of the multiple determinations, respectively. Plant height and vigor score, as well as number of stems and number of inflorescences were consolidated into two new variables that described 82%
and 85% of the total variability, respectively. After these seven new variables were synthesized, a second principal component analysis was conducted.
A geographic distance matrix was created following Larson et al. (2004). Morphometric matrices were created by calculating Euclidean distance between each pair of basalt milkvetch accessions for all the measured variables using SAS (Version 9.0; SAS Institute, Cary, NC). Similar matrices were constructed for elevation, mean annual maximum temperature, mean annual minimum temperature, mean annual precipita- tion, and a combined matrix of the environmental measure- ments.
Statistical Analysis
For Providence, accession was considered a fixed factor and replication a random factor. For Millville, insecticide treatment (whole plot) and accession (subplot) were considered fixed factors and replication a random factor. Analysis of variance was conducted using Proc. MIXED (SAS, Version 9.0) for both experiments. Because insecticide was not applied prior to the collection of morphological data at Millville, the insecticide effect was not included in the model for morphological traits.
Because not all plots produced seeds, there were not sufficient
Table 1. Climatic and geographic information for basalt milkvetch accessions with state, elevation, latitude, longitude, mean annual maximum (Max.) and minimum (Min.) temperatures, and mean annual precipitation (Precip) as well as the first (PC1) and second (PC2) principal component loadings. Means for temperature and precipitation are averages across 30 yr.
Accession State Elevation (m) Latitude (N) Longitude (W)
Temperature
Max. ( uC) Min. ( uC) Precip (mm) PC1 PC2
Af-3 NV 1 476 41 u529 118 u359 14 0 225 20.53385 21.20896
Af-4 WA 519 47u259 118u419 16 3 228 20.93457 22.52689
Af-5 OR 202 45u359 119u569 16 3 258 2.47694 21.53369
Af-6 WA 653 46u569 120u159 18 4 196 20.50762 21.59548
Af-7 OR 1 081 44u229 117u459 14 0 303 0.32306 20.62986
Af-8 OR 1 502 42u569 118u369 15 0 348 0.47202 0.11212
Af-9 OR 1 396 43u079 118u169 16 1 295 20.33238 20.48681
Af-10 NV 1 888 38u369 117u509 19 1 205 20.86801 20.78853
Af-11 CA 1 372 41 u289 120 u569 14 1 575 20.08427 2.12461
Af-12 OR 1 354 43 u399 118 u369 13 22 398 20.26757 0.37222
Af-13 OR 1 315 43 u049 118 u469 15 0 348 0.39124 0.8903
Af-14 OR 1 449 42 u489 118 u499 15 0 348 20.13001 0.34057
Af-15 CA 1 410 41 u369 120 u259 15 0 399 0.00886 0.57917
Af-16 CA 1 530 41 u539 120 u189 15 0 399 20.15627 20.41826
Af-18 OR 1 463 42 u289 119 u479 15 0 399 0.95991 20.11397
Af-19 OR 1 331 43 u269 119 u009 15 0 348 20.2482 0.29499
Af-20 OR 1 617 42 u569 119 u549 16 0 201 20.37104 0.4247
Af-21 OR 1 435 43u109 120u409 13 21 517 20.18806 20.4536
Af-22 NV 2 088 41u049 114u329 15 21 294 20.57277 0.01806
Af-23 OR 1 138 44u109 120u439 16 0 278 20.34503 0.46767
Af-24 OR 1 019 44u099 120u289 14 0 363 20.16667 1.01984
Af-25 OR 1 177 44u039 120u459 16 0 278 20.2312 0.34174
Af-26 OR 699 44 u379 120 u209 13 1 463 0.79079 0.56931
Af-28 OR 611 44 u329 121 u169 14 3 363 20.8317 21.61974
Af-29 OR 687 44 u519 120 u499 14 3 363 1.25961 20.00298
Af-30 OR 443 44 u549 120 u279 13 1 463 2.7939 20.03192
Af-30.1 OR 625 44 u559 120 u319 14 3 363 1.24175 1.0263
Af-31 OR 424 44 u539 120 u269 13 1 463 2.44987 0.65122
Af-32 OR 873 44 u559 120 u159 13 1 463 0.76653 0.61711
Af-33 OR 920 44 u549 119 u429 13 1 463 1.2669 20.31237
Af-34 OR 1 162 44 u409 117 u379 14 0 380 20.42259 20.66264
Af-36 OR 952 44 u269 119 u039 13 22 398 1.07086 0.59326
Af-37 OR 1 152 44u449 119u069 15 1 456 0.48215 20.32229
Af-38 ID 1 653 44u149 112u129 13 21 335 21.39035 0.89813
Af-39 ID 1 628 43u369 113u209 7 24 612 0.10049 20.79893
Af-41 NV 1 774 41u489 115u569 10 22 741 20.16655 0.52549
Af-42 OR 1 250 43u159 117u129 16 0 367 0.43207 20.44493
Af-43 ID 1 717 42 u179 115 u569 10 22 741 20.8206 1.27504
Af-44 OR 1 446 43 u089 117 u289 14 0 444 0.29959 0.15067
Af-45 ID 1 250 43 u269 116 u589 14 0 444 0.15925 20.59896
Af-45.1 ID 1 234 43 u249 116 u599 14 0 444 0.52768 0.62894
Af-46 ID 836 44 u049 116 u389 18 3 253 0.03363 1.1213
Af-47 ID 1 700 43 u089 116 u439 14 0 444 0.43618 20.23343
Af-48 NV 2 347 39 u169 115 u259 17 0 275 21.83386 20.09953
Af-49 NV 2 545 39 u329 114 u389 16 0 296 21.4658 0.75032
Af-50 NV 2 197 39 u359 117 u519 13 0 388 21.12211 20.21836
Af-51 NV 2 376 39 u369 117 u539 13 0 388 21.20427 0.2113
Af-52 NV 2 421 39u199 116u319 17 1 213 21.46704 1.40106
Af-53 NV 2 258 39u199 117u079 17 1 213 20.3722 1.70722
Af-54 NV 2 262 39u159 117u099 17 1 213 20.9122 1.07663
Af-55 WA 692 47u459 119u219 15 3 290 20.87458 22.94979
degrees of freedom to test the insecticide effect on seed mass.
Data were root-transformed when required to meet normality and homoscedasticity assumptions. Significance was tested at a 5 5%, post hoc mean separations were conducted using the Tukey Test, and Pearson correlation coefficients were calcu- lated with SAS using Proc CORREL (SAS, Version 9.0).
Principal component analysis was conducted using Proc FACTOR in SAS (Version 9.0). Relationships between mor- phometric traits and geographic distance, elevation, mean annual maximum temperature, mean annual minimum tem- perature, and precipitation were examined with the Mantel test statistic (Mantel 1967) using the MXCOMP procedure of NTSYSpc (Rohlf 1998).
RESULTS
Selenium, Swainsonine, and Nitrotoxin Content
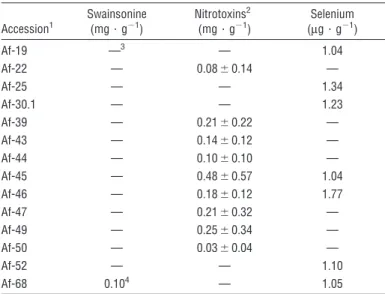
Only Af-68 tested positive for swainsonine, and only 2 of the 10 individual samples of this accession contained detectable levels (Table 2). Similarly, only nine accessions contained detectable levels of nitrotoxins (3-nitro-1-propanol), and all concentrations were low (0.03–0.48 mg/g NO 2 ). Only seven accessions had detectable selenium concentrations that ranged from 1.04 to 1.77 mg/g. All other accessions contained selenium concentrations below 1.00 mg/g.
Forage and Seed Production and Forage Quality
Accessions varied significantly for June and October biomass at Providence in both 2005 and 2006 (Table 3). In 2005 June biomass ranged from 2 to 44 g ? plot 21 , and October biomass ranged from 1 to 69 g ? plot 21 (Table 4). In 2006 June biomass ranged from 2 to 114 g ? plot 21 , and October biomass ranged from 1 to 59 g ? plot 21 . At Millville, August and October 2005 biomass varied significantly and ranged from 4 to 98 g ? plot 21 for August and 0 to 17 g ? plot 21 for October. The short (50-d) time period between the August and October harvests at Millville resulted in negligible growth in October for some
accessions. In 2006 August biomass differed significantly among accessions, ranging from 5 to 147 g ? plot 21 . There was no harvestable biomass in October 2006 at Millville. No significant insecticide effect was observed for biomass yield at Millville. Accessions exhibited positive correlations for biomass production between Providence and Millville (in 2005, r 5 0.52, P , 0.01; in 2006, r 5 0.32, P , 0.01). Accessions collected from north-central Oregon had high biomass, whereas accessions from Nevada, Washington, Utah, and some from Oregon and Idaho consistently produced relatively low biomass across all harvests.
Table 2. Concentration of detected natural toxins in basalt milkvetch accessions.
Accession
1Swainsonine (mg ? g
21)
Nitrotoxins
2(mg ? g
21)
Selenium (mg ? g
21)
Af-19 —
3— 1.04
Af-22 — 0.08 6 0.14 —
Af-25 — — 1.34
Af-30.1 — — 1.23
Af-39 — 0.21 6 0.22 —
Af-43 — 0.14 6 0.12 —
Af-44 — 0.10 6 0.10 —
Af-45 — 0.48 6 0.57 1.04
Af-46 — 0.18 6 0.12 1.77
Af-47 — 0.21 6 0.32 —
Af-49 — 0.25 6 0.34 —
Af-50 — 0.03 6 0.04 —
Af-52 — — 1.10
Af-68 0.10
4— 1.05
1
Basalt milkvetch accessions not listed in this table had no detectable concentrations of swainsonine and nitrotoxins, and selenium concentrations below 1.0 mg ? g
21in the composite plant samples.
2
Ten individual samples were analyzed quantitatively for each basalt milkvetch accession that tested positive in the initial nitrotoxin screening.
3
Dashed lines indicate no detectable concentrations.
4
All 10 individual plant samples were analyzed from Af-68 for swainsonine, but only two samples had detectable concentrations of swainsonine (0.66 and 0.03 mg ? g
21).
Accession State Elevation (m) Latitude (N) Longitude (W)
Temperature
Max. (uC) Min. (uC) Precip (mm) PC1 PC2
Af-56 WA 552 47 u219 118 u289 16 2 367 20.75492 21.89821
Af-58 OR 1 055 44 u249 120 u589 16 0 278 20.32755 21.61933
Af-59 OR 1 317 42 u269 121 u119 15 0 429 20.26867 20.12968
Af-60 CA 1 711 40 u429 120 u539 14 1 575 0.29386 0.75788
Af-62 OR 1 172 44 u179 118 u579 13 22 398 20.00513 1.62868
Af-63 OR 1 501 42 u189 120 u209 15 0 399 20.19073 0.02339
Af-64 OR 1 302 42 u439 120 u439 13 21 517 20.07894 0.27998
Af-65 NV 2 088 41 u049 114 u329 15 21 294 21.16074 20.22797
Af-66 NV 2 499 41u419 117u349 15 1 354 21.08202 20.21238
Af-67 ID 2 080 43u249 113u029 14 0 265 20.7466 21.25157
Af-68 ID 2 201 44u209 113u319 11 25 342 21.09875 0.61636
Af-69 UT 1 874 41u549 113u589 15 0 309 20.6148 0.93949
Af-70 OR 408 44u549 120u269 13 1 463 1.91501 0.15856
Af-75 OR 265 45 u379 119 u439 16 3 258 1.82171 21.98586
Af-76 OR 479 44 u549 120 u249 13 1 463 2.2889 20.09205
Af-77 OR 1 595 43 u269 117 u559 16 1 295 0.08747 0.87534
Table 1. Continued.
Table 3. Analyses of variance of basalt milkvetch accessions for June biomass, August biomass, October biomass, plant height, number of stems, number of inflorescences, plant vigor, crude protein concentration (CPC), seed mass, and seed yield in 2005 and 2006, acid detergent fiber (ADF) and neutral detergent fiber (NDF) in 2006, and the contrast between years (2005 and 2006) at Providence and Millville.
Factor
2005 2006 2005 vs. 2006
df F
1df F
1df F
1Providence
June biomass, g ? plot
2166, 328 7.62** 66, 326 5.04** 1, 4.9 190.84**
October biomass, g ? plot
2166, 328 7.68** 66, 332 6.5** 1, 5 122.89**
Plant height, cm 66, 328 5.33** 66, 328 2.58** 1, 5 0.46
nsNo. of stems 66, 325 8.35** 66, 327 8.32** 1, 5 336.61**
No. of inflorescences 66, 328 3.94** 66, 329 3.98** 1, 5 60.7**
Plant vigor score 66, 327 5.59** 66, 327 3.02** 1, 5 54.76**
CPC, g ? kg
21dry matter 66, 328 3.69 66, 323 4.42 1, 5 0.68
nsADF, g ? kg
21dry matter — — 16, 48 4.47 — —
NDF, g ? kg
21dry matter — — 16, 46 4.22 — —
Millville
August biomass, g ? plot
2166, 316 11.89** 66, 316 10.77** 1, 5 243.63**
October biomass, g ? plot
2166, 322 12.9** — — — —
Plant height, cm 66, 322 4.12** 66, 313 3.92** 1, 5.1 0.04
nsNo. of stems 66, 323 7.65** 66, 314 9.47** 1, 5 1189.4**
No. of inflorescences 66, 325 3.55** 66, 316 4.95** 1, 5.1 517.5**
Plant vigor score 66, 324 3.87** 66, 312 5.41** 1, 4.9 594.2**
Seed mass, g ? 100 seeds
2166, 194 4.33** 66, 251 6.97** 1, 5.1 44.24**
Seed yield, g
Accession (A) 66, 260 3.30** 66, 258 3.44** 1, 5.1 31.78**
Insecticide treatment (T) 1, 260 0.27
ns1, 258 23.42** — —
A 3 T 66, 260 1.12
ns66, 258 1.04
ns— —
1
ns 5 not significant, * 5 P , 0.05, ** 5 P , 0.01.
Table 4. Mean, standard deviation, and range of basalt milkvetch accessions for June biomass, August biomass, October biomass, plant height, number of stems, number of inflorescences, plant vigor score, crude protein concentration (CPC), acid detergent fiber (ADF), neutral detergent fiber (NDF), seed yield, and seed mass in 2005 and 2006.
Measurement
2005 2006
Mean SD Range Mean SD Range
Providence
June biomass, g ? plot
2113 9 2–44 38 24 2–114
October biomass, g ? plot
217 9 1–69 14 11 1–59
Plant height, cm 26 5 16–37 26 4 16–34
No. of stems 4 2 2–10 14 7 4–32
No. of inflorescences 4 3 0–17 19 15 1–82
Plant vigor score 5 1 3–7 4 1 2–5
CPC, g ? kg
21dry matter 140 17 95–179 147 15 118–202
NDF, g ? kg
21dry matter — — — 420 31 361–461
ADF, g ? kg
21dry matter — — — 348 24 308–380
Millville
August biomass, g ? plot
2132 22 4–98 58 34 5–147
October biomass, g ? plot
213 4 0–17 — — —
Plant height, cm 26 4 19–37 29 5 18–36
No. of stems 5 2 2–13 21 10 6–37
No. of inflorescences 4 4 0–30 41 23 2–79
Plant vigor score 5 1 3–7 4 1 2–7
Seed yield, g ? plot
211 2 0–10 3 2 0–5
Seed mass, g ? 100 seeds
210.4 0.1 0.2–0.8 0.5 0.1 0.2–0.7
Accessions differed significantly for crude protein concen- tration in both 2005 and 2006 (Table 3). Crude protein concentration ranged from 95 to 179 g ? kg 21 (mean 5 140 g ? kg 21 ) in 2005 and from 118 to 202 g ? kg 21 (mean 5 147 g ? kg 21 ) in 2006. A relatively small (but significant) negative correlation (r 5 20.23, P , 0.01) was observed between biomass production and crude protein concentration in 2005.
The NDF of accessions varied significantly from 361 to 461 g ? kg 21 (mean 5 420 g ? kg 21 ), and ADF ranged from 308 to 380 g ? kg 21 (mean 5 348 g ? kg 21 ). Positive correla- tions were observed between biomass and ADF (r 5 0.42, P , 0.0001) and between biomass and NDF (r 5 0.57, P , 0.0001).
Accessions differed significantly for seed yield in 2005 and 2006 at Millville. The insecticide effect was not significant in 2005, but was significant in 2006 (Table 3). The interaction between insecticide and accessions was not significant in either 2005 or 2006. The range of seed yield was 0 to 10 g ? plot 21 in 2005 (Table 4). The accession and insecticide main effects were significant for seed yield in 2006 (Table 3), and seed yields ranged from 0 to 5 g ? plot 21 (Table 4). In 2006 the insecticide treatment resulted in 62% higher seed yield than the treatment with no insecticide. Generally, accessions produced 163%
greater seed yield in 2006 than in 2005 (Tables 3 and 4).
Accessions differed significantly for seed mass in both 2005 and 2006 (Table 3) with a range from 0.2 to 0.8 g ? 100 seeds 21 (Table 4). Seed mass was more closely correlated with biomass in 2005 (r 5 0.49, P , 0.0001) and 2006 (r 5 0.60, P , 0.0001) than with seed yield in 2005 (r 5 0.30, P , 0.05) or in 2006 (r 5 0.51, P , 0.05; data not shown).
Plant Mortality and Morphological Measurements
Considerable variation was detected in mortality over winter at both study sites. At Providence winter mortality in 2005 ranged from 0% to 30% with a mean of 9%. In 2006 cumulative winter mortality ranged from 0% to 73% with a mean of 23%.
At Millville in 2005, winter mortality ranged from 7% to 53%
with a mean of 25%, and in 2006 cumulative winter mortality ranged from 13% to 83% with a mean of 35%.
Significant variation for plant height, number of stems per plant, number of inflorescences per plant, and plant vigor score was detected among basalt milkvetch accessions (Table 3).
Plant height varied significantly at Providence in 2005 (range of 16 to 37 cm) and 2006 (range of 16 to 34 cm) and at Millville in 2005 (range of 19 to 37 cm) and 2006 (range of 18 to 36 cm;
Table 4). Number of stems differed significantly among accessions at Providence in 2005 (range of 2 to 10) and 2006 (range of 4 to 32), and at Millville in 2005 (range of 2 to 13) and 2006 (range of 6 to 37). In addition, number of inflorescences differed significantly among accessions at Prov- idence in 2005 (range of 0 to 17) and 2006 (range of 1 to 82), and at Millville in 2005 (range of 0 to 30) and 2006 (range of 2 to 79). Accessions also differed significantly for plant vigor score at Providence in 2005 (range of 3 to 7) and 2006 (range of 2 to 5), and at Millville in 2005 (range of 3 to 7) and 2006 (range of 2 to 7). Significant differences were observed between 2005 and 2006 for number of stems, number of inflorescences, and plant vigor at both field sites, but not for plant height (Table 3). Number of stems and number of inflorescences were
significantly greater in 2006 (250% and 375%, respectively), but plant vigor score decreased (20%) from 2005 to 2006.
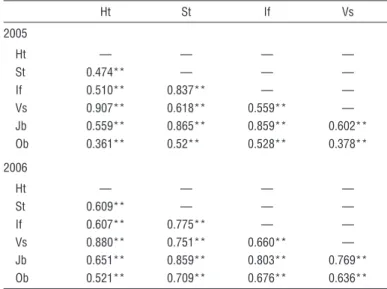
At Providence, the Pearson correlation coefficient between number of stems and June biomass was significant in 2005 (r 5 0.87, P , 0.0001) and 2006 (r 5 0.86, P , 0.0001; Ta- ble 5). Correlations between plant height and June biomass were significant in 2005 (r 5 0.56, P , 0.0001) and 2006 (r 5 0.65, P , 0.0001). Also, October biomass was significantly correlated with number of stems in 2005 (r 5 0.52, P , 0.0001) and 2006 (r 5 0.71, P , 0.0001). Similarly, October biomass was correlated with plant height in 2005 (r 5 0.36, P , 0.0001) and 2006 (r 5 0.52, P , 0.0001). Number of inflorescences at Providence was highly correlated with June biomass in 2005 (r 5 0.86, P , 0.0001) and 2006 (r 5 0.80, P , 0.0001). At Providence plant vigor was more strongly correlated with plant height in 2005 (r 5 0.91, P , 0.0001) and 2006 (r 5 0.88, P , 0.0001) than with any other plant characteristic.
At Millville August biomass was more strongly correlated with number of stems in 2005 (r 5 0.68, P , 0.0001) and 2006 (r 5 0.73, P , 0.0001) than with plant height in 2005 (r 5 0.44, P , 0.0001) and 2006 (r 5 0.54, P , 0.0001), number of inflorescences in 2005 (r 5 0.57, P , 0.0001) and 2006 (r 5 56, P , 0.0001), and plant vigor in 2005 (r 5 0.50, P , 0.0001) and 2006 (r 5 0.45, P , 0.0001; Table 6). Seed yield was highly correlated with number of inflorescences in 2005 (r 5 0.88, P , 0.0001) and 2006 (r 5 0.53, P , 0.0001) and August biomass in 2005 (r 5 0.75, P , 0.0001) and 2006 (r 5 0.71, P , 0.0001). Number of stems was significantly correlated with seed yield in 2005 (r 5 0.67, P , 0.0001) and 2006 (r 5 0.46, P , 0.0001), and these correlations were higher than those of plant height and plant vigor with seed yield.
Principal Component Analysis
The first principal component (PC1) described 60.5% of the total variation among accessions, whereas the second principal Table 5. Pearson correlation coefficients (r ) and their associated significance levels across basalt milkvetch accessions for Providence in 2005 and 2006. Variables include plant height (Ht), number of stems (St), number of inflorescences (If), plant vigor scores (Vs), June biomass (Jb), and October biomass (Ob).
Ht St If Vs
2005
Ht — — — —
St 0.474** — — —
If 0.510** 0.837** — —
Vs 0.907** 0.618** 0.559** —
Jb 0.559** 0.865** 0.859** 0.602**
Ob 0.361** 0.52** 0.528** 0.378**
2006
Ht — — — —
St 0.609** — — —
If 0.607** 0.775** — —
Vs 0.880** 0.751** 0.660** —
Jb 0.651** 0.859** 0.803** 0.769**
Ob 0.521** 0.709** 0.676** 0.636**
** 5 P , 0.01.
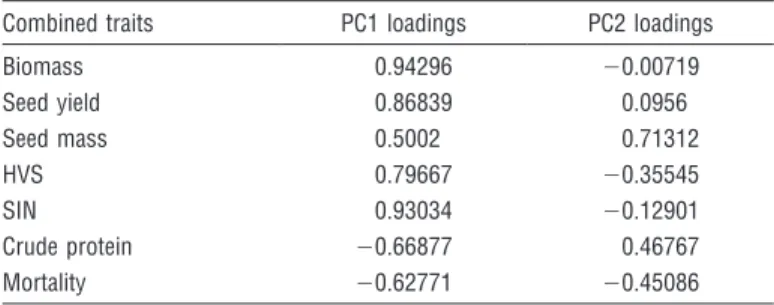
component (PC2) described an additional 15.4% of the total variation. The PC1 loadings were high for biomass (0.94), seed yield (0.87), combined plant height and vigor score (0.80), and combined number of stems and inflorescences (0.93), and low for crude protein (20.67) and overwinter mortality (20.63;
Table 7). The PC2 loadings were high for seed mass (0.71).
A strong negative correlation was observed between PC1 and elevation of the collection sites (r 5 20.71, P , 0.0001;
Table 8). Accessions collected from lower elevations tended to have greater biomass, seed yield, plant height, number of stems and inflorescences, and plant vigor score, but lower crude protein concentration and winter mortality than those from higher elevations. Accessions from Washington (Af-4, Af-6, Af- 55, and Af-56) and one accession from Oregon (Af-28) were considered outliers (Fig. 1b). Although these accessions were collected from low elevations, their PC1 coefficients were lower than those of other low-elevation accessions. Accessions from Nevada, Washington, and California generally clustered separately. However, Oregon and Idaho accessions exhibited a wide dispersion on the PC1 axis.
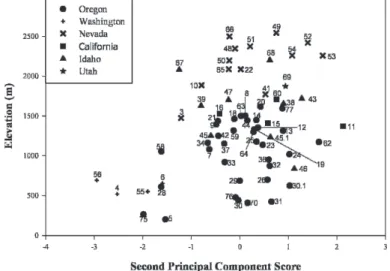
PC2 was positively correlated with elevation (r 5 0.36, P 5 0.003). The significant positive correlation between PC2 and elevation indicated that accessions from higher elevations tended to produce seeds with greater seed mass than those from lower elevations. PC2 separated Washington accessions from those from Nevada, Idaho, and California (Fig. 2). Principal component analysis showed that accessions from north-central Oregon generally had greater biomass and seed yield, number of stems and inflorescences, and greater plant height than other accessions. A scatter plot of PC1 and PC2 revealed that basalt milkvetch accessions generally clustered by state for Nevada, Washington, and California, but not for Idaho and Oregon (Fig. 1a).
A positive correlation (r 5 0.46, P , 0.0001) was detected between latitude and PC1, but a negative correlation was observed between longitude and PC1 (r 5 20.49, P , 0.0001;
Table 8). To evaluate the redundancy among the three geographic variables (elevation, latitude, and longitude), a type III sums of squares analysis was employed. This analysis for PC1 indicated that 1) elevation was significant even after Table 6. Pearson correlation coefficients (r ) and their associated significance levels across basalt milkvetch accessions for Millville in 2005 and 2006. Variables include plant height (Ht), number of stems (St), number of inflorescences (If), plant vigor scores (Vs), August biomass (Ab), October biomass (Ob), and seed yield (Sy).
Ht St If Vs Ab Ob
2005
Ht — — — — — —
St 0.411** — — — — —
If 0.438** 0.742** — — — —
Vs 0.785** 0.595** 0.555** — — —
Ab 0.439** 0.677** 0.572** 0.496** — —
Ob 0.131** 0.419** 0.358** 0.183** 0.557** —
Sy 0.327** 0.67** 0.876** 0.45** 0.751** 0.317**
2006
Ht — — — — — —
St 0.558** — — — — —
If 0.634** 0.772** — — — —
Vs 0.465** 0.554** 0.488** — — —
Ab 0.542** 0.732** 0.562** 0.451** — —
Ob — — — — — —
Sy 0.359** 0.461** 0.525** 0.262** 0.714** —
** 5 P , 0.01.
Table 7. First (PC1) and second (PC2) principal component loadings for each consolidated trait across basalt milkvetch accessions. HVS is the consolidated trait from plant height and plant vigor score, whereas SIN is the consolidated trait for number of stems and number of inflorescences.
Combined traits PC1 loadings PC2 loadings
Biomass 0.94296 20.00719
Seed yield 0.86839 0.0956
Seed mass 0.5002 0.71312
HVS 0.79667 20.35545
SIN 0.93034 20.12901
Crude protein 20.66877 0.46767
Mortality 20.62771 20.45086
Table 8. Pearson’s correlation coefficients for the first (PC1) and second (PC2) principal components with elevation, longitude, latitude, mean annual maximum temperature (Max.), mean annual minimum temperature (Min.), and precipitation (Precip) across basalt milkvetch accessions.
PC1
1PC2
1Elevation 20.71** 0.36**
Longitude 20.49** 0.11
nsLatitude 0.46** 20.47**
Max. 20.19
ns20.14
nsMin. 0.25* 20.35**
Precip 0.28* 0.26*
1