ORIGINAL RESEARCH
Alberta Stroke Program Early CT Scoring of CT
Perfusion in Early Stroke Visualization and
Assessment
R.I. Aviv J. Mandelcorn S. Chakraborty D. Gladstone S. Malham G. Tomlinson A.J. Fox S. Symons
BACKGROUND AND PURPOSE: Qualitative CT perfusion (CTP) assessment by using the Alberta Stroke Program Early CT Score (ASPECTS) allows rapid calculation of infarct extent for middle cerebral artery infarcts. Published thresholds exist for noncontrast CT (NCCT) ASPECTS, which may distinguish outcome/complication risk, but early ischemic signs are difficult to detect. We hypothesized that different ASPECTS thresholds exist for CTP parameters versus NCCT and that these may be superior at predicting clinical and radiologic outcome in the acute setting.
MATERIALS AND METHODS: Thirty-six baseline acute stroke NCCT and CTP studies within 3 hours of symptoms were blindly reviewed by 3 neuroradiologists, and ASPECTS were assigned. Treatment response was defined as major neurologic improvement when aⱖ8-point National Institutes of Health Stroke Scale improvement at 24 hours occurred. Follow-up NCCT ASPECTS and 90-day modified Rankin score (mRS) were radiologic and clinical reference standards. Receiver operating characteristic curves derived optimal thresholds for outcome.
RESULTS: Cerebral blood volume and NCCT ASPECTS had similar radiologic correlations (0.6 and 0.5, respectively) and best predicted infarct size in the absence of major neurologic improvement. A NCCT ASPECT threshold of 7 and a cerebral blood volume threshold of 8 discriminated patients with poor follow-up scans (P⬍.0002 andP⫽.0001) and mRSⱕ2 (P⫽.001 andP⬍.001). Only cerebral blood volume predicted major neurologic improvement (P⫽.02). Interobserver agreement was substantial (intraclass correlation coefficient, 0.69). Cerebral blood volume ASPECTS sensitivity, specificity, pos-itive predictive value, and negative predictive value for clinical outcome were 60%, 100%, 100%, and 45%, respectively. No patients with cerebral blood volume ASPECTS ⬍8 achieved good clinical outcome.
CONCLUSION:Cerebral blood volume ASPECTS is equivalent to NCCT for predicting radiologic out-come but may have an additional benefit in predicting patients with major neurologic improvement.
T
he most widely used imaging technique for acute stroke remains noncontrast CT (NCCT). The reliability of early subtle ischemic sign detection in middle cerebral artery terri-tory is improved with experience,1 clinical history,2 strokewindow width and level,3and the use of the Alberta Stroke Program Early CT Score (ASPECTS).4NCCT ASPECTS
al-lows a rapid and reliable assessment of stroke extent and has been shown to correlate with final infarct size.5The
combina-tion of the ASPECTS, which is weighted for clinically signifi-cant regions, and CT perfusion (CTP), which can distinguish salvageable tissue from infarct core, suggests added benefit over NCCT alone for clinical outcome. Although multiple fac-tors influence stroke outcome, knowledge of cerebral blood volume, cerebral blood flow, and mean-transit-time thresh-olds for outcome may influence the decision for thrombolysis treatment.
The aim of the study was to evaluate whether in the acute CT assessment of infarction, ASPECTS scoring of CTP has higher predictive value than NCCT for the final infarct size
and clinical outcome. We also sought to determine and test thresholds predictive of outcome in patients.
Materials and Methods
This was a retrospective study of consecutive tissue plasminogen ac-tivator (tPA)–treated patients presenting between January and June 2005. Patients were included if they presented with suspected acute stroke within 3 hours of onset, underwent a CT stroke protocol (in-cluding CT angiography [CTA] and CTP), were treated with intrave-nous thrombolysis, and were followed up at 5–7 days. A standard tPA administration regime was used (0.9 mg/kg dose, 10% bolus, 90% continuous infusion for 1 hour). Recanalization data were variably collected because of differences in practice of clinicians and did not exclude the patient from participation. To determine prediction of presentation perfusion parameters with radiologic outcome, we di-chotomized patients into 2 groups: those with a major neurologic improvement and those without. Major neurologic improvement was defined in accordance with previous publications, asⱖ8-point Na-tional Institutes of Health Stroke Scale (NIHSS) improvement at 24 hours after tPA.6-8Major neurologic improvement was used as a
sur-rogate marker of response to treatment on the basis of the following rationale: Secondary analysis by the National Institute of Neurologi-cal Disorders and Stroke investigators demonstrated that this magni-tude of improvement discriminated between the treatment and pla-cebo group without overlap in the confidence intervals (CIs).6This
degree of improvement is an independent predictor of good 90-day outcome.7Major neurologic improvement has, therefore, been
inter-preted in this study and others as a marker of treatment efficacy and has been suggested as a surrogate marker for clinical efficacy and a
Received November 13, 2006; accepted after revision April 2, 2007.
From the Division of Neuroradiology (R.I.A., J.M., S.C., S.M., A.J.F., S.S.), Neurology and Regional Stroke Center (D.G.), Sunnybrook Health Sciences Centre, Toronto, Ontario, Canada; and Department of Biostatistics (G.T.), University of Toronto, Toronto, Ontario, Canada.
Please address correspondence to: R. Aviv, MD, Division of Neuroradiology, Sunnybrook Health Sciences Centre, 2075 Bayview Ave, Toronto M4N 3M5, Ontario, Canada; e-mail: [email protected]
DOI 10.3174/ajnr.A0689
BRAIN
ORIGINAL
possible marker of recanalization.8,9The NIHSS was recorded by an
experienced stroke neurologist with NIHSS certification. Thirty-nine patients met the criteria and constituted the study group; 3 were sub-sequently excluded on the basis of suboptimal CTP image quality. NIHSS at presentation, the change in NIHSS at 24 hours after throm-bolysis, and 3-month modified Rankin Scale (mRS) scores were re-corded. An mRSⱕ2 at 3 months was considered a good clinical out-come. Local institutional review board approval was obtained.
Imaging
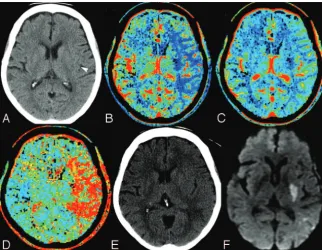
The CT stroke protocol using a 4-section CT scanner (LightSpeed; GE Healthcare, Milwaukee, Wis) comprised pre- and postcontrast head scans from the skull base to the vertex. Imaging parameters were the following: 120 kVp, 340 mA, 4⫻5 mm collimation, 1 s/rotation, and table speed of 15 mm/rotation. CTP parameters were the following: 45-second cine scanning (80 kVp, 190 mA), 3- to 5-second delay, injection of 0.5-mL/kg (30 –50 mL) iohexol (300 mg/mL; Om-nipaque, Nycomed, Princeton, NJ) at a rate of 4 mL/s. CTP studies covered a 20-mm slab with four 5-mm sections carefully positioned to allow visualization of the sections required for ASPECTS scoring from the basal ganglia to the centrum. This was achievable in all pa-tients (Fig 1). CTA covered carotid bifurcations to the vertex with the following parameters: 0.7-mL/kg iohexol (maximum, 90 mL); 5- to 10-second delay; 120 kVp; 270 mA; 1 s/rotation; 1.25-mm-thick sec-tions; table speed, 3.75 mm/rotation. For each CTP study, a time attenuation curve was made, displaying the change in Hounsfield units for a specified region for the duration of the scanning. Arterial and venous input functions were obtained from the ipsilateral ante-rior cerebral artery and from the supeante-rior sagittal sinus, respectively. CT Perfusion 3 (GE Healthcare) was used to calculate parametric maps of cerebral blood flow and cerebral blood volume by deconvo-lution of tissue-enhancement curves and arterial time-attenuation curve in 2⫻2 pixel blocks. Mean-transit-time maps were also calcu-lated. Partial volume averaging of the arterial input curve was cor-rected by using the venous time-attenuation curve.
Image Analysis
Three reviewers (2 neuroradiologists and a neuroradiology fellow) read a number of mock cases and agreed by consensus on the method of ASPECTS scoring on CTP, according to a previously published method for NCCT.4A
qualitative approach to CTP was adopted, scoring any perfusion abnormality. Absolute perfusion values were not considered. By agreement, only images from the anterior commissure to the section above the lateral ventricles were reviewed on NCCT. Readers were blinded to clinical information and randomly reviewed the studies on a PACS worksta-tion (Version 3.1; Agfa, Waterloo, Ontario, Canada). Perfusion ab-normality was scored by using ASPECTS for each of the cerebral blood volume, cerebral blood flow, and mean-transit-time maps; and the affected side was recorded. A delay of 1 week between each se-quence read was instituted to avoid recall bias. The final NCCT AS-PECTS was scored separately by 2 experienced readers without knowledge of previous imaging.
Statistical Analysis
Data were transferred to and analyzed in Statistical Package for the Social Sciences (Version 10; SPSS, Chicago, Ill). Median ASPECTSs for the presentation and follow-up NCCT and CTP parameters were compared by using pairedttests, dichotomizing patients according to recanalization implied by NIHSS improvement as discussed previ-ously. Pearson correlation coefficients were computed between ASPECTS for NCCT, cerebral blood volume, cerebral blood flow, mean transit time, and radiologic NCCT outcome. Median AS-PECTSs for each CT parameter were compared for patients having good and bad clinical outcome (mRS,ⱕ2 orⱖ3, respectively) by using unpairedttests. For each sequence and follow-up NCCT, re-ceiver operating characteristic (ROC) curves were computed with the dichotomized mRS as the reference outcome; the optimal threshold for predicting outcome was defined as that which gave maximum accuracy (sensitivity plus specificity). Using these optimal thresholds in our patient group, we calculated rate ratios and reported the opti-mal positive and negative predictive values for identifying good clin-ical outcomes. To assess agreement among readers for ASPECTS as a continuous variable, we computed the intraclass correlation coeffi-cient (ICC). For all analyses, statistical significance was determined as P⬍.05.
Results
There were 18 female and 18 male patients. The median age was 75 years (range, 35–95 years). Median NIHSS was 15
Fig 1.A 75-year-old man, within 2 hours of right-sided stroke
[image:2.594.54.377.42.292.2](range, 6 –30) at presentation. The median time to presenta-tion from symptom onset was 165 minutes (range, 84 –180 minutes). Median NIHSS 24-hours post-tPA was 4 (range, 0 – 46). Median hospital length of stay was 11 days (range, 1–110). The location of thrombus demonstrated on presenta-tion CTA was the M1 segment in 16 patients and the M1– 4 segments in 20 patients. No inferior cerebellar artery, poste-rior infeposte-rior cerebellar artery, or anteposte-rior cerebral artery in-farcts were present. Left-sided inin-farcts occurred in 16 patients (44%). Hemorrhagic transformation (type 1 or 2) and paren-chymal hematoma (PH 1 or 2) were seen in 8 (22%) and 6 (16%) patients, respectively. Major neurologic improvement was present in 7 patients.
Radiologic Outcome
The median ASPECTS and level of significance for baseline NCCT, final NCCT ASPECTS, and CTP are given in Table 1. The mean cerebral blood volume and NCCT ASPECTS at pre-sentation most closely predicted final NCCT ASPECTS in pa-tients with major neurologic improvement. In the absence of such improvement, cerebral blood flow and mean-transit-time values most closely agreed with final NCCT ASPECTS.
A correlation matrix was determined for each CTP param-eter predicting final NCCT ASPECTS. NCCT and cerebral blood volume ASPECTS (r⫽0.6 and 0.5, respectively) were superior to mean transit time or cerebral blood flow (r⫽0.4 each) in patients who showed major neurologic improvement. In the absence of such NIHSS improvement, cerebral blood flow and mean-transit-time ASPECTS (r ⫽0.6 each) were superior to cerebral blood volume and NCCT (r⫽0.5).
An ASPECT threshold of 7 and cerebral blood volume
threshold of 8 at presentation discriminated patients with poor follow-up findings on scans (P⬍.0002 andP⫽.0001, respectively). In patients with no major neurologic improve-ment, cerebral blood flow and mean-transit-time thresholds of 5 were predictive of radiologic outcome (P⬍.0001 each).
Clinical Outcome
ROC curves were drawn, and the areas calculated as 0.8 each for cerebral blood volume, cerebral blood flow, mean transit time, and final NCCT ASPECTS; and 0.7 for baseline CT, re-spectively. Optimal thresholds were determined and are pre-sented in Table 2.
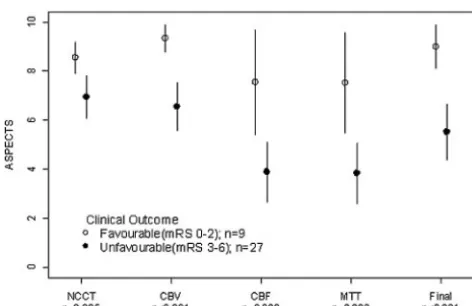
A cerebral blood volume threshold of 8 was the only pre-sentation parameter to predict patients with major neurologic improvement (P⫽.02) (Fig 2). NCCT (P⫽.08), cerebral blood flow (P⫽.22), and mean transit time (P⫽.20) did not reach significance. The mean NIHSS at 24 hours in patients presenting with cerebral blood volumeⱖ8 was 7.3 (SD,⫾6.7) versus 16.4 (SD,⫾6) in patients with cerebral blood volume ⬍8 (P⫽.0004). Major neurologic improvement predicted a good clinical outcome in 86% of patients with sensitivity, specificity, positive predictive value, and negative predictive value of 96%, 67%, 89%, and 86%, respectively.
[image:3.594.53.532.55.193.2]Figure 3 demonstrates that the greatest discriminator of clinical outcome was the follow-up CT ASPECTS (P⬍.001), followed by cerebral blood volume (P⬍ .001). Sensitivity, specificity, positive predictive value, and negative predic-tive value for cerebral blood volume ASPECTS was 60%, 100%, 100%, and 45%, respectively. Values for initial NCCT ASPECTS were 63%, 89%, 94%, and 44%, respec-tively. No patients with a cerebral blood volume threshold of Table 1: Mean ASPECTS values and 95% CIs for differences in ASPECTS at baseline for NCCT and CTP compared with final NCCT ASPECTS
NC-CT CBV CBF MTT Final NC-CT ASPECTS
MNI (n⫽7)a
Mean 8.5 9 5.166667 5 9
NCCT ⫺2.3–1.4NS 0.06–3.8S 0.11–3.88S ⫺2.1–1.7NS
CBV 0.5–4.3S 0.5–4.4S ⫺1.6–2.2NS
CBF ⫺1.8–1.9NS ⫺4.0 to⫺0.3S
MTT ⫺4.0 to⫺0.3S
No MNI (n⫽29)
Mean 6.8 6.5 4.0 4.0 5.4
NCCT ⫺0.4–1.1NS 1.7–4.0S** S 1.7–4.0S** 0.6–2.2S
CBV 1.3–3.6S** S 1.4–3.6S** 0.07–2.3S
CBF ⫺1.3–1.4NS ⫺2.6–0.05NS
MTT ⫺2.7–0.01NS
Note:—MNI indicates major neurologic improvement; CBV, cerebral blood volume; CBF, cerebral blood flow; MTT, mean transit time; NS, nonsignificant; S, significant (level of significance
determined by pairedttest,P⬍.05, or S**,P⬍.01).
a
[image:3.594.55.533.250.326.2]In patients with MNI, mean CBV and NCCT were not significantly different from mean final NCCT ASPECTS, whereas in the absence of MNI, CBF, and MTT most closely approximated final NCCT ASPECTS.
Table 2: Performance measures of NCCT, CTP, final ASPECTS, and 24-hour NIHSS change for clinical outcome
Thresholda
Good Outcome, mRS
ⱕ2 (% Patients) RR (95% CI) P*
Sensitivity (95% CI)
Specificity
(95% CI) Accuracy
NCCT⬎7 vsⱕ7 44 (6) 8.0 (1.1–57.6) .018 0.63 (0.4–0.8) 0.89 (0.47–0.99) 0.69
CBVⱖ8 vs⬍8 45 (0) 15.4 (0.96–246) .002 0.60 (0.4–0.8) 100 (0.66–100) 0.69
Final NCCT⬎6 vsⱕ6 47 (0) 17 (1.1–27.3) .001 1.00 (0.7–1.0) 0.63 (0.44–0.78) 0.72
CBF/MTT⬎5 vsⱕ5 46 (13) 3.54 (1.1–11.8) .046 0.74 (0.5–0.9) 0.67 (0.35–0.88) 0.69
Change NIHSS 24 hoursⱖ8 86 (10) 8 (2.7–25.2) .0001 0.96 (0.8–1.0) 0.67 (0.3–0.9) 0.89
Note:—RR indicates relative risk; CBV, cerebral blood volume; CBF, cerebral blood flow; MTT, mean transit time.
aDichotomized thresholds were determined by ROC analysis. Percentage of patients presenting with good outcome above and below the selected threshold is illustrated. The best early
⬍8 had an mRSⱕ2 at follow-up. However, the prognosis for patients with cerebral blood volumeⱖ8 was more variable, with only 45% achieving an mRSⱕ2. However, 70% achieved an mRSⱕ3 with only 1 false-negative (6%) (Table 3). There was no difference between mean transit time and cerebral blood flow for clinical outcome (P⫽.008 and .009). The sen-sitivity and specificity were 67% and 70%, respectively.
Interobserver Agreement
The ICC for each CT parameter is given in Table 4. Cerebral blood volume agreement was slightly higher than NCCT agreement, but both demonstrated comparable CIs. The ICC for cerebral blood flow and mean transit time was high, with narrow CIs.
Discussion
We demonstrated that a cerebral blood volume ASPECTS threshold of 8 discriminates patients who experience major neurologic improvement and have good clinical outcome at 3 months (mRSⱕ2). The ability of a cerebral blood volume ASPECTS threshold at presentation to predict major neuro-logic improvement has not previously been described, to our
knowledge, and has important clinical implications. Major neurologic improvement is defined as NIHSS improvement
ⱖ8 points. It is usually determined by subtracting the post-tPA treatment NIHSS from the presentation score. Major neu-rologic improvement is considered a marker of treatment re-sponse and thought to reflect recanalization.8,9 Major
neurologic improvement and 24-hour NIHSS are known to strongly discriminate 90-day outcome with an area under the curve for 24-hour NIHSS of 0.71.8-10In our study, baseline cerebral blood volume ASPECTS was the only parameter to discriminate patients who showed major neurologic improve-ment. This improvement was also associated with the highest accuracy for prediction of 3-month clinical outcome. Our findings suggest that ASPECTS scoring of cerebral blood vol-ume may provide additional clinical prognostic information not available on NCCT.
In this series, patients with a cerebral blood volume ASPECTS⬍8 treated with thrombolysis did not have a good clinical outcome. The prognosis is more guarded when the cerebral blood volume isⱖ8, with an outcome of mRSⱕ2 in only 45% of patients, and is consistent with a recent report of ASPECTS in the Canadian Alteplase for Stroke Effectiveness Study dataset.10The rate of patients’ achieving mRSⱕ3 was
70%, also consistent with the previously mentioned study with 1 false-negative (6%).
CTP has a spatial resolution (1.5⫻1.5⫻3 cm) similar to that of MR perfusion but is limited by spatial coverage, ioniz-ing radiation, and iodinated contrast injection. Despite lim-ited 2-cm coverage on a 4-section scanner, a carefully posi-tioned slab ensures that the ASPECTSs were highly correlated with final infarct volume and clinical outcome. A recent study has evaluated the dose obtained at CTP. With commonly used parameters, the dose of 1.1–1.3 mSV is lower than that in NCCT. The dose was recorded for a 64-section scanner over 2.4 cm, which is greater than the 2 cm achievable on a 4-sec-tion scanner.11In clinical practice, we do not repeat the CTP
study if movement occurs. It is often possible for the CTP raw data to be edited and the sections with movement to be elim-inated. Nevertheless, 3 studies in this consecutive series were uninterpretable. The score is robust and unaffected by scan-ning angle or interpretation of extent of middle cerebral artery territory.12In comparison with more elaborate and
time-con-suming perfusion threshold or volume measures13-17for
de-termining final infarct size, the ASPECTS scoring of CTP may seem relatively crude. We believe that this simplicity is its strength, and we have shown that CTP ASPECTS correlated well with final NCCT ASPECTS. The extended coverage that a 64-section scanner or other techniques (such as table toggle18
or double injection19) provide, however, may allow greater final infarct volume correlation.
At acute stroke presentation, limited data are available to guide thrombolysis decision-making or to provide prognostic information. Conflicting data exist as to whether patients with early ischemic signs are at higher risk for poor outcome and thrombolysis-related complications, based on NCCT inter-pretation.20-28Although there is a general pattern of worse
outcome when the hypoattenuation is widespread (ASPECTS ⬎7 or 1/3 middle cerebral arteries19-23), only 3 studies have
looked directly for an association between such patients and thrombolysis treatment and have found no such
interac-Fig 2.A plot of mean baseline ASPECTS NCCT, cerebral blood volume (CBV), cerebral blood
flow (CBF), and mean transit time (MTT) against major neurologic improvement, demon-strating that only CBV is predictive of 24-hour NIHSS change.
Fig 3.A plot of mean baseline ASPECTS NCCT, cerebral blood volume (CBV), cerebral blood
[image:4.594.54.287.40.212.2] [image:4.594.52.288.259.412.2]tion.25-27 Early ischemic changes are difficult to detect on
NCCT, with low interobserver agreement for presence and extent.29,30Whereas loss of gray-white differentiation is con-sistent with infarction,31cerebral swelling may be intermixed,
extending the apparent boundary of infarct. Cerebral swelling is associated with a variable and lower stroke risk32and may
account for overestimation of initial infarct size on NCCT. Use of ASPECTS on CTA signal intensity allows easier detec-tion of the infarct extent and provides addidetec-tional informa-tion.5When compared with NCCT, the median cerebral blood
volume ASPECTS was higher and lower in patients with good and bad outcome, respectively. A single previous study in the neurology literature has looked at ASPECTS interpretation of CTP and reported benefit of cerebral blood volume ASPECTS over NCCT.33However, a lower threshold of 6 –7 was used, resulting in a false-negative rate of 13%–18%.
A limitation of this study is the absence of direct evidence of recanalization; however, the purpose was to investigate what prognostic baseline data the CTP study offers independent of other factors. Furthermore, unless continuous transcranial Doppler is used, the exact moment of recanalization and du-ration of ischemia cannot be known. A post-thrombolysis NIHSS improvement ofⱖ8 points (major neurologic im-provement) was considered a surrogate marker of recanaliza-tion, supported by recent publications.6-9In support of major
neurologic improvement as a marker of treatment response, 86% of patients in this series fulfilling these criteria achieved a good outcome. This is similar for published data of outcome in patients with successful recanalization following intra-arte-rial therapy34and in agreement with outcomes in other studies
using major neurologic improvement.8
In conclusion, a threshold of 8 applied to the ASPECTS interpretation of cerebral blood volume is equivalent to that of NCCT for radiologic outcome and may confer some advan-tage over NCCT at predicting 24-hour improvement and final clinical outcome. The results of our series indicate that pa-tients treated with thrombolysis presenting with a cerebral blood volume ASPECTS of⬍8 have a poor outcome.
References
1. von Kummer R, Nolte PN, Schnittger H, et al.Detectability of cerebral hemisphere ischaemic infarcts by CT within 6 h of stroke.Neuroradiology1996;38:31–33 2. Mullins ME, Lev MH, Schellingerhout D, et al.Influence of availability of
clin-ical history on detection of early stroke using unenhanced CT and diffusion-weighted MR imaging.AJR Am J Roentgenol2002;179:223–28
3. Lev MH, Farkas J, Gemmete JJ, et al.Acute stroke: improved nonenhanced CT detection– benefits of soft-copy interpretation by using variable window width and center level settings.Radiology1999;213:150 –55
4. Barber PA, Demchuk AM, Zhang J, et al.Validity and reliability of a quantita-tive computed tomography score in predicting outcome of hyperacute stroke before thrombolytic therapy: ASPECTS Study Group—Alberta Stroke Pro-gramme Early CT Score.Lancet2000;355:1670 –74
5. Coutts SB, Lev MH, Eliasziw M, et al.ASPECTS on CTA source images versus unenhanced CT: added value in predicting final infarct extent and clinical outcome.Stroke2004;35:2472–76
6. Haley EC Jr, Lewandowski C, Tilley BC.Myths regarding the NINDS rt-PA Stroke Trial: setting the record straight.Ann Emerg Med1997;30:676 – 82 7. Saposnik G, Di Legge S, Webster F, et al.Predictors of major neurologic
im-provement after thrombolysis in acute stroke.Neurology2005;65:1169 –74 8. Brown DL, Johnston KC, Wagner DP, et al.Predicting major neurological
improvement with intravenous recombinant tissue plasminogen activator treatment of stroke.Stroke2004;35:147–50
9. Alexandrov AV, Demchuk AM, Felberg RA, et al.High rate of complete recanalization and dramatic clinical recovery during tPA infusion when continuously monitored with 2-MHz transcranial Doppler monitoring.
Stroke2000;31:610 –14
10. Weir NU, Pexman JH, Hill MD, et al.CASES investigators: how well does ASPECTS predict the outcome of acute stroke treated with IV tPA?Neurology
2006;67:516 –18
11. Cohnen M, Wittsack HJ, Assadi S, et al.Radiation exposure of patients in comprehensive computed tomography of the head in acute stroke.AJNR Am J Neuroradiol2006;27:1741– 45
12. Pexman JH, Barber PA, Hill MD, et al.Use of the Alberta Stroke Program Early CT Score (ASPECTS) for assessing CT scans in patients with acute stroke.
AJNR Am J Neuroradiol2001;22:1534 – 42
13. Schaefer PW, Roccatagliata L, Ledezma C, et al.First-pass quantitative CT perfusion identifies thresholds for salvageable penumbra in acute stroke pa-tients treated with intra-arterial therapy. AJNR Am J Neuroradiol
2006;27:20 –25
14. Wintermark M, Flanders AE, Velthuis B, et al.Perfusion-CT assessment of infarct core and penumbra: receiver operating characteristic curve analysis in 130 patients suspected of acute hemispheric stroke.Stroke2006;37:979 – 85 15. Murphy BD, Fox AJ, Lee DH, et al.Identification of penumbra and infarct in
acute ischemic stroke using computed tomography perfusion-derived blood flow and blood volume measurements.Stroke2006;37:1771–77
16. Schaefer PW, Roccatagliata L, Ledezma C, et al.First-pass quantitative CT perfusion identifies thresholds for salvageable penumbra in acute stroke pa-tients treated with intra-arterial therapy. AJNR Am J Neuroradiol
2006;27:20 –25
17. Wintermark M, Reichhart M, Thiran JP, et al.Prognostic accuracy of cerebral blood flow measurement by perfusion computed tomography, at the time of emergency room admission, in acute stroke patients. Ann Neurol
2002;51:417–32
18. Roberts HC, Roberts TP, Smith WS, et al.Multisection dynamic CT perfusion for acute cerebral ischemia: the “toggling-table” technique.AJNR Am J Neu-roradiol2001;22:1077– 80
19. Wintermark M, Smith WS, Ko NU, et al.Dynamic perfusion CT: optimizing the temporal resolution and contrast volume for calculation of perfusion CT parameters in stroke patients.AJNR Am J Neuroradiol2004;25:720 –29 20. Adams HP Jr, Adams RJ, Brott T, et al.Guidelines for the early management of
patients with ischemic stroke: a scientific statement from the Stroke Council of the American Stroke Association.Stroke2003;34:1056 – 83
21. Moulin T, Cattin F, Crepin-Leblond T, et al.Early CT signs in acute middle cerebral artery infarction: predictive value for subsequent infarct locations and outcome.Neurology1996;47:366 –75
22. von Kummer R, Bourquain H, Bastianello S, et al.Early prediction of irrevers-ible brain damage after ischemic stroke at CT.Radiology2001;219:95–100 23. Hill MD, Rowley HA, Adler F, et al, and the PROACT-II Investigators. Selection
of acute ischemic stroke patients for intra-arterial thrombolysis with pro-urokinase by using ASPECTS.Stroke2003;34:1925–31. Epub 2003 Jul 3 24. Hacke W, Kaste M, Fieschi C, et al.Intravenous thrombolysis with
recombi-nant tissue plasminogen activator for acute hemispheric stroke:ⴙ- The Euro-pean Cooperative Acute Stroke Study (ECASS).JAMA1995;274:1017–25 25. Dzialowski I, Hill MD, Coutts SB, et al.Extent of early ischemic changes on
[image:5.594.54.536.63.107.2]computed tomography (CT) before thrombolysis: prognostic value of the Al-berta Stroke Program Early CT Score in ECASS II.Stroke2006;37:973–78
Table 3: Relationship between 3-month functional outcome (mRS) and dichotomized baseline CBV ASPECTS
mRS Total
Baseline CBV ASPECTS 0–2 (%) 3 (%) 4 (%) 5 (%) 6 (%)
CBV⬍8 0 (0) 1 (6.2) 5 (31.2) 7 (43.8) 3 (18.8) 16
CBVⱖ8 9 (45) 5 (25) 4 (20) 1 (5) 1 (5) 20
[image:5.594.298.531.128.729.2]Note:—CBV indicates cerebral blood volume.
Table 4: Interobserver variability
ICC CI
NCCT 0.65 0.49–0.78
CBV 0.69 0.54–0.81
CBF 0.82 0.72–0.89
MTT 0.81 0.7–0.89
Note:—CBV indicates cerebral blood volume; CBF, cerebral blood flow; MTT, mean transit
26. Cornu C, Boutitie F, Candelise L, et al.Streptokinase in acute ischemic stroke: an individual patient data meta-analysis—the Thrombolysis in Acute Stroke Pooling Project.Stroke2000;31:1555– 60
27. Patel SC, Levine SR, Tilley BC, et al.Lack of clinical significance of early ischemic changes on computed tomography in acute stroke.JAMA2001;286:2830 –38 28. Hill MD, Demchuk AM, Tomsick TA, et al.Using the baseline CT scan to select
acute stroke patients for IV-IA therapy.AJNR Am J Neuroradiol2006;27:1612–16 29.Tissue plasminogen activator for acute ischemic stroke: The National Insti-tute of Neurological Disorders and Stroke rt-PA Stroke Study Group.N Engl J Med1995;333:1581– 87
30. Wardlaw JM, Dorman PJ, Lewis SC, et al.Can stroke physicians and neurora-diologists identify signs of early cerebral infarction on CT?J Neurol Neurosurg Psychiatry1999;67:651–53
31. Sobesky J, von Kummer R, Frackowiak M, et al.Early ischemic edema on cere-bral computed tomography: its relation to diffusion changes and hypoperfu-sion within 6 hours after human ischemic stroke—a comparison of CT, MRI and PET.Cerebrovasc Dis2006;21:336 –39
32. Na DG, Kim EY, Ryoo JW, et al.CT sign of brain swelling without concomitant parenchymal hypoattenuation: comparison with diffusion- and perfusion-weighted MR imaging.Radiology2005;235:992– 48
33. Parsons MW, Pepper EM, Chan V, et al.Perfusion computed tomography: prediction of final infarct extent and stroke outcome. Ann Neurol
2005;58:672–79
34. Jahan R, Duckwiler GR, Kidwell CS, et al.Intraarterial thrombolysis for treat-ment of acute stroke: experience in 26 patients with long-term follow-up.