INTRODUCTION
A critical environmental challenge faced by organisms is the influence of temperature on physiological and biochemical processes (Cossins and Bowler, 1987; Hochachka and Somero, 2002; Huey and Kingsolver, 1989). Environmental temperature is especially significant for ectothermic animals because it directly affects body temperature and thereby physiological rate processes such as metabolic rate and muscle contraction velocity. The decline of these rates with decreasing temperature limits an organism’s ability to effectively carry out critical behaviors at low environmental temperatures (Bennett, 1985; Hill et al., 2008).
Among the various physiological processes affected by temperature changes, the rate properties of muscle contraction have perhaps the most immediate impact upon an organism’s ability to move and engage in behaviors such as foraging, predator evasion and courtship. Physiologists have long recognized that rate properties of muscle contraction – e.g. rate of tension development, maximum shortening velocity and peak power output – decline at low temperatures, dropping by at least half with each 10°C drop, i.e. Q10>2 (where the temperature coefficient Q10is the factor by which
a rate increases with a 10°C increase in temperature). This marked decline has been found in a diversity of muscles from a vast array of animals, including vertebrates and invertebrates, endotherms and ectotherms (Putnam and Bennett, 1982; Bennett, 1984; Bennett,
1985; Hirano and Rome, 1984; Renaud and Stevens, 1984; Else and Bennett, 1987; John-Alder et al., 1989; Faulkner et al., 1990; Stevenson and Josephson, 1990; Barnes and Ingalls, 1991; Rome et al., 1992a; Rome et al., 1992b; Swoap et al., 1993; Asmussen et al., 1994; Sobol and Nasledov, 1994; Altringham and Block, 1997; Choi et al., 1998; Donley et al., 2007; Herrel et al., 2007).
The thermal dependence of these contractile rate properties strongly influences dynamic behaviors such as locomotion. The top speed at which a lizard can chase prey and the distance a frog can jump from a pursuing predator, for example, have been shown to be reduced by low body temperature (Huey and Stevenson, 1979; Bennett, 1984; Bennett, 1990). The reduction is not as great as that of the rate properties of isolated muscle, but it is nonetheless significant. For example, sprint velocity in the lizard Trapelushas a Q10of 1.8 between 21 and 38°C (Herrel et al., 2007), and maximum
jumping distance in Ranahas a Q10of 1.6 over 14–25°C (Hirano
and Rome, 1984). Significant thermal dependence has been found in locomotor speed and frequency of oscillatory movements, including salamander locomotion, frog swimming, jumping and calling, lizard running and fish swimming, among others (Hirano and Rome, 1984; Marsh and Bennett, 1985; van Berkum, 1986; Else and Bennett, 1987; Huey and Bennett, 1987; John-Alder et al., 1988; John-Alder et al., 1989; Rome et al., 1990; Bauwens et al., 1995; Lutz and Rome, 1996; Altringham and Block, 1997;
The Journal of Experimental Biology 214, 1333-1346 © 2011. Published by The Company of Biologists Ltd doi:10.1242/jeb.048405
RESEARCH ARTICLE
Thermal effects on the dynamics and motor control of ballistic prey capture in toads:
maintaining high performance at low temperature
Stephen M. Deban
1,* and A. Kristopher Lappin
21Department of Integrative Biology, University of South Florida, 4202 East Fowler Avenue SCA 110, Tampa, FL 33620, USA and 2Biological Sciences Department, California State Polytechnic University, 3801 West Temple Avenue, Pomona, CA 91768, USA
*Author for correspondence ([email protected])
Accepted 15 December 2010
SUMMARY
Temperature has a strong influence on biological rates, including the contractile rate properties of muscle and thereby the velocity, acceleration and power of muscle-powered movements. We hypothesized that the dynamics of movements powered by elastic recoil have a lower thermal dependence than muscle-powered movements. We examined the prey capture behavior of toads (Bufo terrestris) using high speed imaging and electromyography to compare the effects of body temperature (11–35°C) on the kinematics, dynamics and motor control of two types of movement: (1) ballistic mouth opening and tongue projection, which are powered by elastic recoil, and (2) non-ballistic prey transport, including tongue retraction and mouth closing, which are powered directly by muscle contraction. Over 11–25°C, temperature coefficients of ballistic mouth opening and tongue projection dynamics (Q10of 0.99–1.25) were not significantly different from 1.00 and were consistently lower than those of prey transport movements (Q10 of 1.77–2.26), supporting our main hypothesis. The depressor mandibulae muscle, which is responsible for ballistic mouth opening and tongue projection viathe recovery of elastic strain energy stored by the muscle prior to the onset of the movement, was activated earlier and for a longer duration at lower temperatures (Q10of 2.29–2.41), consistent with a slowing of its contractile rates. Muscle recruitment was unaffected by temperature, as revealed by the lack of thermal dependence in the intensity of activity of both the jaw depressor and jaw levator muscles (Q10of 0.754–1.12). Over the 20–35°C range, lower thermal dependence was found for the dynamics of non-elastic movements and the motor control of both elastic and non-elastic movements, in accord with a plateau of high performance found in other systems.
Supplementary material available online at http://jeb.biologists.org/cgi/content/full/214/8/1333/DC1
Peplowski and Marsh, 1997; Navas et al., 1999; McLister, 2001; Marvin, 2003a; Marvin, 2003b; Herrel et al., 2007).
Many studies that demonstrate strong thermal dependence of contractile muscle dynamics also reveal minimal to absent thermal effects on static contractile properties such as maximum isometric twitch and tetanic tension, with Q10values (i.e. R10 values, where
R10is equivalent to Q10but is applied only to non-rate properties)
of about 1.0 and sometimes lower. Tetanic tension remains approximately constant across a range of temperatures, while twitch tension may even increase slightly as temperature drops (Hill, 1951; Bennett, 1984). The thermal independence of static contractile properties of muscle suggests that behaviors for which performance relies upon the strength of isometric muscle contractions will themselves be relatively thermally independent. In fact, peak bite force, an ecologically relevant performance parameter in defense and feeding, has been shown in the lizard Trapelusto be largely independent of temperature between 20 and 38°C; peak tetanic force of a major mouth closing muscle in this species also shows almost complete thermal independence over this range (Herrel et al., 2007). Ballistic movements such as jumping and tongue projection in many species do not rely on rapid muscle contraction or high muscle power output, but instead are powered by rapid recoil of elastic structures that are first loaded by much slower muscle contractions (Bennet-Clark, 1976a; Bennet-Clark, 1976b; Roberts and Azizi, 2011). In a classic example, jumping fleas load a resilin pad using the femoral depressor muscle during the preparatory phase prior to the jump, and allow the pad to recoil against isometrically contracted muscle to extend the legs and launch the flea into the air (Bennet-Clark and Lucey, 1967). Storing muscle energy in elastic structures enables the power of the jump to far exceed the power output of the muscle in a variety of animals including fleas, locusts, beetles and bushbabies, as the muscle energy is released more quickly than it was stored (Bennet-Clark, 1975; Aerts, 1998). For example, muscle power can be amplified 1000 times in the jump of the click beetle (Bennet-Clark, 1976a). Much like jumping in insects, ballistic tongue projection in chameleons and salamanders involves amplification of muscle power (10–100 times) viastorage of energy in collagen fibers within the projector muscles (de Groot and van Leeuwen, 2004; Deban et al., 2007). Rapid release of energy from elastic structures allows ballistic movements to be among the most dynamically extreme of all animal movements in the acceleration and mechanical power that is achieved.
In addition to this high acceleration and power output, another potential benefit of elastic recoil mechanisms, which we examine in this study, is decreased thermal dependence of movement. Ballistic movements that are powered by rapid recoil of elastic structures loaded by slow or near-isometric muscle contraction may have low thermal dependence. By temporally decoupling muscle contraction from movement, ballistic systems like jumping and tongue projection may circumvent the influence of temperature on muscle performance that many locomotor systems experience. Through its effects on muscle dynamics such as time to peak tension, low temperature is expected to slow the rate of loading of elastic structures and to prolong muscle activity, but because peak isometric tension can be thermally independent, temperature may not alter the amount of energy that is stored in elastic structures. Further, stiffness of elastic tissues in animals – collagen, resilin and other animal protein rubbers – shows either very low thermal dependence (Q10of 1.03–1.11) (Alexander, 1966; Denny and Miller, 2006) or
complete thermal independence (Rigby et al., 1959). Therefore, temperature is not expected to affect the rate of recoil of elastic structures or, in turn, the performance of the movement. Consistent
with this reasoning, elastically powered ballistic tongue projection in chameleons displays relative thermal independence with Q10
values of less than 1.3, which contrasts with the strong thermal dependence of muscle-powered tongue retraction (Anderson and Deban, 2010).
Independently from chameleons, toads of the genus Bufohave evolved ballistic prey capture that makes use of elastic recoil to power rapid mouth opening and tongue projection (Nishikawa, 2000; Lappin et al., 2006). In a mechanism called inertial elongation, the tongue is whipped from the mouth by the accelerating mandible to which it is attached anteriorly; as the tongue rotates, or flips, over the mandible tip it also elongates to over 200% of resting length (Nishikawa, 2000). Activation of the bilaterally paired mouth opening muscle, m. depressor mandibulae (DM), for up to 250ms prior to mouth opening and deactivation of the muscle at the start of mouth opening temporally separates muscle contraction from the ballistic mouth opening movement, and thus allows this movement to achieve extremely high acceleration and mechanical power. Power of ballistic mouth opening in Bufo alvarius reaches a peak of 9600Wkg–1of DM mass, far beyond what the muscles can produce
directly. The tongue is then retracted by contraction of the hyoglossus muscle, transporting the prey into the mouth. Prey transport is accompanied by further mouth opening followed by mouth closing after the tongue is withdrawn. The prey capture behavior of Bufois an ideal system for examining temperature effects because it comprises both elastically powered movements (mouth opening and tongue projection) and muscle-powered movements (tongue retraction and mouth closing).
We examined feeding in Bufo terrestris to test several hypotheses regarding temperature effects on the dynamics and motor control of both ballistic and non-ballistic movements. We hypothesized that the elastic recoil mechanism of ballistic mouth opening of toads liberates the movement from thermal effects on muscle contractile rates, and as a consequence ballistic prey capture (i.e. mouth opening and tongue projection) in Bufoshould show thermal independence (Q10⬇1). We also expected that the duration
of activation of the mouth opening muscles would show thermal dependence (Q10⬇2), commensurate with typical contractile rate
properties and the assumption that the muscles achieve the same peak tension at all temperatures. We predicted, however, that the intensity of muscle activation would be maximal at all temperatures. Further, we hypothesized that non-ballistic movements associated with prey transport, such as tongue retraction and mouth closing, would show thermal dependence (Q10⬇2). To test these hypotheses we performed kinematic and
dynamics analyses of high speed image sequences, and corresponding electromyographic recordings of the main mouth opening and closing muscles, from prey capture events occurring across a range of body temperatures (11–35°C).
MATERIALS AND METHODS
Four B.terrestrisBonnaterre 1789 (3.9–8.2cm snout–vent length) were collected locally in Tampa, FL, USA, housed individually in plastic boxes at 22°C and maintained on a diet of crickets. All procedures in this study were approved by the Institutional Animal Care and Use Committee of the University of South Florida.
Electromyography
cyanoacrylate. Hook electrodes were made by threading the wire through a 30gauge hypodermic needle, removing the insulation from the glued tips of the wires, and bending the two strands away from each other at the ends.
Prior to electrode implantation, toads were anesthetized by immersion in a 1gl–1 buffered aqueous solution of MS-222
(3-aminobenzoic acid ethyl ester; Sigma, St Louis, MO, USA) for 10–30min. For surgery each toad was positioned on its left side on moist paper towels on the stage of a dissecting microscope (Wild Heerbrugg M5 Stereomicroscope, Leica Microsystems GmbH, Wetzlar, Germany). Using 30gauge hypodermic needles, electrodes were implanted through two incisions in the skin of the right side of the head into the DM, which originates on the posterior aspect of the cranium and inserts onto the retroarticular process of the lower jaw, and into the m. levator mandibulae posterior longus (LM), which originates on the dorsal and lateral aspects of the cranium and inserts onto the dorso-medial surface of the mandible rostral to the jaw joint. As in other non-mammalian tetrapods the DM functions as a first-order lever to open the mouth and the LM (i.e. adductor mandibulae) functions as a third-order lever to close the mouth. In toads the tympanum serves as an external landmark that widely separates the belly of the DM from that of the LM [see fig.2 of Lappin et al. (Lappin et al., 2006)].
After electrode implantation the needles were withdrawn leaving the wire held in place by the hooks of the electrode tip. Incisions were closed with polypropylene monofilament suture with suture knotted around each electrode pair where it exited the incision, and the electrodes were bonded to the suture with veterinary-grade cyanoacrylate. Electrode wires from both recording sites were bundled together, sutured to the skin of the side of the head and at the dorsal midline, bonded to the sutures with cyanoacrylate, and all glued together along their length with modeling cement. The ends of the wires were stripped and soldered to a 40-pin plug, which mated with a socket on the amplifier probe.
Electromyographic (EMG) signals were amplified 2000 times using a 16-channel differential amplifier (A-M Systems 3500) and filtered to remove 60Hz line noise. Conditioned signals were sampled at 4kHz with a PowerLab 16/30 analog-to-digital converter coupled with LabChart software version 6 (AD Instruments Pty Ltd, Town, New South Wales, Australia) running on a Dell laptop PC. EMG recordings were synchronized with digital images viaa trigger shared with the camera. Clean EMG signals were obtained from both muscles of all four individuals for all feedings.
Feeding experiments
After recovery from surgery (12–24h), toads were imaged at 6kHz frame rate and 1/12,000s shutter speed with a Fastcam 1024 PCI camera (Photron USA Inc., San Diego, CA, USA) as they captured crickets and beetles. All feeding trials and recordings were conducted within 3days of surgery. Toads were positioned individually on a feeding stage of moistened foam rubber within a glass aquarium. Toads moved about unrestrained on the feeding stage and prey crickets and beetles were positioned at various distances in front of the toads to obtain lateral camera views of the toads during prey capture bouts. Because of movements of the toads within the imaging area, of the 109 feedings recorded, 65 yielded kinematic timing and EMG data, and a subset of 40 yielded the additional distance data necessary for the calculation of dynamics parameters. Only feedings in which toads were judged during the experiment to be oriented within approximately 15deg of the focal plane of the camera were used for this latter subset. A cm scale was imaged in the same plane as the toad following each feeding to calibrate distances.
Feeding trials were conducted across a range of ambient temperatures (10–38°C) within an environmental chamber (Environmental Growth Chambers, Chagrin Falls, OH, USA). These temperatures were selected to encompass a range in which feedings could be reliably elicited, to be within the toads’ thermal tolerance, and to span a range wide enough to detect potentially subtle effects of temperature. Each toad experienced each ambient temperature once as well as a unique sequence of ambient temperatures with regard to the direction and magnitude of temperature change. The temperature of the toad’s head was measured immediately after each feeding using an infrared thermometer (Sixth Sense LT300, Williston, VT, USA; ±1°C accuracy). Toad temperatures ranged from 11 to 35°C.
Anatomy
Following feeding experiments, toads were killed with an overdose of MS-222 and electrode placement was confirmed by dissection. The mandible plus tongue and the paired DM were removed and masses were measured to ±0.001g with a VB-302A digital balance (Virtual Measurements & Control, Santa Rosa, CA, USA). The mandible plus tongue specimen included all connective tissue and skin of the lower jaw. The distance from the jaw joint to the center of mass (CoM) of the mandible plus tongue was determined using a digital balance and a ruler as follows. A ruler was placed with one end on the digital balance and the other end on a fixed support, after which the balance was zeroed. The mandible plus tongue specimen was then placed in a resting position on the ruler with the mandibular symphysis facing the balance. The mass reported by the balance was divided by the mass of the specimen to yield the distance of the specimen’s CoM from the fixed support as a percentage of the total distance between the balance and the fixed support. For example, if the CoM of the specimen was positioned on the ruler exactly halfway between the support and the balance, the balance would register 50% of the mass of the specimen, indicating that the CoM is positioned at 50% of the total distance, measured from the fixed support. Likewise, if the specimen’s CoM was positioned 75% of the distance from the support to the balance, the balance would register 75% of the mass of the specimen. The distance between the CoM and the jaw joint was then measured with calipers, to be used along with the mass of the mandible plus tongue in dynamics calculations of ballistic mouth opening (below). Finally, the length of the mandible from the jaw joint center to the mandibular symphysis, perpendicular to the midline of the jaws, and the length of the retroarticular process of the mandible were measured with calipers.
Kinematic and dynamic analyses
The timing and amplitude of movements of the mandible and tongue during prey capture, with respect to the maxilla as a fixed reference, were quantified from the digital image sequences. The positions of four anatomical landmarks were recorded from the image sequences using NIH ImageJ software running on an Apple iMac computer: (1) tip of the upper jaw, (2) tip of the mandible, (3) tip of the tongue and (4) jaw joint. Distances and angles were computed from these position data: (1) gape distance, or the distance between mandible and upper jaw tips, (2) gape angle in radians, computed as gape distance divided by anatomical mandible length, and (3) tongue reach, or the distance from the tongue tip to the mandible tip.
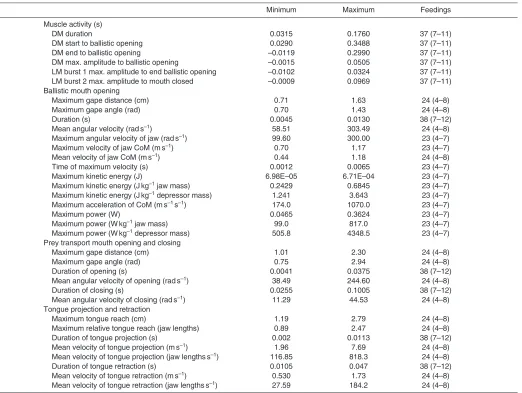
maximum tongue reach, (4) start of tongue retraction, (5) start of mouth opening associated with prey transport (i.e. ‘transport mouth opening’), (6) end of mouth opening, (7) end of tongue retraction, or the time the tongue tip reaches the position of the jaw angle at the rear of the buccal cavity, and (8) end of mouth closing. Durations of movements were calculated from these timing variables (Fig.1, Tables1 and 2). The distance, angular and duration data were used to calculate mean linear and angular velocities of ballistic mouth opening, mouth opening associated with prey transport, and mouth closing, as well as mean linear velocities of tongue projection and retraction.
In addition to kinematics, the dynamics variables of ballistic mouth opening were calculated from the position data. Gape angle and gape distance were recorded for each image of ballistic mouth opening at 6kHz. To calculate the distance moved by the CoM of the mandible plus tongue (as measured in ‘Anatomy’ above), gape distance was multiplied by the percentage of mandible length that the CoM lies from the jaw joint. Because this distance represents changes in position of a point moving in an arc relative to another point and thus represents chord distance, the distance was converted to arc distance (i.e. displacement of the CoM along an arc) trigonometrically using gape angle and the radius of the arc (i.e. the distance from the jaw joint of the CoM of the mandible plus tongue). These arc distance data and gape angle data were
then smoothed using a quintic spline with the Pspline package in R statistical software (www.r-project.org). First and second derivatives of the spline function were computed to yield instantaneous velocity and acceleration, respectively, at a final interpolated rate of 10kHz.
Mass-specific instantaneous power of ballistic mouth opening in each prey capture event was calculated as the product of the acceleration and velocity of the CoM. Because ballistic mouth opening involves acceleration of the mandible, tongue and associated skin and connective tissue, absolute power output was computed by multiplying mass-specific power by the mass of the mandible plus tongue of the same individual toad (as measured in ‘Anatomy’ above). To calculate muscle mass-specific power output, this absolute power value was divided by the combined mass of the paired DM from the same individual. Maximum kinetic energy was calculated from the mass of the mandible plus tongue and the peak velocity achieved during ballistic mouth opening. Maximum values of velocity, acceleration, kinetic energy and power were used to examine the effects of temperature.
Analysis of electromyograms
The amplitudes of activity of the DM and LM and the timing of activity relative to kinematic events were quantified from the rectified EMG signals using AD Instruments LabChart software version 6 running on an Apple iMac computer. Bursts of activity with clear bounds were discernible only for the activity of the DM prior to mouth opening; the LM showed activity that was more dispersed in time, as did activity of the DM associated with prey transport. Therefore the duration of activity was measured only for the first burst of the DM. Onset of activity of the DM was defined as the signal reaching twice background noise level for at least 10ms; the end of activity was likewise defined as the signal dropping below twice the noise level for at least 10ms.
The duration of activity of the DM prior to ballistic mouth opening was hypothesized to increase with decreasing temperature because of the slowing of rate at which the muscle builds tension. Likewise, the latencies from the onset of DM activity and peak of DM activity to the start of ballistic mouth opening (Fig.1) were expected to be greater at colder temperatures. The delay between activity of the DM and the start of ballistic mouth opening was quantified using three variables: (1) start of DM activity, (2) end of DM activity and (3) peak of DM activity (peak of root mean square, r.m.s.).
Unlike the duration of DM activity, the intensity of DM activity was expected to remain constant, under the assumption that muscle recruitment is maximized at all temperatures. Integrated area was measured for the DM as the sum of the values of the rectified signal between onset and end of activity, and intensity of the EMG burst was measured as (1) the r.m.s. within this period and (2) integrated area divided by duration of activity. Peak amplitude of muscle activity was measured as the maximum r.m.s. value using a 20ms time constant (i.e. the moving 20ms time window over which the r.m.s. was calculated).
Latencies between LM activity and mouth closing movements were expected to increase with decreasing temperature, because rates of muscle tension development and shortening slow at colder temperatures. The relationship between LM activity and the slowing of mandible depression (i.e. braking) at the end of ballistic mouth opening was measured as the time between the r.m.s. peak of the first burst of activity of LM and the end of ballistic mouth opening. The relationship between LM activity and mouth closing was measured as the time from peak r.m.s. activity of the second burst of the LM to the end of mouth closing (Fig.1, bottom trace). r.m.s.
BMO TMO MC
TP TR
Tongue reach
Gape
DM EMG
[image:4.612.52.285.68.266.2]LM EMG
Statistical analyses
All kinematic, dynamic and EMG data were log10transformed prior
to statistical analysis. This transformation was performed because both the body temperature at which feedings occurred and the body size of the individual toads were expected to have an exponential relationship with the kinematic, dynamic and EMG variables. The dataset was divided into two overlapping subsets based on the temperature at which prey capture occurred, 11–25°C and 20–35°C, to examine whether the same thermal relationship held across the entire range. The lower range was expected to capture strong effects of temperature, whereas the upper range was expected to capture weaker effects, based on published results from other ectotherms (van Berkum, 1986; Huey and Kingsolver, 1993; Bauwens et al., 1995; Huey and Kingsolver, 1989). The ranges (i.e. subsets) were overlapping by 5°C because many feedings were recorded in the 20–25°C range and this increased the number of feedings within each subset, and because we had no a prioriexpectation of an exact temperature at which thermal effects would transition from strong to weak. A separate analysis of covariance (ANCOVA) was conducted on each subset of the data to examine three effects on
the variables: (1) temperature, (2) individual and (3) prey distance (Tables3 and 4 and supplementary material Tables S1 and S2). Temperature effects were included as a continuous variable to examine how elastically powered and non-elastic movements and their motor control responded to changes in body temperature. An individual effect was included to account for differences in body size and other random individual differences, and for characteristics of the EMG electrodes and resulting variation in signal strength. Prey distance was included because it has been found in another study to influence prey capture kinematics (Lappin et al., 2006); it was dropped from the model when non-significant for a given variable to increase sample size and statistical power. Prey distance was consequently retained in the model for only three of the 27 variables (see Results), but in none of these cases did its inclusion change the significance of the temperature effect. A simultaneous Bonferroni correction for experiment-wise error adjusted the significance level from of ≤0.05 to 0.0019 (for 27 tests corresponding to the 27 variables examined).
Temperature coefficients (Q10) for each performance variable
[image:5.612.47.567.88.481.2]were computed across each temperature range (11–25°C and Table 1. Minimum and maximum values of kinematic, dynamic and electromyographic variables of prey capture in four Bufo terrestrisfrom
the 11–25°C temperature range
Minimum Maximum Feedings
Muscle activity (s)
DM duration 0.0498 0.3205 52 (6–22)
DM start to ballistic opening 0.0523 0.3488 52 (6–22)
DM end to ballistic opening –0.0303 0.2990 52 (6–22)
DM max. amplitude to ballistic opening –0.0015 0.1863 52 (6–22)
LM burst 1 max. amplitude to end ballistic opening –0.0102 0.0394 52 (6–22)
LM burst 2 max. amplitude to mouth closed 0.0028 0.1937 53 (6–23)
Ballistic mouth opening
Maximum gape distance (cm) 0.69 1.63 35 (4–13)
Maximum gape angle (rad) 0.70 1.44 35 (4–13)
Duration (s) 0.0036 0.019 56 (6–23)
Mean angular velocity (rads–1) 53.36 303.49 35 (4–13)
Maximum angular velocity of jaw (rads–1) 107.79 300.0 31 (4–12)
Maximum velocity of jaw CoM (ms–1) 0.66 1.17 31 (4–12)
Mean velocity of jaw CoM (ms–1) 0.36 1.18 35 (4–13)
Time of maximum velocity (s) 0.0012 0.0065 31 (4–12)
Maximum kinetic energy (J) 5.49E–05 6.71E–04 31 (4–12)
Maximum kinetic energy (Jkg–1jaw mass) 0.2185 0.6845 31 (4–12)
Maximum kinetic energy (Jkg–1depressor mass) 1.116 3.643 31 (4–12)
Maximum acceleration of CoM (ms–1s–1) 174.0 1440.0 31 (4–12)
Maximum power (W) 0.0414 0.3624 31 (4–12)
Maximum power (Wkg–1jaw mass) 88.0 773.0 31 (4–12)
Maximum power (Wkg–1depressor mass) 449.6 4114.4 31 (4–12)
Prey transport mouth opening and closing
Maximum gape distance (cm) 1.11 2.31 35 (4–13)
Maximum gape angle (rad) 1.08 2.94 35 (4–13)
Duration of opening (s) 0.0070 0.0560 56 (6–23)
Mean angular velocity of opening (rads–1) 22.09 244.60 35 (4–13)
Duration of closing (s) 0.0270 0.1970 56 (6–23)
Mean angular velocity of closing (rads–1) 6.28 44.53 35 (4–13)
Tongue projection and retraction
Maximum tongue reach (cm) 1.16 2.96 35 (4–13)
Maximum relative tongue reach (jaw lengths) 0.93 2.47 35 (4–13)
Duration of tongue projection (s) 0.002 0.014 55 (6–22)
Mean velocity of tongue projection (ms–1) 1.56 7.69 35 (4–13)
Mean velocity of tongue projection (jaw lengthss–1) 95.93 818.3 35 (4–13)
Duration of tongue retraction (s) 0.0134 0.065 55 (6–22)
Mean velocity of tongue retraction (ms–1) 0.178 1.73 35 (4–13)
Mean velocity of tongue retraction (jaw lengthss–1) 16.47 184.2 35 (4–13)
20–35°C) from the partial regression coefficients of the temperature effect in the ANCOVAs, because the ANCOVA model includes effects of individual toad (and in some cases prey distance) that influence the estimate of the relationship between temperature and the performance variable. The Q10 value for each variable was
calculated as the base 10 antilogarithm of the partial regression coefficient of the temperature effect (PRC) multiplied by 10:
Q1010(PRC ⫻10). (1)
Temperature coefficients of duration variables are reported as inverse Q10values (i.e. 1/Q10) to express them as rates. Statistical
analyses were performed on an Apple iMac computer using JMP 5.1 software (SAS Institute, Cary, NC, USA).
RESULTS Prey capture kinematics
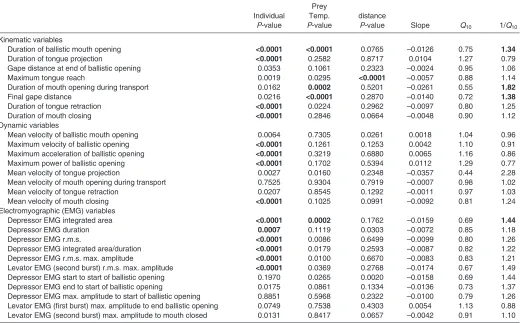
Toads captured prey by ballistic tongue projection, sometimes combined with a forward lunge of the body. The mouth was opened in two phases; ballistic mouth opening associated with tongue projection followed by a second phase during tongue retraction and prey transport. The two phases were separated by a pause when the
tongue elongated to maximum length and adhered to the prey. The tongue was then retracted, simultaneous with the second phase of mouth opening that accommodated the prey, immediately after which the mouth was closed, typically with the prey delivered to the rear of the buccal cavity and clear of the jaws (Fig.2 and supplementary material Movie1).
Considering feedings examined across the entire 11–35°C range, ballistic mouth opening required 0.0036–0.019s, mouth opening during prey transport took 0.0041–0.056s and mouth closing took 0.026–0.197s, based upon 70 total feedings and 10–24 feedings per individual. Gape angle after ballistic mouth opening was 0.7–1.4rad, and this was increased to 0.75–2.9rad in the second phase of mouth opening based upon 44 total feedings and 8–13 feedings per individual. Tongue projection required 0.002–0.014s and tongue retraction took longer, at 0.011–0.065s (69 feedings, 10–23 per individual). The tongue was projected 0.89–2.5 mandible lengths (44 feedings, 8–13 per individual) beyond the tip of the mandible. Summary results from the two temperature ranges are shown in Tables1 and 2.
[image:6.612.49.571.88.481.2]Temperature had a significant effect on three kinematic variables across the 11–25°C range (Fig.3, Table3 and supplementary Table 2. Minimum and maximum values of kinematic, dynamic and electromyographic variables of prey capture in four B. terrestrisfrom the
20–35°C temperature range
Minimum Maximum Feedings
Muscle activity (s)
DM duration 0.0315 0.1760 37 (7–11)
DM start to ballistic opening 0.0290 0.3488 37 (7–11)
DM end to ballistic opening –0.0119 0.2990 37 (7–11)
DM max. amplitude to ballistic opening –0.0015 0.0505 37 (7–11)
LM burst 1 max. amplitude to end ballistic opening –0.0102 0.0324 37 (7–11)
LM burst 2 max. amplitude to mouth closed –0.0009 0.0969 37 (7–11)
Ballistic mouth opening
Maximum gape distance (cm) 0.71 1.63 24 (4–8)
Maximum gape angle (rad) 0.70 1.43 24 (4–8)
Duration (s) 0.0045 0.0130 38 (7–12)
Mean angular velocity (rads–1) 58.51 303.49 24 (4–8)
Maximum angular velocity of jaw (rads–1) 99.60 300.00 23 (4–7)
Maximum velocity of jaw CoM (ms–1) 0.70 1.17 23 (4–7)
Mean velocity of jaw CoM (ms–1) 0.44 1.18 24 (4–8)
Time of maximum velocity (s) 0.0012 0.0065 23 (4–7)
Maximum kinetic energy (J) 6.98E–05 6.71E–04 23 (4–7)
Maximum kinetic energy (Jkg–1jaw mass) 0.2429 0.6845 23 (4–7)
Maximum kinetic energy (Jkg–1depressor mass) 1.241 3.643 23 (4–7)
Maximum acceleration of CoM (ms–1s–1) 174.0 1070.0 23 (4–7)
Maximum power (W) 0.0465 0.3624 23 (4–7)
Maximum power (Wkg–1jaw mass) 99.0 817.0 23 (4–7)
Maximum power (Wkg–1depressor mass) 505.8 4348.5 23 (4–7)
Prey transport mouth opening and closing
Maximum gape distance (cm) 1.01 2.30 24 (4–8)
Maximum gape angle (rad) 0.75 2.94 24 (4–8)
Duration of opening (s) 0.0041 0.0375 38 (7–12)
Mean angular velocity of opening (rads–1) 38.49 244.60 24 (4–8)
Duration of closing (s) 0.0255 0.1005 38 (7–12)
Mean angular velocity of closing (rads–1) 11.29 44.53 24 (4–8)
Tongue projection and retraction
Maximum tongue reach (cm) 1.19 2.79 24 (4–8)
Maximum relative tongue reach (jaw lengths) 0.89 2.47 24 (4–8)
Duration of tongue projection (s) 0.002 0.0113 38 (7–12)
Mean velocity of tongue projection (ms–1) 1.96 7.69 24 (4–8)
Mean velocity of tongue projection (jaw lengthss–1) 116.85 818.3 24 (4–8)
Duration of tongue retraction (s) 0.0105 0.047 38 (7–12)
Mean velocity of tongue retraction (ms–1) 0.530 1.73 24 (4–8)
Mean velocity of tongue retraction (jaw lengthss–1) 27.59 184.2 24 (4–8)
material TableS1): duration of mouth opening during prey transport (1/Q101.64; P0.0003), duration of mouth closing (1/Q102.18;
P<0.0001) and duration of tongue retraction (1/Q101.57;
P0.0012). Temperature did not significantly affect the duration of ballistic mouth opening (1/Q101.34; P0.1449), the gape at the end
of ballistic opening (Q101.00; P0.8688), the duration of tongue
projection (1/Q101.27; P0.1668), the final gape distance
(Q101.03; P0.2725) or maximum tongue reach (Q101.07;
P0.1464; Fig. 2).
Across the 20–35°C range (Fig.3, Table4 and supplementary material TableS2), temperature had a significant effect on the duration of ballistic mouth opening (1/Q101.34; P<0.0001),
duration of mouth opening during prey transport (1/Q101.82;
P0.0002) and final gape distance (Q100.72; P<0.0001). No
significant effect of temperature was found for the gape at the end of ballistic opening (Q100.95; P0.1061), duration of mouth
closing (1/Q101.12; P0.2846), duration of tongue projection
(1/Q100.79; P0.2582), duration of tongue retraction (1/Q101.25;
P0.0224) or maximum tongue reach (Q100.88; P0.0295). Across
both temperature ranges, prey distance affected only maximum tongue reach (P<0.0001), which was shorter for nearer prey (Tables3 and 4).
Prey capture dynamics
Considering feedings examined across the entire 11–35°C range, ballistic mouth opening achieved a peak angular velocity of 100–300rads–1and an mean angular velocity of 53–303rads–1based
on 44 total feedings and 8–13 feedings per individual (Fig.4). The CoM of the mandible plus tongue reached a maximum linear velocity of 0.66–1.17ms–1 and a maximum linear acceleration of
174–1440ms–2. Peak velocity and kinetic energy were achieved
1.2–6.5ms after the start of mandible movement. Maximum kinetic energy was 0.05–0.67mJ; mass-specific kinetic energy was 1.1–3.6Jkg–1 of depressor muscle mass; peak power reached
0.04–0.36 W, and mass-specific peak power was 450–4349Wkg–1
depressor muscle mass. These last six dynamics calculations were based on a total of 40 feedings, 8–12 per individual (Fig.4). The second phase of mouth opening was slower, at 22–245rads–1, as
was mouth closing at 6.3–45rads–1. Tongue projection velocity was
1.6–7.7ms–1or 96–818 mandible lengthss–1, while tongue retraction
was slower, at 0.17–1.7ms–1or 16–184 mandible lengthss–1. These
final four calculations were based on 44 total feedings, 8–13 feedings per individual.
Temperature significantly affected only three dynamics variables across the 11–25°C range (Figs3–5 and Table3): the mean velocity of transport mouth opening (Q102.00; P<0.0001),
mean velocity of mouth closing (Q102.26; P<0.0001) and mean
velocity of tongue retraction (Q101.77; P<0.0001). Dynamics
variables that were not significantly affected by temperature included the mean velocity of ballistic mouth opening (Q101.13;
P0.0121), maximum velocity of ballistic mouth opening (Q101.06; P0.1425), maximum acceleration of ballistic mouth
opening (Q100.99; P0.8950), maximum power of ballistic
[image:7.612.46.566.79.404.2]mouth opening (Q101.10; P0.4343) and mean velocity of Table 3. Results of ANCOVA examining effects on kinematic, dynamic and electromyographic variables over the 11–25°C range
Prey
Individual Temp. distance
P-value P-value P-value Slope Q10 1/Q10
Kinematic variables
Duration of ballistic mouth opening 0.6973 0.1449 0.1119 –0.0127 0.75 1.34
Duration of tongue projection 0.0044 0.1668 0.3659 –0.0105 0.78 1.27
Gape distance at end of ballistic opening 0.0020 0.8688 0.0110 –0.0002 1.00 1.00
Maximum tongue reach 0.0167 0.1464 <0.0001 0.0028 1.07 0.94
Duration of mouth opening during transport 0.5418 0.0003 0.6559 –0.0214 0.61 1.64
Final gape distance <0.0001 0.2725 0.0068 0.0012 1.03 0.97
Duration of tongue retraction 0.0256 0.0012 0.0331 –0.0196 0.64 1.57
Duration of mouth closing 0.3021 <0.0001 0.5633 –0.0339 0.46 2.18
Dynamic variables
Mean velocity of ballistic mouth opening <0.0001 0.0121 0.0660 0.0053 1.13 0.89
Maximum velocity of ballistic opening <0.0001 0.1425 0.0262 0.0025 1.06 0.94
Maximum acceleration of ballistic opening <0.0001 0.8950 0.6371 –0.0006 0.99 1.01
Maximum power of ballistic opening <0.0001 0.4343 0.0647 0.0042 1.10 0.91
Mean velocity of tongue projection <0.0001 0.0857 0.2727 0.0097 1.25 0.80
Mean velocity of mouth opening during transport 0.6133 <0.0001 0.0887 0.0302 2.00 0.50
Mean velocity of tongue retraction 0.0619 <0.0001 <0.0001 0.0247 1.77 0.57
Mean velocity of mouth closing 0.0010 <0.0001 0.9841 0.0354 2.26 0.44
Electromyographic (EMG) variables
Depressor EMG integrated area <0.0001 <0.0001 <0.0001 –0.0343 0.45 2.20
Depressor EMG duration <0.0001 <0.0001 0.1449 –0.0381 0.42 2.41
Depressor EMG r.m.s. 0.0035 0.0254 0.0059 0.0081 1.20 0.83
Depressor EMG integrated area/duration 0.1850 0.1661 0.0032 0.0049 1.12 0.89
Depressor EMG r.m.s. max. amplitude 0.7349 0.1280 0.0545 0.0050 1.12 0.89
Levator EMG (second burst) r.m.s. max. amplitude <0.0001 0.0749 0.3593 –0.0123 0.75 1.33
Depressor EMG start to start of ballistic opening 0.0045 <0.0001 0.0070 –0.0360 0.44 2.29
Depressor EMG end to start of ballistic opening 0.0033 0.2954 0.9636 0.0090 1.23 0.81
Depressor EMG max. amplitude to start of ballistic opening 0.9674 <0.0001 0.4487 –0.0563 0.27 3.66
Levator EMG (first burst) max. amplitude to end ballistic opening 0.2043 0.0253 0.5845 –0.0239 0.58 1.73
Levator EMG (second burst) max. amplitude to mouth closed 0.0010 0.0013 0.9162 –0.0265 0.54 1.84
P-values are shown for individual, temperature (Temp.) and prey distance, as is the partial regression coefficient for the temperature effect (i.e. Slope) from the model from which Q10values were calculated. Prey distance was included as a covariate only when it showed a significant effect for that variable.
tongue projection (Q101.25; P0.0857). Prey distance influenced
only the mean velocity of tongue retraction (P<0.0001), which was faster for more distant prey.
Across the 20–35°C range, all dynamics variables were unaffected by temperature (Fig.3, Table4 and supplementary material TableS2): mean velocity of ballistic mouth opening (Q101.04;
P0.7305), maximum velocity of ballistic opening (Q101.10;
P0.1261), maximum acceleration of ballistic opening (Q101.16;
P0.3219), maximum power of ballistic opening (Q101.29;
P0.1702), mean velocity of transport mouth opening (Q100.98;
P0.9304), mean velocity of mouth closing (Q100.81; P0.1025),
mean velocity of tongue projection (Q100.44; P0.0160) and mean
velocity of tongue retraction (Q100.97; P0.8545). Prey distance
influenced none of the dynamics variables significantly across the 20–35°C range.
Motor control of prey capture
In feedings across the entire 11–35°C range (65 total feedings, 10–23 per individual), the DM was active for 31.5–320ms, and the start of activity preceded mouth opening by 29–349ms (Figs6 and 7). The time of end of activity of the DM ranged from 299ms before to 30ms after the start of mouth opening. The peak of activity of the DM occurred from 186ms before to 1.5ms after mouth opening. The LM was active at two times during the gape cycle; the first period of activity was associated with braking the mandible at the end of ballistic mouth opening, and the second was responsible for closing the mouth (Figs1 and 7). The first burst of LM activity
reached its peak amplitude 39ms before to 10ms after the end of ballistic opening. The second peak of LM activity occurred 194ms before to 1ms after the mouth was closed.
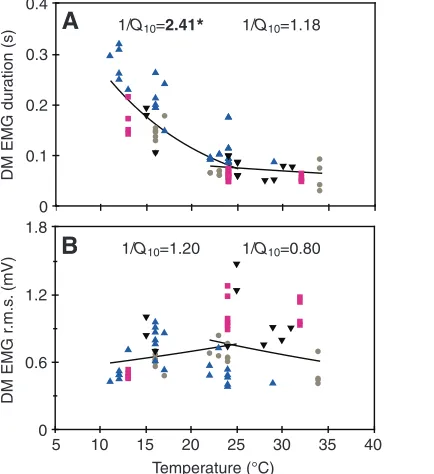
Temperature significantly affected five motor control variables across the 11–25°C range (Table3 and supplementary material TableS1): integrated area of DM (Q100.45; 1/Q102.20; P<0.0001),
duration of activity of DM (1/Q102.41; P<0.0001) (Fig.6A),
latency between onset of DM activity and start of mouth opening (1/Q102.29; P<0.0001), time from peak amplitude of DM to start
of mouth opening (1/Q103.66; P<0.0001) and time from peak
amplitude of LM activity (second burst) to end of mouth closing (1/Q101.84; P0.0013). In all cases, values of variables increased
with decreasing temperature. Prey distance influenced only the integrated area of the DM significantly across the 11–25°C range (P<0.0001), which was greater in feedings on more distant prey.
The remaining six variables showed no significant effect of temperature across the 11–25°C range: r.m.s. of DM (Q101.20;
1/Q100.83; P0.0254) (Fig.6B), integrated area of DM divided by
duration of activity of DM (Q101.12; P0.1661), peak amplitude
of DM (Q101.12; P0.1280), peak amplitude of the second burst
of LM (Q100.75; P0.0749), time from end of DM activity to start
of mouth opening (1/Q100.81; P0.2954) and time from peak LM
activity (first burst) to end of ballistic opening (1/Q101.73;
P0.0253).
[image:8.612.47.567.81.404.2]Across the 20–35°C range (Table 4 and supplementary material TableS2), only DM integrated area was significantly increased by decreasing temperature (Q100.69; 1/Q101.44; P0.0002), while the Table 4. Results of ANCOVA examining effects on kinematic, dynamic and electromyographic variables over the 20–35°C range
Prey
Individual Temp. distance
P-value P-value P-value Slope Q10 1/Q10
Kinematic variables
Duration of ballistic mouth opening <0.0001 <0.0001 0.0765 –0.0126 0.75 1.34
Duration of tongue projection <0.0001 0.2582 0.8717 0.0104 1.27 0.79
Gape distance at end of ballistic opening 0.0353 0.1061 0.2323 –0.0024 0.95 1.06
Maximum tongue reach 0.0019 0.0295 <0.0001 –0.0057 0.88 1.14
Duration of mouth opening during transport 0.0162 0.0002 0.5201 –0.0261 0.55 1.82
Final gape distance 0.0216 <0.0001 0.2870 –0.0140 0.72 1.38
Duration of tongue retraction <0.0001 0.0224 0.2962 –0.0097 0.80 1.25
Duration of mouth closing <0.0001 0.2846 0.0664 –0.0048 0.90 1.12
Dynamic variables
Mean velocity of ballistic mouth opening 0.0064 0.7305 0.0261 0.0018 1.04 0.96
Maximum velocity of ballistic opening <0.0001 0.1261 0.1253 0.0042 1.10 0.91
Maximum acceleration of ballistic opening <0.0001 0.3219 0.6880 0.0065 1.16 0.86
Maximum power of ballistic opening <0.0001 0.1702 0.5394 0.0112 1.29 0.77
Mean velocity of tongue projection 0.0027 0.0160 0.2348 –0.0357 0.44 2.28
Mean velocity of mouth opening during transport 0.7525 0.9304 0.7919 –0.0007 0.98 1.02
Mean velocity of tongue retraction 0.0207 0.8545 0.1292 –0.0011 0.97 1.03
Mean velocity of mouth closing <0.0001 0.1025 0.0991 –0.0092 0.81 1.24
Electromyographic (EMG) variables
Depressor EMG integrated area <0.0001 0.0002 0.1762 –0.0159 0.69 1.44
Depressor EMG duration 0.0007 0.1119 0.0303 –0.0072 0.85 1.18
Depressor EMG r.m.s. <0.0001 0.0086 0.6499 –0.0099 0.80 1.26
Depressor EMG integrated area/duration <0.0001 0.0179 0.2593 –0.0087 0.82 1.22
Depressor EMG r.m.s. max. amplitude <0.0001 0.0100 0.6670 –0.0083 0.83 1.21
Levator EMG (second burst) r.m.s. max. amplitude <0.0001 0.0369 0.2768 –0.0174 0.67 1.49
Depressor EMG start to start of ballistic opening 0.1970 0.0265 0.0020 –0.0158 0.69 1.44
Depressor EMG end to start of ballistic opening 0.0175 0.0861 0.1334 –0.0136 0.73 1.37
Depressor EMG max. amplitude to start of ballistic opening 0.8851 0.5968 0.2322 –0.0100 0.79 1.26
Levator EMG (first burst) max. amplitude to end ballistic opening 0.0749 0.7538 0.4303 0.0054 1.13 0.88
Levator EMG (second burst) max. amplitude to mouth closed 0.0131 0.8417 0.0657 –0.0042 0.91 1.10
P-values are shown for individual, temperature (Temp.) and prey distance, as is the partial regression coefficient for the temperature effect (i.e. Slope) from the model from which Q10values were calculated. Prey distance was included as a covariate only when it showed a significant effect for that variable.
remaining 10 variables showed no significant temperature effect: duration of activity of DM (1/Q101.26; P0.1119) (Fig.6A), r.m.s.
of DM (Q100.80; 1/Q101.18; P0.0086) (Fig.6B), integrated area
of DM divided by duration of activity of DM (Q100.82; P0.0179),
peak amplitude of DM (Q100.83; P0.0100), peak amplitude of the
second burst of LM (Q100.67; P0.0369), latency between onset
of DM activity and start of mouth opening (1/Q101.44; P0.0265),
time from end of DM activity to start of mouth opening (1/Q101.37;
P0.0175), latency between peak amplitude of DM and start of mouth opening (1/Q101.26; P0.5968), time from peak LM activity (first
burst) to end of ballistic opening (1/Q100.88; P0.7538) and time
from peak amplitude of LM activity (second burst) to end of mouth closing (1/Q101.10; P0.8417). Prey distance influenced none of
the motor control variables significantly across the 20–35°C range.
Anatomy of the mandible
Mandible length from the joint to the mandible tip was 0.94–1.92cm (1.46±0.21cm) and retroarticular process length was 0.13–0.28cm (0.18±0.03cm). Combined mass of the paired DM muscles was 0.031–0.250g (0.13±0.05g) and the mass of the mandible plus tongue was 0.165–1.129g (0.65±0.21g). Combined DM mass was 17–22% (19±1%) of mandible plus tongue mass, and the CoM of the mandible plus tongue was positioned 39–45% (42±1.2%) of the distance from the jaw joint to the mandible tip.
DISCUSSION Prey capture kinematics
The toads in this study captured prey by ballistic tongue projection, in which the mouth was opened rapidly and the tongue flipped over
the mandible and underwent ‘inertial elongation’ (sensuNishikawa, 2000), as momentum was transferred from the accelerated mandible (Mallett et al., 2001). The tongue was then retracted into the mouth, transporting the prey into the buccal cavity. Prey transport included a second phase of mouth opening followed by mouth closing after the tongue was withdrawn. Although prey transport was slower at the lower temperatures, the toads were capable of ballistic feeding at all temperatures (11–35°C), and tongue projection distance and gape distance were unaffected by temperature.
The effects of temperature on the durations of movements differed across the two temperature ranges, however, indicating that the muscle physiology underlying the movements of the mandible and tongue experienced different thermal effects. In the lower temperature range (11–25°C), ballistic movements – ballistic mouth opening and tongue projection – showed no effect of temperature in their durations or excursions and exhibited low Q10 values of
1.0–1.3. The durations of non-ballistic movements during prey transport – mouth opening, tongue retraction and mouth closing – were affected by temperature and showed higher Q10 values of
1.6–2.2. In the higher temperature range (20–35°C), temperature had a significant effect on duration of ballistic mouth opening, yet the Q10 was still low at 1.3, and among the non-ballistic movements
only duration of transport mouth opening and final gape distance (Q10values of 0.72–1.82) were affected by temperature (Table4).
These results combined with the fact that the durations of mouth closing and tongue retraction showed no effect of temperature and low Q10 values (1.1–1.3) indicate a plateau of high performance
and low thermal sensitivity at the higher end of the temperature range.
M
M R
R
P P
24°C 17°C 24°C 17°C Fig. 2. Image sequences of one individual of
[image:9.612.49.400.67.411.2]A pattern of relatively high thermal dependence at lower temperatures and lower thermal dependence at moderate and high temperatures has also been observed in the muscle-powered movements of other ectotherms including swimming speed in tadpoles (Wilson and Franklin, 1999), swimming speed and jumping distance in frogs (John-Alder et al., 1989; Wilson and Franklin, 2000; Knowles and Weigl, 1990), tongue projection velocity of chameleons (Anderson and Deban, 2010) and sprint speed of lizards (Mautz et al., 1992; Marsh and Bennett, 1986; Marsh and Bennett, 1985; Bennett, 1990), as well as in the contractile rates of isolated frog skeletal muscle (Barnes and Ingalls, 1991). This pattern indicates a plateau of high performance at higher temperature (but below the abrupt decline observed near the critical thermal maximum) and often corresponds to the temperature range over which the animals thermoregulate when active (van Berkum, 1986; Huey and Kingsolver, 1993; Bauwens et al., 1995; Huey and Kingsolver, 1989). Species of Bufo have been found to select temperatures of approximately 26°C when placed in a thermal gradient (Lillywhite et al., 1973), which is within the thermal performance breadth of sprinting locomotion (Tracy et al., 1993), and within the upper temperature range in which we recorded low thermal dependence of feeding movements in B. terrestris.
Prey capture dynamics
Tongue projection in B. terrestriswas explosively dynamic at all temperatures. A toad feeding at 11°C, for example, achieved a peak acceleration of the mandible plus tongue of 393ms–2and peak power
of 598Wkg–1muscle mass. Our lowest value for peak power of
ballistic opening of 450Wkg–1muscle mass (which occurred at a
body temperature of 17°C) exceeded the maximum direct muscle power estimated for frog limb muscles during jumping (373Wkg–1
at 25°C) (Lutz and Rome, 1994). These high values and the high mean values of velocity, acceleration and power confirm that B. terrestris relies on elastic power enhancement during ballistic mouth opening, as do other toads (Lappin et al., 2006).
In contrast to ballistic mouth opening and tongue projection, mouth opening during prey transport as well as tongue retraction and mouth closing showed lower peak and mean values for the dynamics parameters. For example, tongue retraction had a mean peak velocity of 56 mandible lengthss–1 compared with 255
mandible lengthss–1for tongue projection. 0
0.5 1.0 1.5 2.0 2.5
0 0.5 1.0 1.5 2.0 2.5
11–25°C 20–35°C
Q10
1/
Q10
A
B
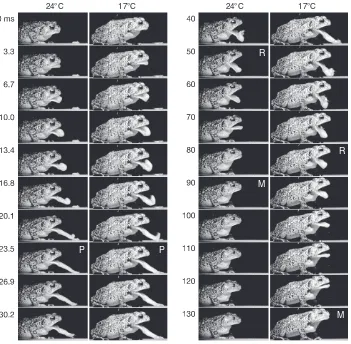
[image:10.612.331.565.66.426.2]BMO TP TMO MC TR
Fig. 3. Bar graphs of mean temperature coefficients of duration of prey capture phases (A) and the mean velocities of movements (B) across the 11–25°C range (dark gray bars) and the 20–35°C range (light gray bars). Note that the effects of temperature are greater across the lower
temperature range (dark gray bars), and that ballistic mouth opening (BMO) and tongue projection (TP) show values below 1.5 across both ranges. Non-ballistic movements – transport mouth opening (TMO), mouth closing (MC) and tongue retraction (TR) – show stronger temperature effects across the lower range. Inverse Q10values (1/Q10) are shown for durations. Q10values and standard errors (error bars) are calculated from partial regression coefficients of the temperature effect in the ANCOVA (see Materials and methods for details).
0 2000 4000 6000
5 10 15 20 25 30 35 40
B
a
lli
s
tic opening
pe
a
k po
w
er (W kg
–1
)
Temperature (°C) 0
2 4 6
8
T
ong
u
e projection
v
elocity (m
s
–1) 0 50 100 150 200 250
300
350
B
a
lli
s
tic opening
a
ng
u
l
a
r v
elocity (r
a
d
s
–1
) Q
10=1.13 Q10=1.04
Q10=1.25 Q10=0.44
Q10=1.10 Q10=1.29
C
B
A
[image:10.612.53.274.68.336.2]As was the case for kinematics, the greatest effect of temperature on dynamics was across the 11–25°C range, in which three dynamics variables were significantly affected – velocities of mouth opening during transport, mouth closing and tongue retraction – showing Q10values of 1.8–2.3 (Table3). The lack of an effect of temperature
across the 20–35°C range (Table4) on dynamics variables (Q10
values of 0.44–1.3) also points to a plateau of temperature sensitivity at the higher end of the temperatures examined, probably the result of a plateau in the thermal sensitivity of muscle dynamics.
These results provide evidence that the elastic recoil mechanism that powers ballistic mouth opening and tongue projection confers low thermal sensitivity to these movements – Q10of 1.1 for velocity
and power – over a range of temperatures that strongly influence muscle contractile dynamics. In contrast, prey transport movements that rely upon direct muscular power do not escape limitations imposed by thermal effects on muscle contractile dynamics afforded by an elastic mechanism and therefore show significant thermal sensitivity.
High power output of ballistic movements based on elastic mechanisms is widespread among animals (Roberts and Azizi, 2011) and has been shown not only in the prey capture of toads (Lappin et al., 2006) but also in the tongue projection of chameleons (Anderson and Deban, 2010; de Groot and van Leeuwen, 2004; Van Leeuwen et al., 2000) and plethodontid salamanders (Deban et al., 1997; Deban et al., 2007), the striking of mantis shrimp (Zack et al., 2009; Patek et al., 2004; Patek et al., 2007), jaw closure of trap-jaw ants (Gronenberg, 1995; Gronenberg, 1996; Patek et al., 2006), jumping of frogs (Roberts and Marsh, 2003) and bushbabies (Aerts, 1998), feeding of pipefish (Van Wassenbergh et al., 2008), and claw closure of snapping shrimp (Versluis et al., 2000). Numerous jumping insects also rely on high power output afforded by elastic recoil of springy tissues (Burrows, 2006; Burrows, 2009; Rothschild et al., 1975; Bennet-Clark and Lucey, 1967; Bennet-Clark, 1976a; Bennet-Clark, 1976b).
The mechanical properties of the tissues used to store strain energy in many of these systems have not been thoroughly studied, and the potential for thermal dependence of these properties is less well known. Nonetheless, some elastic proteins that serve as energy stores – collagen, resilin and abductin – have been found to have very low thermal dependence or complete independence (Alexander, 1966; Denny and Miller, 2006; Rigby et al., 1959). Movements that rely on recoil of these tissues to achieve their high performance may show low thermal dependence, such as jumping in fleas, which use recoil of resilin pads, in part, to launch themselves (Burrows, 2009), and suction feeding in pipefish, which rely on tendon recoil to snap the head upward (Van Wassenbergh et al., 2008). The thermal 0
10 20
30 40 50 60
5 10 15 20 25 30 35 40
Mo
u
th clo
s
ing
a
ng
u
l
a
r v
elocity (r
a
d
s
–1
)
Temperature (°C) 0
50 100 150 200 250
300
Mo
u
th opening
a
ng
u
l
a
r v
elocity (r
a
d
s
–1
) Q10=2.00* Q10=0.98
0 0.5 1.0 1.5 2.0
T
ong
u
e retr
a
ction
v
elocity (m
s
–1
)
Q10=1.77* Q10=0.97
Q10=2.26* Q10=0.81
[image:11.612.50.265.64.423.2]C
B
A
Fig. 5. Scatterplots of dynamics variables from the non-ballistic movements of all prey capture events versus temperature. Mean angular velocity of transport mouth opening (A), mean velocity of tongue retraction (B) and mean angular velocity of mouth closing (C) show strong effects of temperature across the lower range. Exponential regressions representing Q10values are overlaid on the data points across the 11–25°C and the 20–35°C ranges. Q10values are derived from partial regression coefficients of the temperature effect in the ANCOVA (see Materials and methods for details). Individual toads are shown as different symbols.
0 0.6 1.2 1.8
5 10 15 20 25 30 35 40
DM EMG r
.m.
s
. (mV)
Temperature (°C) 0
0.1 0.2 0.3
0.4
DM EMG d
u
r
a
tion (
s
) 1/Q10=2.41* 1/Q10=1.18
1/Q10=1.20 1/Q10=0.80
[image:11.612.348.565.70.307.2]B
A
dependence of the spring properties may be similarly low for the cuticular structures of arthropods, in which case the accompanying explosive movements are likely to maintain high performance across a broad range of temperatures. Some evidence exists in support of this; locusts have been reported to jump immediately upon removal from a 4°C cold room (Gabriel, 1985), and fleas have been found to retain jumping ability when cold and may use resilin as a temperature-independent energy store that allows them to jump from the cold ground to a warm host (Rothschild et al., 1975). Further research aimed at determining the temperature sensitivity of insect jumping performance and explosive actions of other arthropods would complement the current study.
Motor control of prey capture
Muscle activation patterns matched the elastic recoil mechanism of ballistic mouth opening. The mean duration of activity of the DM prior to mouth opening was 127ms, which was 13 times the mean duration of ballistic mouth opening and sufficient time for the muscles to load elastic structures with strain energy. This duration of activity was nearly identical to the latency between the start of DM activity and the start of mouth opening, at 128ms, and the range of durations (32–320ms) encompassed the range of durations of DM activity (49–247ms) recorded in B. alvarius (Lappin et al., 2006). The fact that DM activity ended 0.3ms before mouth opening, on average, and rarely ended after the start of mouth opening (Tables1 and 2)
is further evidence that ballistic opening is powered by recoil of elastic structures loaded prior to mouth opening.
Activation of the DM in B. terrestrisfor up to 320ms prior to mandible movement is consistent with a ‘bow and arrow’ mechanism of elastic recoil, as has been found or implicated in many vertebrate and invertebrate systems that show activation of muscles well in advance of ballistic movement, including mantis shrimp and trap-jaw ants (Patek et al., 2004; Patek et al., 2006; Patek et al., 2007), various jumping insects (Burrows, 2006; Burrows, 2009), pipefish (Van Wassenbergh et al., 2008) and chameleons (Anderson and Deban, 2010; de Groot and van Leeuwen, 2004; Wainwright and Bennett, 1992a; Wainwright and Bennett, 1992b).
Activity of the LM was consistent with two functions: braking the mandible at the end of ballistic mouth opening, and closing the mouth. The latency between the peak of LM activity (first burst) and the end of ballistic opening was brief, averaging 16ms, and covered a narrow range, whereas the activity associated with mouth closing (second burst) reached its peak a mean of 55ms before the mouth closed.
The character of the LM activity was quite different from that of the DM, with activity of the LM dispersed in small bursts of varying durations and intervals, compared with the well-defined large burst of the DM prior to mouth opening. These differences match the different mechanisms of movement; the DM activates maximally to load elastic structures and ceases after the appropriate strain (or stress) is achieved, while the LM is active to drive movement of the mandible against the variable gravitational load imposed by the prey.
Measures of intensity of the DM EMG signal such as integrated area divided by duration, r.m.s. and peak r.m.s. amplitude showed no significant effect of temperature across either temperature range, with Q10values of 0.8–1.2. This provides evidence that the muscle was
recruited to the same degree at all temperatures, and thus excludes the possibility that toads were holding muscle fibers in reserve when warm and recruiting them when cold. The peak r.m.s. amplitude of the LM during mouth closing was also devoid of temperature effects. The thermal independence of the intensity of muscle activation found in the jaw muscles of Bufocontrasts with findings in muscle-powered movements such as swimming in fish (e.g. scup and carp), in which more fast, white muscle fibers are recruited when fish are cold (Rome et al., 1992a; Rome et al., 1984; Rome et al., 1990) to compensate for the loss of power at low temperatures.
Changes in activity of the DM and LM of Bufoassociated with temperature were mainly changes in duration, and were more pronounced across the lower temperature range. Across the 11–25°C range, durations and latencies were longer at lower temperature (1/Q10of 1.8–3.7) and integrated area was higher (1/Q10of 2.2),
consistent with the muscle fibers requiring longer to achieve tension or to shorten. Activity durations and latencies showed a plateau in the higher temperature range (1/Q10of 0.9–1.5), which is consistent
with a thermal plateau in muscle dynamics. A pattern of higher thermal dependence of muscle contractile rates at lower temperatures has frequently been found in muscles of other organisms (Bennett, 1984; Bennett, 1985; Putnam and Bennett, 1982; Hirano and Rome, 1984; John-Alder et al., 1989; Swoap et al., 1993; Stevenson and Josephson, 1990). The EMG data here thus indicate indirectly that toad jaw muscles are typical with regard to thermal effects on their contractile properties.
CONCLUSIONS
Ballistic prey capture in B. terrestrisis accomplished by activation of jaw depressor muscles up to 320ms prior to mouth opening
BMO TMO MC
Depressor
Levator Depressor
Levator
100 ms
1 mV 24°C
[image:12.612.49.266.66.353.2]17°C