RESEARCH ARTICLE
Seasonal variation in the thermal responses to changing
environmental temperature in the world
’
s northernmost land bird
Andreas Nord1,*,‡and Lars P. Folkow2
ABSTRACT
Arctic homeotherms counter challenges at high latitudes using a combination of seasonal adjustments in pelage/plumage, fat deposition and intricate thermoregulatory adaptations. However, there are still gaps in our understanding of their thermal responses to cold, particularly in Arctic birds. Here, we have studied the potential use of local heterothermy (i.e. tissue cooling that can contribute to significantly lower heat loss rate) in Svalbard ptarmigan (Lagopus muta hyperborea)–the world’s northernmost land bird. We exposed birds kept under simulated Svalbard photoperiod to low ambient temperatures (Ta; between 0 and−30°C) during three seasons (early winter, late winter, summer), whilst recording resting metabolic rate (RMR), core temperature (Tc) and several cutaneous temperatures. Leg skin temperature varied the most, but still only by up to∼15°C, whereas body trunk skin temperature changed <1°C when Ta decreased from 0 to −30°C. At the same time, Tc increased by 0.9°C, concomitant with increased RMR. This was probably driven by the triggering of cerebral thermosensors in response to cooling of the poorly insulated head, the skin of which was 5.4°C colder at−30°C than at 0°C. Thermal conductance in winter was higher in yearlings, probably because they were time/resource constrained from acquiring a high-quality plumage and sufficient fat reserves as a result of concomitant body growth. In conclusion, Svalbard ptarmigan do not employ extensive local heterothermy for cold protection but instead rely on efficient thermogenesis combined with excellent body insulation. Hence, cold defence in the world’s northernmost land bird is not mechanistically much different from that of its lower latitude relatives.
KEY WORDS: Arctic, Heterothermy, Heat loss rate, Peripheral temperature, Seasonal acclimatization, Thermoregulation
INTRODUCTION
High-latitude animals must adapt to extreme seasonal variation in
photoperiod, precipitation, temperature and environmental
productivity. The success with which this is achieved is remarkable when considering that environmental temperatures may
be >80°C below the core temperature (Tc) of resident homeotherms
over extended periods (Irving and Krog, 1954), while daylight hours range between 0 and 24 h over the course of the year. Winter residency under such conditions comes with substantial energetic
challenges. Some mammals overcome these by hibernating, with metabolic rate sometimes dropping to <1% of normal levels and
tissue temperatures (Tt) sometimes falling below freezing (reviewed
by Ruf and Geiser, 2015). This option is probably not available for birds (but see Jaeger, 1948), which instead often vacate breeding territories to winter in more thermally and nutritionally benign habitats (Newton and Dale, 1996). Non-migratory birds (and resident mammals alike) mitigate winter energy expenditure by behavioural adjustments that reduce heat loss, such as huddling (Ancel et al., 1997; Gilbert et al., 2010), shelter building (Irving et al., 1967; Marjakangas et al., 1984) and microhabitat selection (Coulianos and Johnels, 1962; Duchesne et al., 2011), and, last but not least, through a range of morphological (e.g. moulting to obtain a more insulating winter coat) and physiological adjustments (e.g. fat deposition and thermoregulatory responses such as peripheral vasoconstriction, respiratory responses, shivering thermogenesis, etc.; reviewed by Blix, 2016).
Strong selection for energy conservation is also the reason why many non-hibernating animals in seasonal biomes are not obligate
homeotherms, but instead allowTc/Ttto decrease in all (torpor,
rest-phase hypothermia) or part of (local heterothermy) the body during inactivity. Reducing the thermal gradient towards the environment lowers the need for metabolic heat production: heat is lost at a slower rate and, hence, less energy is required to maintain heat balance. Colder tissues also have lower metabolic demands. Torpor and rest-phase hypothermia are frequently used by many small mammals and birds, for example in response to deteriorating environmental conditions and lower nutritional status (e.g. Nord et al., 2009, 2011).
This may reduce resting energy expenditure to 10–30% of normal
levels (depending on the extent ofTcdecrease; Geiser, 2004), and so
could substantially increase overwinter survival (Brodin et al., 2017). Larger, non-hibernating, homeotherms (>500 g) typically
maintain a stableTcduring cold exposure (but see Harlow, 1981),
and instead reduce the body surface-to-environment thermal
gradient through local heterothermy: a substantial decrease inTt
in the extremities and/or body periphery that is under vasomotor control (e.g. Irving and Krog, 1955). This is an important avenue for energy conservation (Scholander et al., 1950), and probably explains how some well-insulated mammals can endure extreme cold without increasing metabolism above basal levels (cf. Nilssen et al., 1984; Folkow and Mercer, 1986).
Local heterothermy also occurs in birds, studied mostly in the legs of aquatic birds where elaborate counter-current heat-exchange systems (Midtgård, 1981, 1989) allow both low- and high-latitude species to regulate and maintain foot temperature at, or close to,
ambient temperature (Ta) (Irving and Krog, 1955). This reduces heat
loss at the same time as maintaining adequate nutritional blood supply to foot tissues. Seabirds may also display local heterothermy in appendages or the body trunk when diving (Bevan et al., 1997; Handrich et al., 1997; Ponganis et al., 2003; but see Enstipp et al., 2005). This is presumably part of their diving response, which
Received 26 September 2017; Accepted 02 November 2017
1Department of Biology, Section for Evolutionary Ecology, Lund University, SE-223 62 Lund, Sweden.2Department of Arctic and Marine Biology, Arctic Animal Physiology, University of Tromsø–the Arctic University of Norway, NO-9037 Tromsø, Norway.
*Present address: Department of Arctic and Marine Biology, University of Tromsø– the Arctic University of Norway, NO-9037 Tromsø, Norway.
‡Author for correspondence (andreas.nord@biol.lu.se)
A.N., 0000-0001-6170-689X
Journal
of
Experimental
includes massive peripheral vasoconstriction causing a drop in local
energy expenditure (through a reduced supply of blood-borne O2
and substrate) as well as in localTt(as a result of lower metabolism
and reduced inflow of warm blood, causing lower heat loss rates), both of which would contribute to extending dive duration (Scholander, 1940). By comparison, the occurrence and possible energetic significance of local heterothermy in land birds has received little attention, although Ekimova (2005) report that fasting
pigeons (Columba livia) reduce leg skin temperature to nearTa.
Here, we have studied the potential use of local heterothermy in a
bird at the extreme of its range: the Svalbard ptarmigan (Lagopus
muta hyperboreaSundevall 1845). This rock ptarmigan (Lagopus
muta) subspecies is a year-round resident in the High Arctic
Svalbard archipelago (77–81°N) and, as such, it is the world’s
northernmost resident land bird. Not surprisingly, the Svalbard ptarmigan experiences an extreme environment throughout its annual cycle, where the sun does not rise above the horizon for more than 3 months in winter but is continuously above the horizon from
early April until mid-August, and where average Ta is below
freezing for 9 months of the year. Metabolic fuel is acquired from low-growing tundra vegetation (Mortensen et al., 1983), which is frequently deeply embedded in ice or snow in winter. Therefore, these birds display seasonal cycles in body composition, building fat stores in summer/autumn times of plenty that may be drawn upon during periods of reduced food availability (Mortensen et al., 1983; Mortensen and Blix, 1985). However, like many larger birds, the
Svalbard ptarmigan (and other related species) maintain
normothermic Tc even in severe cold (Irving and Krog, 1954;
Mortensen and Blix, 1986). The combination of a harsh year-round
environment and, presumably, lack of torpor/rest-phase
hypothermia renders the Svalbard ptarmigan a suitable model for
studies of local heterothermy. Accordingly, we measuredTc,Ttand
metabolic responses to experimental cold exposure (between 0 and
−30°C) in captive Svalbard ptarmigan, kept indoors under a
simulated Svalbard photoperiod, to study the thermal responses to experimental cold exposure in this bird. In particular, we were interested to see whether Svalbard ptarmigan routinely employ extensive local heterothermy of a sufficient magnitude to significantly lower heat loss rate in the cold (here defined as
marked peripheral cooling with superficial tissue/appendage temperatures approaching 0°C). Subjects were either in their first winter (when they must divide resources between growth and winter acclimatization) or in their second winter, or older (when they are physically mature). The experiment was performed at three time
points spread over the birds’annual cycle, coincident with large
natural variation in photoperiod, food intake, body condition and fasting resistance (Fig. 1). Specifically, birds were measured: (1) in early winter in constant darkness (DD), when they were in their prime body condition (Fig. 1B,C), but food intake was decreasing (Fig. 1D), presumably as a result of a seasonally regulated and hormonally mediated decrease in appetite (Stokkan et al., 1986; Reierth et al., 1999); (2) in late winter under 15 h light and 9 h dark (LD), when body condition was still high and appetite was on the
increase (Fig. 1B–D) but summer moult had not yet begun; and (3)
in summer in constant light (LL), when body condition was at its lowest and birds had moulted into their summer plumage, while
food intake was near its annual peak (Fig. 1B–D; see also Stokkan
et al., 1986). We predicted the greatest extent of peripheral cooling, and the largest energy costs of thermoregulation in response to experimental cold exposure, to be manifested in summer-adapted birds (measurement period 3, as defined above), which should be the least equipped to counter a cold challenge. Analogously, we predicted peripheral cooling to be used to the lowest extent under similar cold exposure in early winter-adapted birds (measurement period 1), when these were better protected from cold via the more
insulating winter plumage and considerable amounts of
subcutaneous fat (Mortensen et al., 1983; Mortensen and Blix, 1986; see also Fig. 1C). Finally, we predicted that the transition from early to late winter (measurement period 2) would lead to an increased extent of peripheral cooling and higher costs of thermoregulation in response to cold exposure, as a result of reduced body condition and fasting resistance (Fig. 1B,C).
MATERIALS AND METHODS Birds and housing
Twelve male Svalbard ptarmigan were used in the study. Seven of
these were captured as chicks (body mass at capture: 46–435 g
depending on developmental stage) near Longyearbyen, Svalbard
A
0 4 8 12 16 20 24
Day length (h)
B
0.7 0.9 1.1
Body mass (kg)
C
0 0.1 0.2 0.3 0.4
Nov. Jan. Mar. May Jul. Sep. Nov. Nov. Jan. Mar. May Jul. Sep. Nov. Nov. Jan. Mar. May Jul. Sep. Nov. Nov. Jan. Mar. May Jul. Sep. Nov.
Dissectible fat (kg)
D
30 40 50 60 70 80
Food intake (g day
−1
[image:2.612.49.362.505.732.2])
Fig. 1. Annual variation in experimental photoperiod, and body mass, dissectible fat and food intake for the Svalbard ptarmigan in this study.(A) Natural variation in photoperiod (including civil twilight) over the course of the year in Longyearbyen, Svalbard (78°13′N, 15°38′E)– experimental birds were exposed to a simulated version of this. (B–D) LOESS (locally weighted scatterplot smoothing) ±95% confidence interval. Solid lines represent birds that were in their second calendar year or older (i.e. 2CY+), and dashed lines represent birds that were in their first calendar year (i.e. 1CY) when the experiment started. The shaded vertical bars show experimental periods. Biometric and food intake data were collected fromn=10–12 male Svalbard ptarmigan (1CY:
n=5–7; 2CY+:n=5) over the course of the study.
Journal
of
Experimental
(78°13′N, 15°38′E), in August 2014 (i.e. 3–4 months before the start of the experiment; age category 1CY) under permission issued by the Governor of Svalbard ( permit no. 2014/00290-2 a.522-01) and the Norwegian Food Safety Authority ( permit no. 2014/
150134), whereas the remaining five (all≥2 years old; age category
2CY+) originated from a captive population (founded 1997) in the approved animal research facility at the Department of Arctic and Marine Biology, University of Tromsø, Norway. Ten birds (five wild-caught, five captive) were measured during all seasons, but two wild-caught birds were measured only during early winter as they were subsequently allocated to the breeding population (Table S1). There were two sibling pairs amongst the wild-caught birds (i.e. the total of seven birds originated from five families), whereas the captive-bred birds were all unrelated. Previous work has shown that the morphological and physiological changes associated with winter acclimatization/acclimation do not differ between captive and wild-caught Svalbard ptarmigan as long as captive birds are maintained under a simulated Svalbard photoperiod (e.g. Stokkan et al., 1986; Lindgård and Stokkan, 1989). Ethical approval for experiments was issued by the Norwegian Food Safety Authority ( permit no. 6639).
Birds were maintained singly in indoor cages (1.0×0.7×0.6 m) in light- and temperature-controlled rooms, at thermoneutrality (6.8±1.9°C, mean±s.d.; Mortensen and Blix, 1986) and under a
natural Longyearbyen (78°13′N, 15°38′E) photoperiod (Fig. 1A).
Civil twilight was added to daytime (cf. Stokkan et al., 1986). During LD periods (i.e. 30 January to 4 April, and 8 September to 11 November), lights were switched on and off abruptly by a timer (SC 28X1 Pro, Hugo Müller GmbH and Co., Schwenningen, Germany). Faint continuous light [<<1 lx at the cage door versus 766±366 lx (mean±s.d.) in LL] was provided by a red incandescent lamp during the DD period (i.e. 12 November to 29 January), to account for the fact that even the polar night is not always completely dark and to allow for bird maintenance and cage cleaning. No non-experimental light could reach the birds. Pelleted ptarmigan feed (Agrimex, Trøgstad, Norway) and water were
availablead libitum. We weighed birds (±0.1 g) and measured food
intake (±0.1 g food ingested day−1, based on 48 h consumption) at
least fortnightly, to monitor seasonal changes associated with winter
acclimation (Fig. 1B–D). Dissectible fat mass was calculated from
total body mass following Mortensen et al. (1983).
Measurement of body temperature and experimental protocol
We measured body temperature (Tc,Tt) and metabolic responses to
cold exposure (0 to−30°C) during three discrete periods (Fig. 1):
(1) early winter, when birds were under DD and subcutaneous fat deposits were largest [mean±s.e. body mass: 758.0±12.9 g (1CY)/ 1043.7± 15.1 g (2CY+); dissectible fat: 106.5±6.5 g (1CY)/251.1 ±7.6 g (2CY+)]; (2) late winter, when birds were under LD and still carried significant fat reserves [body mass: 811.4±23.4 g (1CY)/ 929.1± 20.7 g (2CY+); dissectible fat: 133.5±11.8 g(1CY)/193.1 ±10.5 g (2CY+)]; and (3) summer, when birds were under LL, in summer plumage, and fat reserves were at the yearly nadir [body mass: 712.4±21.2 g (1CY)/679.8±11.6 g (2CY+); dissectible fat: 83.5± 10.7 g (1CY)/67.0±5.9 g (2CY+)].
Birds were measured during the daytime [starting at 09:51 h (±37 min s.d.) local Tromsø time]. At the start of a measurement session, birds were collected from their cages, weighed and then immediately brought to an adjacent laboratory where they were
instrumented with 36-gauge type T (copper–constantan)
thermocouples (Omega Engineering, Stamford, CT, USA) for
temperature measurement. All thermocouples were attached by the
same person (A.N.). Specifically, we measured (1)Tcin the colon
by inserting the thermocouple 70 mm into the cloaca, and then
equipped birds to measure cutaneous (surface)Ttat four additional
sites; (2) in the dorsal scapular area (Tback); (3) over the breast
muscle (Tbreast), which is the main heat-producing tissue in birds
(Aulie, 1976); (4) at the tibiotarsus adjacent to the intratarsal joint (Ttarsus), a key site for counter-current heat exchange in several bird
species (Midtgård, 1981); and (5) at the scalp (Thead), to measure a
potential proxy for temperature change in the more thinly insulated
head/brain. All cutaneous thermocouples (tc2–5) were attached onto
the skin surface using cyanoacrylate glue (Loctite®Power Easy gel,
Henkel, Düsseldorf, Germany). A 2×7 mm rectangular piece of surgical tape was attached to the end of the thermocouple (leaving the thermosensitive junction bare) to increase the area of adhesion. The cloacal thermocouple (tc1) was covered by a blunted 10 cm polythene catheter (diameter 1.22 mm; Fortex Engineering, Lincoln, UK) and was secured to the tail feathers using surgical tape. Thermocouples were carefully threaded through the plumage and collated in a bundle contained in silicone tubing, such that no individual wires protruded from the body. All thermocouples were calibrated at 0°C (Ice point drywell model 5115) and 40°C (High precision bath model 6025, both Fluke Calibration, American Fork, UT, USA) prior to use. Instrumentation during DD was performed under illumination from a red-light head torch.
Birds were subsequently put into a 43.2 l (early winter) or 33.6 l (late winter, summer) transparent Plexiglas chamber located inside a climatic chamber (model 24/50 DU, Weiss Technik, Giessen,
Germany), for measurement ofTc,Tt and resting metabolic rate
(RMR; by use of respirometry) responses to differentTa. To ensure
that the bird could move around freely, we attached the silicone-encased thermocouple bundle to a lightweight spring connected to a swivel in the centre of the chamber roof, from where it exited the chamber through an otherwise sealed port. Corrugated cardboard was placed on the chamber floor to make it less slippery. We
subsequently subjected birds to a decreasing (starting at 0°C;n=8
birds, of which 6 were measured during all seasons as detailed
above) or an increasing (starting at −30°C; n=4 birds) sliding
temperature protocol, during which we collectedTc,Ttand RMR
data at expected thermoneutrality [Ta: −0.2±1.3°C (mean±s.d.)],
close to, but below, the lower critical temperature (Ta:−10.2±0.4°C),
and far below thermoneutrality (Ta:−30.3±0.3°C) (Mortensen and
Blix, 1986). Measurement order was randomized by coin tossing before the start of the experiment, and each bird was measured in the same order during all seasons. Given the size of the birds (range
595–1130 g; Fig. 1), we allowed them 1 h to equilibrate at eachTa
(i.e. 0,−10,−30°C) before we started to record experimental data
for 20 min. Baseline data for ambient gas composition were collected for approximately 15 min, in-between measurements of RMR. The air temperature inside the metabolic chamber was monitored with a 20-gauge type T thermocouple (Omega Engineering) positioned in the chamber ceiling, at a height at which heat produced by the bird did not affect the reading. Measurements during DD were performed in dim red light (<<1 lx). A measurement session (from collection to subsequent return to the cage) lasted 6.6±0.3 h, after which we removed (tc1) or cut the
thermocouple wires at the skin surface (tc2–5), weighed the bird,
and returned it to its cage. The exposure period should be adequate
to detect any local heterothermy, as RMR, Tc and Tt typically
stabilized within 30 min of putting the bird into the metabolic
chamber and remained unaltered in a given Ta thereafter. By
comparison, the much larger homeotherm reindeer (Rangifer
Journal
of
Experimental
tarandus tarandus) responds with substantial local heterothermy (i.
e. leg skin temperature dropping below 10°C) within 1–3 h of being
subjected toTabelow their lower critical temperature (e.g. Folkow
and Mercer, 1986; Johnsen et al., 1985).
Measurement of RMR
In early winter, O2 consumption and CO2 production were
measured using a FoxBox (Sable Systems, Las Vegas, NV, USA), and flow rate was recorded with a SRT-2 volumetric flow meter (Flow Tech, Phoenix, AZ, USA). During late winter and summer,
O2 consumption was measured using a S3-A oxygen analyser
(Applied Electrochemistry, Pittsburgh, PA, USA), and CO2
production was recorded using a ML206 gas analyser (AD Instruments, Sydney, Australia). Flow rate was registered with a FMA-A2317 mass flow meter (Omega Engineering). Humidity and temperature of the sample gas were measured using a HMI32 thermometer and hygrometer (Vaisala, Vanda, Finland) throughout the experiment.
We calibrated the O2analysers against ambient air (20.95% O2)
and 100% N2(i.e. 0% O2), and also using the N2-dilution technique
(Fedak et al., 1981), the last forming the basis for correcting for
between-instrument variation in the accuracy of O2measurement, as
outlined below. The CO2analysers were calibrated against 100% N2
and 1% CO2. We calibrated all analysers daily, and used
day-specific calibration values to convert the input signal to gas concentrations. The SRT-2 flow meter was calibrated against a DTM-325 gas meter (Elster American Meter, Nebraska City, NE, USA), whereas the FMA-A2317 mass flow meter was factory calibrated immediately prior to use. All data were recorded and digitized from raw signals using a ML796 PowerLab/16SP A-D converter (AD Instruments).
Adjustment for between-instrument variation in O2measurement
We used the N2dilution technique (Fedak et al., 1981), with a N2
flow of 125–900 ml min−1(n=61 dilutions over the course of the
study), as measured with a FMA5512A mass flow meter (Omega Engineering), to control for between-instrument variation in the
accuracy of O2 measurement, and derived adjusted RMR values
according to:
RMRadj¼
RMR
Sn i¼1
DO2;obs;i
DO2;pred;i
=N
; ð1Þ
where RMRadjis RMR adjusted for between-instrument variation,
ΔO2 is the measured (ΔO2,obs) or predicted (ΔO2,pred) change in
fractional O2during N2 dilution, andN is the total number of N2
dilutions during each experimental period.
Data handling and statistical analyses
We calculated standard temperature and pressure-corrected flow
rates (fSTP) from the SRT-2 flow meter according to Lighton (2008):
fSTP ¼ fa
Tgas 760
273:15 BP; ð2Þ
where fa is the uncorrected flow rate (ml min−1), Tgas is gas
temperature in K and BP is barometric pressure in mmHg (Tromsø data provided by the Norwegian Meteorological Institute). We then standard temperature and pressure dry (STPD)-corrected all flow
rates by subtracting fH2O from fSTP, where fH2O was calculated
following Eqn 3 (Vaisala, 2013):
fH2O¼fSTP
ðRH=100Þ 4:58810ð7:59TgasÞ=ð240:73þTgasÞ
BP ; ð3Þ
where RH is relative humidity of the sample gas and Tgasis gas
temperature in °C. We then calculated the rate of O2consumption and
CO2production following Eqns 4 and 5, respectively (Lighton, 2008):
_
VO2¼fSTPD
ðFIO2FEO2Þ FIO2 ðFECO2 FICO2Þ
1FIO2
; ð4Þ
_
VCO2¼fSTPD
ðFECO2FICO2ÞþFICO2ðFIO2FEO2Þ
1þFICO2
; ð5Þ
whereV̇O2andV̇CO2are O2consumption and CO2production rate in
ml min−1, F
IO2 and FEO2 are the fractional O2 concentration in
influent and effluent air, andFECO2andFICO2are the fractional CO2
concentration in effluent and influent air, respectively. O2
consumption was converted to energy consumption (W) assuming
an oxyjoule equivalence of 20 J ml−1O
2(Kleiber, 1961).
We only used data from periods when the birds were at full rest and had completed their thermal equilibration periods. If a bird did
not meet the‘rest’requirements, we used resting data collected at the
relevantTa, but outside the dedicated 20 min measurement period.
Such data were used in 12 (out of 95) cases. We also dismissed
data from thermocouples that fell out (tc1) or off (tc2–5), or broke
(tc1–5) (forTc: 2;Tback: 0;Tbreast: 5;Thead: 14;Ttarsus: 8; out of 95
recording periods). Final sample sizes for each parameter, season,Ta
and age category are reported in Table S1.
Whole-animal thermal conductance (Aschoff, 1981) was
calculated in W kg−1°C−1as:
C ¼ RMR
mb =ð
Tc TaÞ; ð6Þ
whereCis thermal conductance,mbis body mass andTais ambient
temperature inside the metabolic chamber.
All statistical analyses were performed in R 3.3.1
(http://www.R-project.org/). We analysed all birdTc,Tt, mass-specific RMR (i.e.
RMR/body mass), total RMR and C with linear mixed effects
models (lme4 package; Bates et al., 2015). All original models
included experimental period (early winter, late winter, summer),Ta
(0,−10,−30°C), bird age [first winter (1CY), or older (2CY+)] and
measurement order (i.e. increasing or decreasingTa; see above) as
main effects. The original model for total RMR also included body mass as a covariate. We did not account for body mass in any other models, because it co-varied with bird age in two out of three seasons (Fig. 1) but varied relatively little within age classes. Age and body mass, therefore, conveyed largely the same statistical information, so adding the latter to our models was not warranted.
We included the three-way interactionTa×season×age (and all of its
lower level interactions), to account for any potential age-related differences in the seasonal effects of cold exposure on thermoregulation. In addition, original models included the
two-way interaction Ta×measurement order, to account for possible
variation introduced by the order of temperature exposures. To account for repeated sampling, we fitted four alternative random structures to the original models: (1) a random intercept for bird id;
(2) a random intercept (bird id) and slope (Ta); (3) a random
intercept for bird id and a random intercept for family (to account for any genetic effects pertaining to the relatedness of some of the
birds); or (4) a random intercept/slope (bird id andTa, respectively)
and a random intercept for family. We then selected the most
appropriate random structure based on the Akaike information
Journal
of
Experimental
criterion (AIC) (Zuur et al., 2009). The simplest random structure, i.e. a random intercept for bird id, was preferred in all cases (mean
ΔAICalternative-best fit: 7.6). We derived final models by sequentially
excluding the model term with the lowestP-value and comparing AIC
values for the full and reduced models (fitted with maximum likelihood) starting with the highest order interactions and retaining
parameters for which ΔAIC >5 (package LMERConvenience
Functions; https://CRAN.R-project.org/package=LMERConvenience Functions). We then re-fitted the final model using restricted maximum likelihood (Zuur et al., 2009), and calculated degrees of freedom for this model using the Satterthwaite approximation
(lmerTest package; https://CRAN.R-project.org/package=lmer
Test). Multiple comparisons for final models were performed on
predicted marginal means within seasons betweenTaor age groups,
or within seasons within age groups between Ta, as applicable
(lsmeans package; Lenth, 2016). We adjustedP-values for multiple
comparisons using the Holm–Bonferroni correction (Holm, 1979).
Data in the tables and text are predicted marginal means±s.e., and all significances are two-tailed.
RESULTS
Deep and peripheral tissue temperature
AverageTc(41.71±0.14°C) across seasons andTawas consistently
higher than peripheral Tt (Tback: 37.44±0.27°C; Tbreast: 37.26±
0.24°C; Thead: 31.04±0.80°C; Ttarsus: 28.66±1.85°C) (Fig. 2).
Accordingly, on average, birds maintainedTc4.65±0.22°C above
body trunk skin (i.e.TbackandTbreast), 10.78±0.57°C aboveThead,
and 13.30±1.32°C aboveTtarsus(Fig. 2).
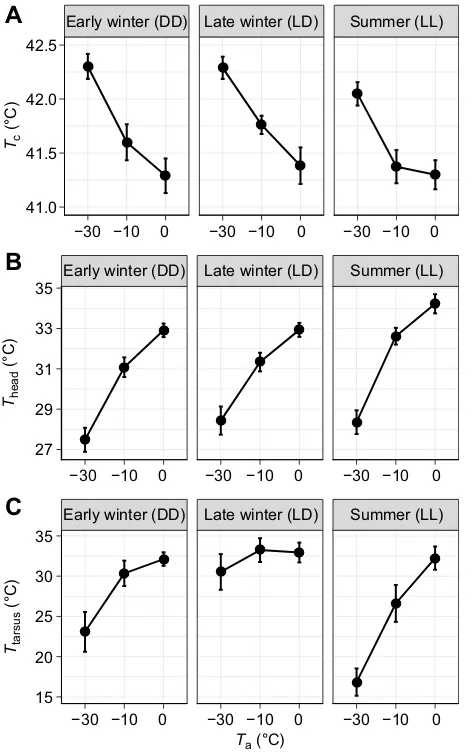
Tc was about 0.2°C lower in summer than in winter, and
consistently increased with decreasingTa(Table 1; Fig. 3A). On
average,Tcwas 0.26°C higher at−10°C than at 0°C, and 0.64°C
higher at−30°C than at−10°C (Fig. 3A). The effect size varied with
measurement order (measurement order×Ta:P<0.003; Table 1).Tc
did not change between 0°C (41.41±0.12°C) and −10°C (41.68
±0.12°C) when birds were subjected to the decreasingTaprotocol,
and was 0.55°C (42.10±0.12°C) higher at−30°C than at the other
two temperatures (Table 1). In contrast, Tc was significantly
different between allTawhen birds were exposed to the increasing
Taprotocol (−30°C: 42.40±0.16°C;−10°C: 41.40±0.16°C; 0°C:
41.09±0.17°C) (Table 1).
When averaged over seasons,Tbackdid not differ between 0°C
(37.83±0.15°C) and−10°C (37.64±0.26°C), but was 1.12°C lower
at−30°C (36.62±0.26°C) relative to the otherTa(Table 1).Tback
also varied between seasons depending on bird age (season×age:
P=0.007) (Table 1). In 1CY birds, meanTbackwas fairly similar in
early winter (37.92±0.32°C) and summer (37.80±0.36°C), but ca. 1.6°C lower in late winter (36.27±0.36°C). In contrast, 2CY+ birds
maintained a relatively stable averageTbackin early and late winter
(37.17±0.38°C and 36.96±0.39°C, respectively), but increased
Tbackby 1°C in summer (Table 1).
Tbreastwas stable across seasons and age categories, but decreased
with decreasing Ta, such that Tbreastat 0°C (37.58±0.45°C) and
−10°C (37.33±0.44°C) was 1.08°C higher thanTbreastat −30°C
(36.38±0.44°C) (Table 1).
Theadwas markedly affected byTa, decreasing by 1.79°C between
0°C (33.43±0.31°C) and−10°C (31.64±0.32°C), and by a further
3.63°C during the transition to −30°C (28.01±0.32°C) (Fig. 3B).
Theadalso varied with season, being 0.50°C higher in late compared
with early winter, and 0.66°C higher in summer than in late winter (Table 1; Fig. 3B). The seasonal effect differed between
age categories: 1CY maintained a significantly lower averageTheadin
early winter (1CY: 29.61±0.44°C; 2CY+: 31.42±0.42°C), such that
the seasonal increase inTheadwas larger in this group (Table 1).
Ttarsusdecreased withTa, from 32.21±1.39°C at 0°C to 29.82±
1.38°C and 23.27±1.37°C at −10 and−30°C, respectively. This
effect differed between seasons (i.e. season×Ta:P=0.001) (Table 1;
Fig. 3C). Ttarsusdid not differ between 0°C (32.12±1.71°C) and
−10°C (30.35±1.71°C) in early winter, but was significantly lower
at −30°C (23.09±1.71°C). In contrast, there was no significant
effect ofTain late winter (Table 1; Fig. 3C).Ttarsusin summer was
relatively similar to early and late winter values in thermoneutrality (32.04±1.92°C), but subsequently dropped by 5.63 and 15.31°C
when birds were measured at−10°C (26.41±1.92°C) and −30°C
(16.73±1.84°C), respectively (Fig. 3C).
Mass-specific RMR, total RMR and thermal conductance
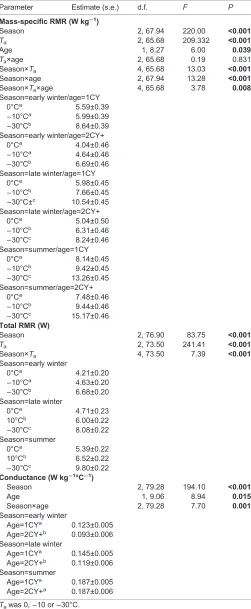
Mass-specific RMR (across age categories) atTa0°C (corresponding
to expected thermoneutrality, according to Mortensen and Blix,
1986) increased 13% between early (4.94±0.31 W kg−1) and late
(5.59±0.30 W kg−1) winter, and 40% between late winter and
summer (7.81±0.25 W kg−1). Mass-specific RMR was higher in
1CY than in 2CY+ birds at allTain early and late winter, but not in
summer (Fig. 4). Moreover, the proportional response to a drop inTa,
from 0°C to−30°C, differed between the age groups in a
season-dependent manner (season×Ta×age: P=0.008) (Table 2). The
proportional response in 1CY birds was stronger in late winter
(+4.56 W kg−1/+77%) than at other times of the year (early winter:
+3.05 W kg−1/+55%; summer: +5.12 W kg−1/+63%). By contrast,
the proportional response in 2CY+ birds was relatively similar in
early and late winter (early winter: +2.65 W kg−1/+66%; late winter:
+3.20 W kg−1/+63%), but considerably stronger in summer
(+7.69 W kg−1/+103%) (Fig. 4). Total RMR at expected
thermoneutrality (i.e. at 0°C) differed between seasons, being relatively similar in early (4.21±0.20 W) and late (4.71±0.23 W) winter, but some 21% higher in summer (5.39±0.22 W). The total
RMR response to a drop inTa, from 0 to−30°C, largely followed
patterns in mass-specific RMR (although there was no age effect). Accordingly, total RMR in early winter was 2.47 W (59%) higher at
−30°C than at 0°C, a difference that had increased to 3.37 W (72%)
and 4.41 W (82%) by late winter and summer, respectively (Table 2). Body mass changes throughout the study period were too small to
affect total RMR (P>0.3).
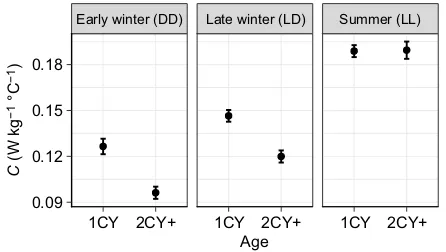
Mass-specific thermal conductance, C, across ages reached its
minimum average value in early winter (0.110±0.004 W kg−1°C−1)
−30 −10 0 −30 −10 0 15
20 25 30 35 40
Ta (°C)
T
issue temperature (°C)
Tc
Tback
Tbreast
Thead
Ttarsus Early winter (DD) Late winter (LD) Summer (LL)
[image:5.612.55.297.535.662.2]−30 −10 0
Fig. 2. Overview of variation in tissue temperature (Tt) in captive Svalbard ptarmigan at different ambient temperatures (Ta) and seasons.Data are
mean±s.e.m. core (Tc) and cutaneousTtmeasured at the back (Tback), breast (Tbreast), head (Thead) and tibiotarsus (Ttarsus). DD, continuous darkness; LD, 15 h light:9 h dark; LL, continuous light. Data were averaged over age categories and measurement order. Sample sizes for each tissue, at eachTa
and season, are reported in Table S1.
Journal
of
Experimental
and subsequently increased by 20% (+0.022 W kg−1°C−1) during
late winter measurements (Fig. 5). Summer values (0.187±
0.003 W kg−1 °C−1) were 70% (+0.077 W kg−1 °C−1) and 41%
(+0.055 W kg−1 °C−1) higher than those in early and late winter,
respectively. C developed differently over seasons for 1CY and
2CY+ birds (season×age: P<0.001; Table 2). Specifically, C was
[image:6.612.315.564.70.164.2]significantly higher in 1CY birds than in 2CY+ birds during both
Table 1. Test statistics, degrees of freedom (Satterthwaite
approximation) andP-values for final models of core (Tc) and peripheral cutaneous tissue (Tt) temperature measured in Svalbard ptarmigan at each of three ambient temperatures (Ta) during early winter, late winter and summer
Parameter Estimate (±s.e.) d.f. F P
Tc(°C)
Season 2, 75.53 3.29 0.043
Early wintera 41.71±0.10
Late wintera 41.78±0.10
Summera,b 41.54±0.10
Measurement order 1, 7.31 0.33 0.583
Ta 2, 72.77 54.35 <0.001
Measurement order×Ta 2, 72.78 6.32 0.003
Measurement order=0 to−30°C
0°Ca 41.41±0.12
−10°Ca 41.68±0.12
−30°Cb 42.10±0.12
Measurement order=−30 to 0°C
0°Ca 41.09±0.17
−10°Ca 41.40±0.16
−30°Cb 42.40±0.16
Tback(°C)
Season 2, 79.07 17.05 <0.001
Ta 2, 77.12 17.01 <0.001
0°Ca 37.83±0.26
−10°Ca 37.64±0.26
−30°Cb 36.62±0.26)
Age 1, 9.70 0.03 0.876
Season×age 2, 79.07 5.29 0.007
Season=early winter
Age=1CYa 37.92±0.32)
Age=2CY+a 37.17±0.38
Season=late winter
Age=1CYa 36.27±0.36
Age=2CY+a 36.96±0.39
Season=summer
Age=1CYa 37.80±0.36
Age=2CY+a 38.07±0.38
Tbreast(°C)
Ta 2, 75.14 4.98 0.009
0°Ca 37.58±0.45
−10°Ca 37.33±0.44
−30°Cb 36.38±0.44
Thead(°C)
Ta 2, 65.43 150.91 <0.001
0°Ca 33.43±0.25
−10°Cb 31.94±0.25
−30°Cc 28.70±0.26
Age 1, 9.33 1.85 0.206
Season 2, 67.23 7.75 0.001
Season×age 2, 67.23 6.71 0.002
Season=early winter
Age=1CYa 29.61±0.44
Age=2CY+b 31.42±0.42
Season=late winter
Age=1CYa 30.46±0.48
Age=2CY+a 31.22±0.47
Season=summer
Age=1CYa 31.93±0.46
Age=2CY+a 31.48±0.44
Ttarsus(°C)
Ta 2, 67.18 32.93 <0.001
Season 2, 68.82 15.26 <0.001
Season×Ta 2, 67.18 4.97 0.001
Season=early winter
0°Ca 32.12±1.71
−10°Ca 30.35±1.71
−30°Cb 23.09±1.71
[image:6.612.52.332.107.728.2]Continued
Table 1. Continued
Parameter Estimate (±s.e.) d.f. F P
Season=late winter
0°Ca 32.46±1.84
−10°Ca 32.70±1.77
−30°Ca 29.98±1.77
Season=summer
0°Ca 32.04±1.84
−10°Cb 26.41±1.92
−30°Cc 16.73±1.92
Peripheral tissue temperature was measured on skin at the back (Tback), breast (Tbreast), head (Thead) and tibiotarsus (Ttarsus).Tawas 0,−10 or−30°C. Different superscript letters denote statistically significant (P≤0.05) pairwise differences within each respective contrast.
● ●
● ●
● ●
● ●
● ●
● ●
● ●
●
● ●●
A
Early winter (DD) Late winter (LD) Summer (LL)−30 −10 0 −30 −10 0 −30 −10 0 41.0
41.5 42.0 42.5
Tc
(°C)
Thead
(°C)
Ttarsus
(°C)
Ta (°C)
● ●
● ●
● ●
● ●
● ●
● ●
● ●
● ●
● ●
B
Early winter (DD) Late winter (LD) Summer (LL)−30 −10 0 −30 −10 0 −30 −10 0 27
29 31 33 35
● ●
●
● ●● ●●
●
● ●●
● ●
● ●
● ●
C
Early winter (DD) Late winter (LD) Summer (LL)−30 −10 0 −30 −10 0 −30 −10 0 15
20 25 30 35
[image:6.612.323.559.307.683.2]Fig. 3.Tcand cutaneousTt(head and tibiotarsus) in relation toTain captive Svalbard ptarmigan in each of the three seasons.(A)Tc, (B)Thead and (C)Ttarsus. Data are means±s.e.m. Sample sizes for eachTt, at eachTa and during each season, are given in Table S1. Statistics are reported in
Table 1.
Journal
of
Experimental
early (+32%; 1CY: 0.123±0.005 W kg−1 °C−1; 2CY+: 0.093±
0.004 W kg−1 °C−1) and late (+22%; 1CY: 0.145±0.004 W
kg−1°C−1; 2CY+: 0.119±0.004 W kg−1°C−1) winter, but the two
age categories attained identicalCin summer (Table 2, Fig. 5).
DISCUSSION
We found no evidence for substantial local heterothermy in the Svalbard ptarmigan. Even during exposure to severe cold, we observed only a relatively modest drop in leg skin temperature (i.e.
Ttarsus; Fig. 3C), which was probably not substantial enough to
significantly reduce the birds’heat loss rate. This implies that
counter-current vascular arrangements are not prominent in the legs of Svalbard ptarmigan. This corroborates studies of the vascular anatomy of the rock ptarmigan leg (Midtgård, 1981). It follows that
the strongerTtarsusresponse in summer than in winter birds probably
reflected a combination of the inferior insulation, the thermally unfavourable shape and the low heat production rate of this structure.
Yet, it is possible that our measurements ofTtarsusdid not capture the
full biophysical relevance of counter-current heat exchange as the foot/substrate interface (i.e. the foot pad) could be a key avenue for leg heat loss. In line with this, foot pad temperatures in willow ptarmigan (L. lagopus) roosting at −10°C were 6–8°C (Mercer and Simon, 1987), which is well below the tibiotarsal temperatures recorded by us. Even so, the appendage heterothermic response to cold is much smaller in ptarmigan than in other sympatrically breeding species
with unfeathered legs, such as glaucous gulls (Larus hyperboreus)
and brent geese (Branta bernicla) (Irving and Krog, 1955). It is, thus,
possible that the ca. tenfold increase in feet plumage mass and fourfold increase in feet plumage thickness (and resultant complete covering of the foot pads) in winter-acclimated Svalbard ptarmigan (A.N., B. Iudik, L.P.F. and P. L. Pap, unpublished data), reduces the need for specialized vascular adaptations in this structure.
In comparison, body trunk skin temperature was remarkably
stable, varying by less than 1°C whenTadecreased to−30°C. As a
result, the skin-to-environment temperature gradient was
maintained near 70°C at this Ta, irrespective of the time of the
year or plumage (Fig. 2). This was possible because the seasonal
increase in thermal conductance (C) was fully compensated by
increased thermogenesis, such that mass-specific RMR at−30°C
rose (relative to RMR at 0°C) in roughly 10% increments between study periods, from +60% in early winter, via +70% in late winter, to +80% in summer (Table 2).
Tcat thermoneutrality was largely stable over the year, and was
within the range ofTcfound in other Galliformes (i.e. 38.2–42.5°C;
[image:7.612.60.289.57.182.2]Prinzinger et al., 1991). IncreasedTcwith decreasingTa(Fig. 3A)
Table 2. Test statistics, degrees of freedom (Satterthwaite
approximation) andP-values for final models of mass-specific resting metabolic rate RMR and thermal conductance, measured at each of threeTain Svalbard ptarmigan during early winter, late winter and summer
Parameter Estimate (s.e.) d.f. F P
Mass-specific RMR (W kg−1)
Season 2, 67.94 220.00 <0.001
Ta 2, 65.68 209.332 <0.001
Age 1, 8.27 6.00 0.039
Ta×age 2, 65.68 0.19 0.831
Season×Ta 4, 65.68 13.03 <0.001
Season×age 2, 67.94 13.28 <0.001
Season×Ta×age 4, 65.68 3.78 0.008
Season=early winter/age=1CY
0°Ca 5.59±0.39
−10°Ca 5.99±0.39
−30°Cb 8.64±0.39
Season=early winter/age=2CY+
0°Ca 4.04±0.46
−10°Ca 4.64±0.46
−30°Cb 6.69±0.46
Season=late winter/age=1CY
0°Ca 5.98±0.45
−10°Cb 7.66±0.45
−30°C±c 10.54±0.45
Season=late winter/age=2CY+
0°Ca 5.04±0.50
−10°Cb 6.31±0.46
−30°Cc 8.24±0.46
Season=summer/age=1CY
0°Ca 8.14±0.45
−10°Cb 9.42±0.45
−30°Cc 13.26±0.45
Season=summer/age=2CY+
0°Ca 7.48±0.46
−10°Cb 9.44±0.46
−30°Cc 15.17±0.46
Total RMR (W)
Season 2, 76.90 83.75 <0.001
Ta 2, 73.50 241.41 <0.001
Season×Ta 4, 73.50 7.39 <0.001
Season=early winter
0°Ca 4.21±0.20
−10°Ca 4.63±0.20
−30°Cb 6.68±0.20
Season=late winter
0°Ca 4.71±0.23
10°Cb 6.00±0.22
−30°Cc 8.08±0.22
Season=summer
0°Ca 5.39±0.22
10°Cb 6.52±0.22
−30°Cc 9.80±0.22
Conductance (W kg−1°C−1)
Season 2, 79.28 194.10 <0.001
Age 1, 9.06 8.94 0.015
Season×age 2, 79.28 7.70 0.001
Season=early winter
Age=1CYa 0.123±0.005
Age=2CY+b 0.093±0.006
Season=late winter
Age=1CYa 0.145±0.005
Age=2CY+b 0.119±0.006
Season=summer
Age=1CYa 0.187±0.005
Age=2CY+a 0.187±0.006
Tawas 0,−10 or−30°C.
Different superscript letters denote statistically significant (P≤0.05) pairwise differences within each respective contrast.
●
● ●
●
● ●
●
● ● Early winter (DD Late winter (LD) Summer (LL)
−30 −10 0 −30 −10 0 −30 −10 0 4
8 12 16
Ta (°C) Mass-specific RMR (W kg
−1
)
[image:7.612.313.564.110.719.2]● 1CY 2CY+
Fig. 4. Mass-specific resting metabolic rate (RMR) at differentTain 1CY and 2CY+ captive Svalbard ptarmigan in each of the three seasons.Data are means±s.e.m. Sample sizes and statistics are reported in Table S1 and Table 2, respectively.
Journal
of
Experimental
has previously been observed in other medium-to-large (>500 g) birds (e.g. Schwan and Williams, 1978; Bech, 1980; Rintamäki et al., 1983). This is not normally seen in smaller (<400 g) birds (Saarela and Heldmaier, 1987; Saarela et al., 1995; Saarela and Hohtola, 2003), presumably because their more unfavourable surface area to volume ratio renders body insulation insufficient to
allow theirTcto rise despite increased heat production. We believe
that increased thermogenesis during cold exposure was proximately driven by brain (hypothalamic) temperature sensors that were cooled below the set point (Mercer and Simon, 1987), as judged
from the significant reduction inTheadduring cold exposure in our
birds (Fig. 3B). Aside from preserving thermal balance, increased thermogenesis in the cold is probably also important to reducing predation risk, because temperature reduction in the head could come at the cost of reduced vigilance and escape speed (Rashotte
et al., 1998; Carr and Lima, 2013). In line with this, minimumThead
was largely stable between seasons (Fig. 3B), even in summer when the head plumage was only one-third the mass and half the thickness of winter values (A.N. et al., unpublished data).
Specific RMR at 0°C, assumed to represent thermoneutrality (Mortensen and Blix, 1986), was consistently higher than the
predicted phylogeny-corrected specific basal metabolic rate (sensu
Reynolds and Lee, 1996) (early winter: +19%; late winter: +34%; summer: +74%). Previous measurements of specific thermoneutral RMR in the Svalbard ptarmigan fall closer to predicted values
(range: −7% to +20%; Mortensen and Blix, 1986). These
differences might be explained if our birds were, in fact, below their lower critical temperature at 0°C. The 40% increase in specific RMR at 0°C from late winter to summer (Fig. 4) could, thus, be a thermogenic response as a result of the inferior insulation of the summer plumage (A.N. et al., unpublished data), perhaps in combination with a general upregulation of metabolic activity due to increased food processing (Fig. 1D), and preparation for reproduction and for the approaching onset of winter moult.
MinimumC was 0.093±0.004 W kg−1°C−1 in 2CY+ birds in
early winter (Fig. 5), which is comparable to the 0.091±
0.003 W kg−1 °C−1 recorded for Svalbard ptarmigan at the same
time of the year by Mortensen and Blix (1986).C subsequently
increased 20% from early to late winter, which is lower than the 39% increase estimated by Mortensen and Blix (1986). Different seasonal responses in these studies might be explained by the lower reduction of subcutaneous fat reserves in our study (5 g; 0.6% of total body mass) compared with that reported by Mortensen and Blix (1986) (80 g; 11% of total body mass). Continued depletion of fat reserves (Fig. 1C) might also explain
why we observed a subsequent 41% increase inC between late
winter and summer (Fig. 5), whereas Mortensen and Blix (1986) observed no significant difference between fat-free birds in winter
and summer plumages (0.127±0.004 W kg−1 °C−1 and 0.120±
0.007 W kg−1 °C−1 for late winter and summer, respectively).
Nevertheless, as body coat mass and plumage thickness in summer-acclimated Svalbard ptarmigan are considerably lower than in winter (A.N. et al., unpublished data), inferior plumage
insulation most probably also contributed to increased C in
summer birds.
First-winter (1CY) birds had higherCthan 2CY+ birds in both
early and late winter (Fig. 5). AsCis directly proportional to RMR
(Eqn 6), this difference is probably related to the higher
mass-specific RMR in 1CY winter birds (at allTa; Fig. 4). The higher
RMR of 1CY in part reflects that they were still in growth in winter, as judged from their lower body masses compared with those of 2CY+ birds (Fig. 1B), as it is well established that immature, growing, homeotherms generally maintain higher specific metabolic rates compared with mature conspecifics (Kleiber, 1961). The
difference inCbetween age classes could also partly be explained
by the considerably higher levels of subcutaneous fat in 2CY+ birds (Fig. 1C; see also Mortensen et al., 1983), which fits the observation
of converging C between age groups coincident with seasonally
converging fat levels (Figs 1C, 5). Yet, the age-wise difference inC
increased only 10% between early and late winter, at the same time as differences in fat reserves between the age classes decreased by 59% (Fig. 1C). This indicates that there are inherent differences in insulation between 1CY and 2CY+ birds. We propose that this can be explained by differences in plumage properties, because 1CY birds must first approach adult size before commencing winter preparations, which is supported by the later timing of prime body condition in these birds (Fig. 1B,C). This may leave less time and resources for moulting into a high-quality winter coat (cf. Broggi et al., 2011), which may constrain plumage development (Lindström et al., 1993) and increase metabolic maintenance costs in winter (Nilsson and Svensson, 1996). In line with this, we
observed no variation in C between age categories in summer
(Fig. 5), when there were no differential time constraints on moult and when both age categories appeared to be physically mature.
Conclusions
We have shown that the Svalbard ptarmigan does not use extensive
local heterothermy to limit the energy requirements for
thermoregulation. Instead, this bird seems to rely on effective thermogenesis and excellent body insulation for maintaining a close
to invariable body temperature over a wide range of Ta, both
centrally (Tc) and in peripheral tissues (Tt). This thermoregulatory
strategy more closely resembles that of lower latitude relatives (e.g. Rintamäki et al., 1983; Marjakangas et al., 1984) than that of high-latitude mammals and (some) seabirds. Nevertheless, the Svalbard ptarmigan, much like other polar animals, is extremely well adapted
to‘life on the edge’(Blix, 2005; 2016).
Acknowledgements
Renate Thorvaldsen, Hans Lian and Justine Vandendorpe provided instrumental technical help over the course of the study. Hans Arne Solvang excellently assisted with bird care and maintenance.
Competing interests
The authors declare no competing or financial interests.
Author contributions
Conceptualization: A.N., L.P.F.; Methodology: A.N., L.P.F.; Software: A.N., L.P.F.; Validation: A.N.; Formal analysis: A.N., L.P.F.; Investigation: A.N., L.P.F.; Data Early winter (DD) Late winter (LD) Summer (LL)
1CY 2CY+ 1CY 2CY+ 0.09
0.12 0.15 0.18
Age
C
(W kg
−1
°C
−1
)
[image:8.612.64.287.57.183.2]1CY 2CY+
Fig. 5. Mass-specific thermal conductance (C) in 1CY and 2CY+ captive Svalbard ptarmigan in each of the three seasons.Data are means±s.e.m. Sample sizes for each age group and season are given in Table S1. Statistics are reported in Table 2.
Journal
of
Experimental
curation: A.N.; Writing - original draft: A.N.; Writing - review & editing: A.N., L.P.F.; Visualization: A.N., L.P.F.; Project administration: A.N.; Funding acquisition: A.N.
Funding
A.N. was supported by Vetenskapsrådet (grant no. 637-2013-7442), the Carl Tryggers Stiftelse för Vetenskaplig Forskning (grant no. 14:347), and the Längmanska Kulturfonden.
Data availability
Data are deposited in figshare (https://doi.org/10.6084/m9.figshare.5537281.v1).
Supplementary information
Supplementary information available online at
http://jeb.biologists.org/lookup/doi/10.1242/jeb.171124.supplemental
References
Ancel, A., Visser, H., Handrich, Y., Masman, D. and Le Maho, Y.(1997). Energy saving in huddling penguins.Nature385, 304-305.
Aschoff, J.(1981). Thermal conductance in mammals and birds: Its dependence on body size and circadian phase.Comp. Biochem. Physiol. A69, 611-619.
Aulie, A.(1976). The pectoral muscles and the development of thermoregulation in chicks of willow ptarmigan (Lagopus lagopus).Comp. Biochem. Physiol. A53, 343-346.
Bates, D., Mäechler, M., Bolker, B. and Walker, S.(2015). Fitting linear mixed-effects models using lme4.J. Stat. Soft.67, 1-48.
Bech, C.(1980). Body temperature, metabolic rate, and insulation in winter and summer acclimatized mute swans (Cygnus olor).J. Comp. Physiol.136, 61-66.
Bevan, R. M., Boyd, I. L., Butler, P. J., Reid, K., Woakes, A. J. and Croxall, J. P.
(1997). Heart rates and abdominal temperatures of free-ranging South Georgian shags,Phalacrocorax georgianus.J. Exp. Biol.200, 661-675.
Blix, A. S.(2005).Arctic Animals and their Adaptations to Life on the Edge. Trondheim: Tapir Academic Press.
Blix, A. S.(2016). Adaptations to polar life in mammals and birds.J. Exp. Biol.219, 1093-1105.
Brodin, A., Nilsson, J.-Å. and Nord, A.(2017). Adaptive temperature regulation in the little bird in winter - predictions from a stochastic dynamic programming model.
Oecologia185, 43-54.
Broggi, J., Gamero, A., Hohtola, E., Orell, M. and Nilsson, J.-Å. (2011). Interpopulation variation in contour feather structure is environmentally determined in great tits.PLoS ONE6, e24942.
Carr, J. M. and Lima, S. L.(2013). Nocturnal hypothermia impairs flight ability in birds: a cost of being cool.Proc. R. Soc. Lond. B.280, 20131846.
Coulianos, C.-C. and Johnels, A. G.(1962). Note on the subnivean environment of small mammals.Ark. Zool.2, 363-370.
Duchesne, D., Gauthier, G. and Berteaux, D. (2011). Habitat selection, reproduction and predation of wintering lemmings in the Arctic.Oecologia167, 967-980.
Ekimova, I. V.(2005). Thermoregulation in the pigeonColumbia liviaduring the stress produced by food deprivation.J. Evol. Biochem. Physiol.41, 78-86.
Enstipp, M. R., Grémillet, D. and Lorentsen, S.-H.(2005). Energetic costs of diving and thermal status in European shags (Phalacrocorax aristotelis).J. Exp. Biol.208, 3451-3461.
Fedak, M. A., Rome, L. and Seeherman, H. J.(1981). One-step N2-dilution
technique for calibrating open-circuit VO2measuring systems.J. Appl. Physiol.
51, 772-776.
Folkow, L. P. and Mercer, J. B.(1986). Partition of heat loss in resting and exercising winter- and summer-insulated reindeer.Am. J. Physiol.251, R32-R40.
Geiser, F.(2004). Metabolic rate and body temperature reduction during hibernation and daily torpor.Ann. Rev. Physiol.66, 239-274.
Gilbert, C., McCafferty, D., le Maho, Y., Martrette, J. M., Giroud, S., Blanc, S. and Ancel, A.(2010). One for all and all for one: the energetic benefits of huddling in endotherms.Biol. Rev.85, 545-569.
Handrich, Y., Bevan, R. M., Charrassin, J.-B., Butler, P. J., Ptz, K., Woakes, A. J., Lage, J. and Maho, Y. L.(1997). Hypothermia in foraging king penguins.Nature
388, 64-67.
Harlow, H. J.(1981). Torpor and other physiological adaptations of the badger (Taxidea taxus). to cold environments.Physiol. Zool.54, 267-275.
Holm, S. (1979). A simple sequentially rejective multiple test procedure.
Scand. J. Stat.6, 65-70.
Irving, L. and Krog, J.(1954). Body temperatures of Arctic and subarctic birds and mammals.J. Appl. Physiol.6, 667-680.
Irving, L. and Krog, J.(1955). Temperature of skin in the Arctic as a regulator of heat.J. Appl. Physiol.7, 355-364.
Irving, L., West, G. C. and Peyton, L. J.(1967). Winter feeding program of Alaska willow ptarmigan shown by crop contents.Condor69, 69-77.
Jaeger, E. C.(1948). Does the poor-will hibernate?Condor50, 45-46.
Johnsen, H. K., Rognmo, A., Nilssen, K. J. and Blix, A. S.(1985). Seasonal changes in the relative importance of different avenues of heat loss in resting and running reindeer.Acta Physiol. Scand.123, 73-79.
Kleiber, M.(1961).The Fire of Life. New York: John Wiley & Sons.
Lenth, R. V.(2016). Least-squares means: the R package lsmeans.J. Stat. Soft.69, 1-33.
Lighton, J. R. B.(2008).Measuring metabolic rates - A manual for scientists. New York: Oxford University Press.
Lindgård, K. and Stokkan, K.-A.(1989). Daylength control of food intake and body weight in Svalbard ptarmiganLagopus mutus hyperboreus.Orn. Scand.20, 176-180.
Lindström, Å., Visser, G. H. and Daan, S.(1993). The energetic cost of feather synthesis is proportional to basal metabolic rate.Physiol. Zool.66, 490-510.
Marjakangas, A., Rintamäki, H. and Hissa, R.(1984). Thermal responses in the capercaillieTetrao urogallusand the black grouseLyrurus tetrixroosting in the snow.Physiol. Zool.57, 99-104.
Mercer, J. B. and Simon, E.(1987). Appropriate and inappropriate hypothalamic cold thermosensitivity in willow ptarmigan.Acta Physiol. Scand.131, 73-80.
Midtgård, U.(1981). TheRete tibiotarsaleand arteriovenous association in the hind limb of birds: a compartive morphological study on counter-current heat exchange systems.Acta Zool.62, 67-87.
Midtgård, U. (1989). A morphometric study of structures important for cold resistance in the Arctic Iceland gull compared to herring gulls.Comp. Biochem. Physiol. A93, 399-402.
Mortensen, A. and Blix, A. S.(1985). Seasonal changes in the effects of starvation on metabolic rate and regulation of body weight in Svalbard ptarmigan.Orn. Scand.16, 20-24.
Mortensen, A. and Blix, A. S.(1986). Seasonal changes in resting metabolic rate and mass-specific conductance in Svalbard ptarmigan, Norwegian rock ptarmigan and Norwegian willow ptarmigan.Orn. Scand.17, 8-13.
Mortensen, A., Unander, S., Kolstad, M. and Blix, A. S. (1983). Seasonal changes in body composition and crop content of Spitzbergen ptarmiganLagopus mutus hyperboreus.Orn. Scand.14, 144-148.
Newton, I. and Dale, L. C.(1996). Bird migration at different latitudes in eastern North America.Auk113, 626-635.
Nilssen, K. J., Sundsfjord, J. A. and Blix, A. S.(1984). Regulation of metabolic rate in Svalbard and Norwegian reindeer.Am. J. Physiol.247, R837-R841.
Nilsson, J.-Å. and Svensson, E.(1996). The cost of reproduction: a new link between current reproductive effort and future reproductive success.Proc. R. Soc. Lond. B263, 711-714.
Nord, A., Nilsson, J. F., Sandell, M. I. and Nilsson, J.-Å.(2009). Patterns and dynamics of rest-phase hypothermia in wild and captive blue tits during winter.
J. Comp. Physiol. B179, 737-745.
Nord, A., Nilsson, J. F. and Nilsson, J.-Å.(2011). Nocturnal body temperature in wintering blue tits is affected by roost-site temperature and body reserves.
Oecologia167, 21-25.
Ponganis, P. J., Van Dam, R. P., Levenson, D. H., Knower, T., Ponganis, K. V. and Marshall, G. (2003). Regional heterothermy and conservation of core temperature in emperor penguins diving under sea ice.Comp. Biochem. Physiol. A135, 477-487.
Prinzinger, R., Pressmar, A. and Schleucher, E.(1991). Body temperature in birds.Comp. Biochem. Physiol. A99, 499-506.
R Development Core Team(2016).R: A Language and Environment for Statistical Computing. Vienna, Austria: R Foundation for Statistical Computing.
Rashotte, M. E., Pastukhov, I. F., Poliakov, E. L. and Henderson, R. P.(1998). Vigilance states and body temperature during the circadian cycle in fed and fasted pigeons (Columba livia).Am. J. Physiol.44, R1690-R1702.
Reierth, E., Van’t Hof, T. J. and Stokkan, K. A.(1999). Seasonal and daily variations in plasma melatonin in the High-Arctic Svalbard ptarmigan (Lagopus mutus hyperboreus).J. Biol. Rhythms14, 314-319.
Reynolds, P. S. and Lee, R. M.(1996). Phylogenetic analysis of avian energetics: passerines and nonpasserines do not differ.Am. Nat.147, 735-759.
Rintamäki, H., Saarela, S., Marjakangas, A. and Hissa, R.(1983). Summer and winter temperature regulation in the black grouseLyrurus tetrix.Physiol. Zool.56, 152-159.
Ruf, T. and Geiser, F.(2015). Daily torpor and hibernation in birds and mammals.
Biol. Rev.90, 891-926.
Saarela, S. and Heldmaier, G.(1987). Effect of photoperiod and melatonin on cold resistance, thermoregulation and shivering/nonshivering thermogenesis in Japanese quail.J. Comp. Physiol. B157, 625-633.
Saarela, S. and Hohtola, E.(2003). Seasonal thermal acclimatization in sedentary and active pigeons.Israel J. Zool.49, 185-193.
Saarela, S., Klapper, B. and Heldmaier, G. (1995). Daily rhythm of oxygen consumption and thermoregulatory responses in some European winter- or summer-acclimatized finches at different ambient temperatures.J. Comp. Physiol. B165, 366-376.
Scholander, P. F.(1940). Experimental investigations on the respiratory function in diving mammals and birds.Hvalr. Skrift.22, 1-131.
Scholander, P. F., Hock, R., Walters, V., Johnson, F. and Irving, L.(1950). Heat regulation in some Arctic and tropical mammals and birds.Biol. Bull.99, 237-258.
Schwan, M. W. and Williams, D. D.(1978). Temperature regulation in the common raven of interior Alaska.Comp. Biochem. Physiol. A60, 31-36.
Journal
of
Experimental
Stokkan, K. A., Mortensen, A. and Blix, A. S.(1986). Food intake, feeding rhythm, and body mass regulation in Svalbard rock ptarmigan.Am. J. Physiol. 251, R264-R267.
Vaisala(2013).Humidity Conversion Formulas, p. 17. Helsinki, Finland: Vaisala Oyj.
Zuur, A. F., Ieno, E. N., Walker, N. J., Saveliev, A. A. and Smith, G. M.(2009).
Mixed Effects Models and Extensions in Ecology with R. New York: Springer.