Abstract — India is the second largest bicycle manufacturer
in the world, next only to China. The Chinese bicycle industry has already been successful in cornering almost 25 per cent share in fancy bicycle market in India which is a major cause of worry for the small-scale bicycle parts manufacturers in India. An attempt has been made to provide a comprehensive framework for the selection process of bicycle chain material in Indian manufacturing scenario for strategic success. Multiple attribute decision-making (MADM) methods have been applied to rank out the alternatives. Material AISI 1038 has been ranked first by using both the techniques.
Index Terms — Material selection, MADM, Preference
index value, TOPSIS
I. INTRODUCTION
aterials science and engineering plays a vital role in this modern age of science and technology. Various kinds of materials are used in different sectors such as housing, agriculture and transportation etc. to meet the society’s requirements. The rapid developments in the field of quantum theory of solids have opened vast opportunities for better understanding and utilization of various materials. The spectacular success in the field of space is primarily due to the rapid advances in high-temperature and high-strength materials. The subject of material science is very vast and unlimited. The improper selection of materials may result in loss of productivity and profitability and hence reputation of a manufacturing organization. The selection of materials should not be restricted to technical aspects only but focus should be made on environmental considerations also [1]. The complexity of materials selection makes multi-criteria analysis an invaluable tool in the engineering design process. Literature review reveals that various methodologies have already been used by the past researchers for proper material selection.
A compromise ranking and outranking methods was applied for the selection of material for design of a flywheel [2].
Manuscript received April 20, 2012
Harwinder Singh is with Mechanical Engineering Department, Guru Nanak Dev Engineering College, Ludhiana, Punjab, India. 141006. (phone: 91-9815188044; fax: 91-161-2502700; e-mail:
Raman Kumar is a Research Scholar at Guru Nanak Dev Engineering College, Ludhiana, Punjab, India.-141006. (e-mail: [email protected]).
A Knowledge Based System (KBS) was implemented in polymeric-based composite materials selection in an engineering design process [3]. A novel multiple attribute decision-making (MADM) method for material selection for a considered design problem was purposed. The proposed method suggested by the researchers has applied in the different field’s viz. material selection for a high-speed naval craft, material selection of a flywheel and materials for cryogenic storage tank [4]. A weighted average method using grey relational analysis was purposed to rank the materials with respect to certain quantitative attributes [5]. The Z-transformation in statistics was applied for normalization of material properties for materials selection in mechanical design [6]. Selection of material is based on so many factors such as process, material, function, and shape [7].
According to Bicycle Manufacturer Association, Indian bicycles are approximately 30 per cent costlier than the Chinese ones. The cheap Chinese bicycles are expected to gobble up the bicycle market of the country [8]. One prominent component of bicycle i.e. bicycle chain has been selected. In today’s highly competitive globalization era in cyclic industry, selection of most appropriate material play vital role in the design and development of products for industrial applications. A lot of research work has been done by many researchers for selection of material in different industrial applications as pointed above; limited work is reported on this issue.
The rest of the articles are organized as follows: - Section II describes the present work. Section III concludes the research and provides suggestions for further research.
II. PRESENT WORK
Bicycle is common man's transportation and it is a basic necessity for them. In today competitive globalization era in cyclic industries, selection of most appropriate material play vital role in the design and development of products for industrial applications. In this research work, objective integrated multiple attribute decision making method which was developed by [4] has been used to evaluate the best appropriate material for bicycle chain. The methodology consists of identification the objectives, then objective weight of parameters and finally to find out the performance index for selection of material. Then TOPSIS (Technique for order performance by similarity to ideal solution) method also has been implemented to compare the ranking of different materials used in
small medium
enterprises (SMEs). The flow chart of research methodology is shown in the figure 1.Selection of Material for Bicycle Chain in
Indian Scenario using MADM Approach
Harwinder Singh and Raman Kumar
Fig.1. Flow chart of present methodology
Step 1:- Identification of material
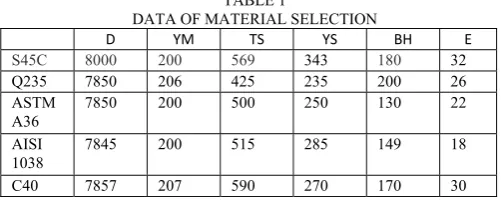
On the basis of carbon percentage, five materials such as S45C, Q235, ASTM A36, AISI 1038, C40 have been selected for the selection of material for bicycle chain. The six properties such as density (D) in kg/m3, Young’s
Modulus of elasticity (YM) in GPa, Tensile strength (TS) in MPa, Yield strength (YS) in MPa, Hardness (BH) in HB and Elongation in % (E) has been considered in the present research work. The secondary data of above mentioned parameters was collected from different sources, brainstorming etc. as shown in Table 1.
TABLE 1
DATA OF MATERIAL SELECTION
D YM TS YS BH E
S45C 8000 200 569 343 180 32
Q235 7850 206 425 235 200 26
ASTM A36
7850 200 500 250 130 22
AISI 1038
7845 200 515 285 149 18
C40 7857 207 590 270 170 30
Step 2:- Draw hierarchy diagram
Three level hierarchy diagram (shown in figure 2) has been used to evaluate the best material. Figure 2 show that level 1 refers to the goal, level 2 composes of the six objectives such as density (D) in kg/m3, Young’s Modulus of elasticity
[image:2.595.41.292.646.746.2](TM) in GPa, Tensile strength (TS) in MPa, Yield strength (YS) in MPa, Hardness (H) in HB and Elongation % (E) and level 3 refers to different alternatives such as S45C, Q235, AISI 1038, ASTM A36 and C40. The objective of this research work is to find out the best alternative on the basis of six important properties.
Fig.2. Three level hierarch diagram
Step 3:- Normalized Matrix
The next step is to divide each entry in column by the sum of entries in column to get values of relative weights. The values of relative weights of each alternative were calculated by below mentioned formula and values are shown in Table 2.
n rij = aij / ∑ aij
i=1 TABLE 2
NORMALIZED MATRIX FOR CALCULATING WEIGHTS
D YM TS YS BH E
S45C 0.203 0.197 0.219 0.248 0.217 0.25
Q235 0.199 0.203 0.164 0.17 0.241 0.203 ASTM
A36 0.199 0.197 0.192 0.181 0.157 0.172 AISI
1038 0.199 0.197 0.198 0.206 0.18 0.141 C40 0.199 0.204 0.227 0.195 0.205 0.234
Step 4:- Calculate the Statistical variance value
Statistical variance is a measure of the dispersion of a set of data points around their mean value. It is a mathematical expectation of the average squared deviations from the mean. Unlike range that only look at the extremes, the variance looks at all the data points and then determines their distribution. The statistical variance values are shown in Table 3. n
Vj= (1/n) ∑ {xij- (xij)mean}2
i=1
D YM TS YS BH E
Selection of material
C40
S45C Q235 ASTM
A36
AISI 1038 Select suitable materials on the basis of different
properties
Data Collection through interview and brain storming
Normalized matrix
Determine objective weights of importance of the attributes
Rank the materials selected
End
Calculate the statistical variance
Computation of preference index value Start
TABLE 3
STATISTICAL VARIANCE VALUES OF SUB-OBJECTIVES Sr. No. Properties Statistical variance (Vj)
1 Density 2×10⁻⁶
2 Young Modulus 1×10⁻⁵
3 Tensile Strength 5×10⁻⁴
4 Yields Strength 7×10⁻⁴
5 Hardness 9×10⁻⁴
6 Elongation 0.002
Step 5:- Determine objective weights of importance of the attributes
The objective weight of the jth attribute W
j is computed by
dividing the statistical variance of jth attribute with the total
value of the statistical variances of ‘m’ number of attributes. The objective weights have been computed by using below mentioned formula and the values of objective weights are shown in Table 4.
m Wj = Vj / ∑ Vj i=1
TABLE 4
OBJECTIVE WEIGHTS OF IMPORTANCE OF THE ATTRIBUTES Sr. No. Parameter Objective weight (Wj)
1 Density 6×10⁻⁴
2 Young Modulus 0.003
3 Tensile Strength 0.134
4 Yields Strength 0.197
5 Hardness 0.232
6 Elongation 0.433
Step 6:- Computation of preference index
The preference index for each alternative indicates the score or merit of the alternative with respect to the other alternatives. The preference index (Pi) has been calculated by using the following equations. The values of the preference index values are shown in Table 5.
m
Pi= ∑ Wj × xij
j=1 TABLE 5
PREFERENCE INDEX VALUES OF MATERIAL Sr. No. Materials Preference Index
1 S45C 0.787
2 Q235 0.771
3 ASTM A36 0.77
4 AISI 1038 0.895
5 C40 0.755
Step 7:- Rank the materials
The next step is to do the ranking of materials on the basis of preference index value. The alternate whose value is closest to unity is termed as best material. In this work, AISI 1038 has highest preference index value placed at first position. The material S45C placed at second position and the material C 40 placed at fifth position. The ranking of materials are shown in Table 6.
TABLE 6 RANKING OF MATERIAL Sr.
No.
Materials
Preference Index
Rank
1 S45C 0.787 2
2 Q235 0.771 3
3 ASTM A36 0.77 4
4 AISI 1038 0.895 1
5 C40 0.755 5
A. Implementation of TOPSIS method
The TOPSIS was first developed [9]. According to this technique, the best alternative would be the one that is nearest to the positive-ideal solution and farthest from the negative ideal solution. In short, the positive-ideal solution is composed of all best values attainable from the criteria, whereas the negative ideal solution consists of all worst values attainable from the criteria. The TOPSIS method
consists of the following steps [10].
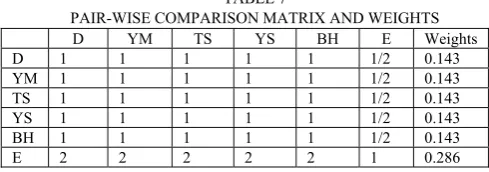
Step 1:- Pair-wise comparison of different sub -objectives
The importance of ith sub-objective is compared with jth
sub-objectives is calculated. The Pair-wise comparison matrix and weights for the sub-objectives are shown in Table 7.
TABLE 7
PAIR-WISE COMPARISON MATRIX AND WEIGHTS
D YM TS YS BH E Weights
D 1 1 1 1 1 1/2 0.143
YM 1 1 1 1 1 1/2 0.143
TS 1 1 1 1 1 1/2 0.143
YS 1 1 1 1 1 1/2 0.143
BH 1 1 1 1 1 1/2 0.143
E 2 2 2 2 2 1 0.286
Step 2:- Calculate the weighted normalized decision matrix The weighted normalized computed by multiplying the normalized decision matrix by its associated weights. The weighted normalized decision matrix is shown in Table 8.
[image:3.595.304.549.353.439.2]Vij = Wj×Rj
TABLE 8
WEIGHTED NORMALIZED DECISION MATRIX OF ATTRIBUTES
D YM TS YS BH E
S45C 0.029 0.028 0.031 0.035 0.031 0.071
Q235 0.028 0.029 0.023 0.024 0.034 0.058 ASTM
A36 0.028 0.028 0.027 0.026 0.022 0.049 AISI
1038 0.028 0.028 0.028 0.029 0.026 0.04 C40 0.028 0.029 0.032 0.035 0.029 0.067
Step 5:- Determine the positive-ideal (best) and
negative-ideal (worst) solutions.
The positive-ideal (best) and negative-ideal (worst) solutions can be expressed as;
max min V + = {(∑V
ij / jє J), (∑Vij / j є J’) / i=1,2,3,……,N},
i i
= {V1+, V2+, V3+, V4+ ,….. VM+ }
min max V - = {(∑V
ij / jє J), (∑Vij / jє J’) / i=1,2,3,……,N},
i i
= {V1-, V2-, V3-, V4- ,….. VM-}
Where J = (j=1,2,3……,M ) / j is associated with beneficial attributes, and
J’=(j=1,2,3……,M ) / j is associated with non- beneficial attributes.
The alternative V+ indicates the most preferable alternative
or the idle solution. Similarly, alternative V- indicates the
least preferable alternative or the negative-idle solution. The values of positive-ideal (best) and negative-ideal (worst) solutions are shown in Table 9.
TABLE 9
POSITIVE-IDEAL (BEST) AND NEGATIVE-IDEAL (WORST) SOLUTIONS
D YM TS YS BH E
V + 0.029 0.029 0.032 0.035 0.034 0.04
V - 0.028 0.028 0.023 0.024 0.022 0.071
Step 6: Calculate the separation measures
The separation of each alternative from the positive-ideal solution and negative-ideal solution is given by the following equations. The values of separation measures are shown in Table 10.
M
S1+ ={∑(Vij-Vj+)2 } 0.5
j=1 M
S1- ={∑(Vij-Vj-)2 } 0.5
j=1
( i=1,2,3,…….N) TABLE 10
SEPARATION MEASURES OF ATTRIBUTES
SS45C+ 0.031 SS45C- 0.016
SQ235+ 0.023 SQ235+ 0.016
SASTM A36+ 0.018 SASTM A36- 0.024
SAISI 1038+ 0.011 SAISI 1038- 0.032
SC40+ 0.027 SC40- 0.015
Step 7: Calculate the relative closeness to the idea solution The relative closeness of the alternative Aj has been
[image:4.595.304.551.327.405.2]expressed as shown in Table 11. TABLE 11
CALCULATE THE RELATIVE CLOSENESS Sr. No. Materials Relative closeness
1 S45C 0.339
2 Q235 0.413
3 ASTM A36 0.562
4 AISI 1038 0.738
5 C40 0.364
Step 8: Rank the materials
The next step is to do the ranking of materials on the basis of relative closeness value. The alternative whose value is
1038 has highest preference index value placed at first position. The ranking of other materials is shown in Table 12.
TABLE 12
CALCULATE THE RELATIVE CLOSENESS
Sr. No. Materials Rank
1 S45C 5
2 Q235 3
3 ASTM A36 2
4 AISI 1038 1
5 C40 4
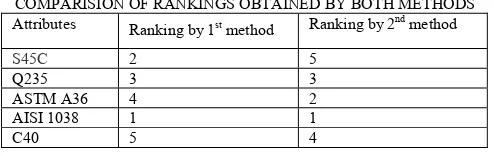
In present work, two different methods have been applied for selection of materials. The ranking computed by both methods is different as shown in Table 12. The values obtained by first method are based on objective weights only i.e. Wo=1 and Ws=0. The result obtained by second
method are based on subjective weights only i.e. Wo=0 and
Ws=1. The ranking of materials has also been computed by
different combination of objective and subjective weights such as Wo=0.8 and Ws=0.2, Wo=0.5 and Ws=0.5, Wo=0.4
and Ws=0.6. Thus, a final decision can be taken, keeping in
view of the practical considerations. TABLE 12
COMPARISION OF RANKINGS OBTAINED BY BOTH METHODS Attributes Ranking by 1st method Ranking by 2nd method
S45C 2 5
Q235 3 3
ASTM A36 4 2
AISI 1038 1 1
C40 5 4
III. CONCLUSIONS
In this paper, preference index of different materials have been computed using both MADM and TOPSIS methods. In this work, alternative fourth (AISI 1038) is placed at first position by using both methods. For rest of the materials the ranking of materials get changed because of subjectivity as well as objectivity issues taken in the problem. For more attributes, it is suggested to adopt excel program and MATLAB coding system, as both the methods are user-friendly for the ranking of the parameters.
REFERENCES
[1] S.M. Sapuan, I.M. Mujtaba, C.S. Wright, “State of the Art Review of Engineering Materials Selection Methods”, Multidiscipline Modeling in Materials and Structures, vol. 5, no. 3, pp. 263-268, 2009. [2] P. Chatterjee, V.M. Athawale, S. Chakraborty, “Selection of materials
using compromise ranking and outranking methods”, Material and Design, vol. 30, no. 10, pp. 4043-4053, 2009.
[3] S.M Sapuanv, “A knowledge-based system for materials selection in mechanical engineering design”, Materials and Design, vol. 22, no. 8, pp. 687-695, 2001.
[4] R.V. Rao and B.K. Patel, “A subjective and objective integrated multiple attribute decision making method for material selection”, Materials and Design, vol. 31, no. 10, pp. 4738-4747, 2010. [5] J.W.K. Chan and T.K.L. Tong, “Multi-criteria material selections and
end-of-life product strategy: a grey relational approach”, Materials and Design, vol. 28, no. 5, pp.1539-1546, 2007.
[image:4.595.47.291.393.586.2] [image:4.595.44.288.641.726.2][7] Ashby M.F., Materials selection in mechanical design. 3rd. edition, Oxford, (2005).
[8] www.articles.economictimes.indiatimes.com, 24 June, 2007. [9] C. Hwang and K. Yoon, Multiple attribute decision making: method
and application, Springer Publications,1981.