Use of EOQ & BEP in Construction for Material
Management
Gamane Ankush K. 1, Prof. Gaurav N. Desai2
1
M. Tech research scholar, 2Assistant Professor, Department of Civil Engineering (Construction Management), Sandip university, SOET, Nashik, Maharashtra, India
Abstract: In construction industry the problem of exceeding the overall estimated budget often arises and it seems quite challenging to be precise all the time. Its need to overcome such problems for that the proper use of inventory control or material planning is needed which is achieved by inventory management. In any construction project the working capital consist of 60-70% material cost of the total cost of the project. A properly implemented materials management program can achieve the timely flow of materials and equipment to the job site and thus facilitate improved workforce planning, increased labor productivity, better schedules and lower project costs. The main objective of our study is to select the Qualitative analysis technique such as Economic order Quantity (EOQ), Break Even Analysis (BEP) and to maintain sufficient stock of raw material and Control investment in inventories and give pragmatic suggestion for Future work. Thus, the cost effectiveness can be achieved.
Keywords: BEP, EOQ, Inventory Management, stock, cost effectiveness.
I.INTRODUCTION
Construction is second largest economic activity in India, next only to agriculture. The amount of money invested in and the jobs provided by construction industry are much larger than any other industry in India. Construction plays a critical role in all development sectors like agriculture, irrigation, energy, transportation, communication, manufacturing, housing, civil infrastructure and social services. The scope and volume of the construction industry can be directly linked with size and population of the country. In India, the construction industry employs a very large workforce probably next only to agriculture. Thus, the construction industry is an important industry for economic development.
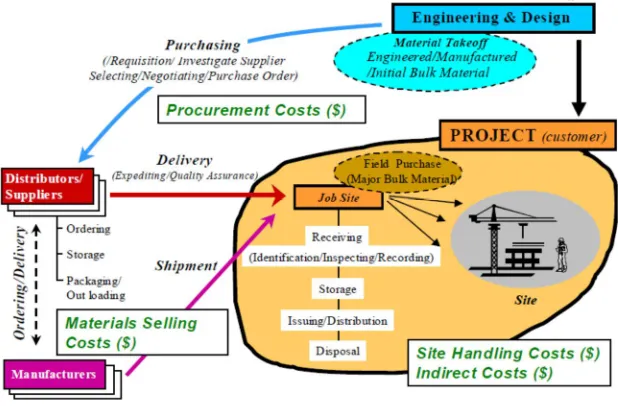
[image:1.612.154.463.478.681.2]In Construction Industry the problem of exceeding the estimated budget often arises and it seems quite difficult to be precise all the time. To overcome such problems the use of proper inventory control or material planning is needed which is achieved by inventory management. In any construction project the working capital of the material comprises of 60-70% of the total cost of the project.
Fig. 1 Typical Material Management in Construction (Source Thabet, 2001)
The following is a list of reasons n neither necessarily exhaustive nor mutually exclusive, though closely related:
1) Protection against uncertainties in Transit and handling
2) To give customer assurance of availability
3) To hedge against expected surges in sales
4) To await shipment to fill a definite order
5) To handle production variations
6) To make materials in economic lot sizes
7) To hold off increasing capacity.
8) To provide raw material storage
A. Economic Order Quantity
Wherever Economic order quantity (EOQ) is the order quantity of inventory that minimizes the total cost of inventory management. Economic order quantity (EOQ) is the ideal order quantity a company should purchase for its inventory given a set cost of production, demand rate and other variables. This is done to minimize variable inventory costs, and the equation for EOQ takes into account Storage, ordering costs and shortage costs.
= 2∗ ∗
∗
Where,
S=Annual Consumption, Co= Cost of Order, Cu=Unit price, i = Inventory Cost in %
B. Break Even Point
In simple words, the break-even point can be defined as a point where total costs (expenses) and total sales (revenue) are equal. The origins of break-even point can be found in the economic concepts of “the point of indifference.” Calculating the break-even point of a company has proved to be a simple but quantitative tool for the managers. The break-even analysis, in its simplest form, facilitates an insight into the fact about revenue from a product or service incorporates the ability to cover the relevant production cost of that particular product or service or not. Moreover, the break-even point is also helpful to managers as the provided info can be used in making important decisions in business, for example preparing competitive bids, setting prices, and applying for loans.
( ) = Fixed costs
Price per unit − Variable costs
II.NEED OF STUDY
Importance of materials management in construction can be accessed through the fact that about 60% to 70% of the total project cost goes the materials and its management. Survey shows that average material cost is 64% (50% to 65%) of the sales value and only 36% cost goes towards wages & salaries, overheads and profit etc. Thus, the importance of materials management lies in the fact that any significant contribution made by the materials manager in reducing materials cost will go a long way in improving the profitability and the rate of return on investment.
III.OBJECTIVES
A. To maintain sufficient stock of raw materials.
B. To Control investment in inventories.
C. To study about the ordering levels for the important components of inventory.
D. To achieve the cost effectiveness.
E. To take care of contingencies.
F. To stabilize Production.
G. To keep pace with changing market conditions.
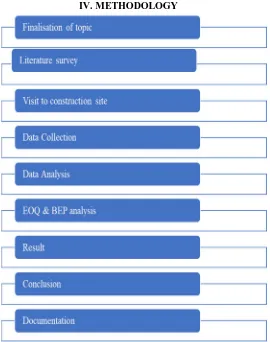
IV.METHODOLOGY
Fig. 2 Methodology Flowchart
V.DATA COLLECTION
Avoid The project research is divided into two groups viz: -
1) Primary Data
a) The data is collected from the firm.
b) The data which is used is of hospital & residential building which is under construction.
c) EOQ and BEP analysis can be performed on this data.
2) Secondary Data
a) The data that is used in this study is of secondary nature. The data is to be collected from secondary sources such as various websites, banks etc.
Below data shows the quantity of material required for bricks, cement, sand, coarse aggregate and steel: -
A. Project 1 (Hospital Building)
Table 1 Material Quantity required for project
Sr. No. Material Total Quantity
1 Cement 2349 Bags
2 Sand 221.5431448 Cu.M.
3 Coarse Aggregate 161.1041367 Cu.M.
4 Bricks 30407 No.
[image:3.612.87.519.635.722.2]B. Project 2 (Residential Building)
Table 2 Material Quantity required for project
Sr. No. Material Total Quantity
1 Cement 1820 Bags
2 Sand 160 Cu.M.
3 Coarse Aggregate 115 Cu.M.
4 Bricks 98269 No.
5 Steel 12550 Kg
C. Data for BEP Calculation
Break Even point can be calculated for the Brick manufacturing by contractor to minimise the cost of construction. The data is collected as,
Table 3 Data for BEP
Fixed Cost = 450000
Variable cost per unit = 3
Selling price per unit = 6
Required Min. Quantity of Bricks = 153145
VI.DATA ANALYSIS
From the collected data we analyze it by using MS-Excel to calculate EOQ & BEP by using formulas by combining both projects material Quantity.
A. EOQ Analysis
EOQ Calculation for Cement: -
= 2∗ ∗
∗
Where,
S = Annual Consumption=4461 Co= Cost of Order = 2200 Cu= Unit price = 330 I = Inventory Cost in % = 15%
= ∗ ∗
∗ % =629.7089275
No. Of order = = = 7.080952381 =7 Order in year
Duration of Order =
. = = 52 Days Cost of one Order = (EOQ * Cu) + Co
= (7 * 330) +2200 = 210100 Rs.
Total Ordering Cost = Cost of one order * EOQ = 210100 * 7
= 1470700 Rs.
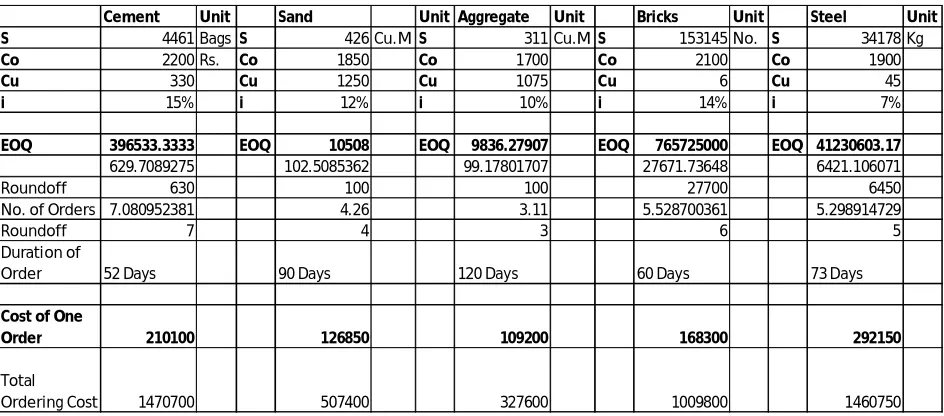
Table 4 EOQ Calculation table
[image:5.612.71.543.88.296.2]1) Material Consumption -Cement
Table 5 Material Consumption of cement no of
order
Duration of order (Days)
Order
quantity cost of order (Rs,) Consumption
1 52 630 210100 580
2 104 630 210100 680
3 156 630 210100 680
4 208 630 210100 680
5 260 630 210100 680
6 312 630 210100 680
7 364 630 210100 680
2) Graph for Consumption of Cement
Fig. 3 EOQ graph for cement consumption
From the above EOQ analysis graph for cement it is know that economic order quantity which is 630 Bags & frequency of ordering 52 days and having dead sock of 50 bags which has overcome the problems of Stock out successfully.
Cement Unit Sand Unit Aggregate Unit Bricks Unit Steel Unit
S 4461 Bags S 426 Cu.M S 311 Cu.M S 153145 No. S 34178 Kg
Co 2200 Rs. Co 1850 Co 1700 Co 2100 Co 1900
Cu 330 Cu 1250 Cu 1075 Cu 6 Cu 45
i 15% i 12% i 10% i 14% i 7%
EOQ 396533.3333 EOQ 10508 EOQ 9836.27907 EOQ 765725000 EOQ 41230603.17
629.7089275 102.5085362 99.17801707 27671.73648 6421.106071
Roundoff 630 100 100 27700 6450
No. of Orders 7.080952381 4.26 3.11 5.528700361 5.298914729
Roundoff 7 4 3 6 5
Duration of
Order 52 Days 90 Days 120 Days 60 Days 73 Days
Cost of One
Order 210100 126850 109200 168300 292150
Total
B. BEP Analysis
As per given Data,
Fixed Cost = Rs. 450000 Variable Cost per unit = Rs. 3 Selling price per unit = Rs. 6
Required Min. Quantity of Bricks = 153145 No.
Break Even Quantity =
=
= 150000 Break Even Sales = BEQ * Selling price per unit
= 150000 * 6 = 900000
Margin of Safety = Required Quantity – BEQ = 153145 – 150000 = 3145
Profit = 3145* 6 = 18870 Rs.
[image:6.612.90.524.362.718.2]As contractor is in profit, he can manufacture the bricks for construction. Following Table is for Break Even Point Analysis
Table 6 BEP Calculation
Fixed Cost Variable Cost Total cost Total Revenue
No. of units Fixed Cost
Variable Cost per unit * No. of units
Fixed cost+ variable cost
Sales price * no. of units
10000 450000 30000 480000 60000
20000 450000 60000 510000 120000
30000 450000 90000 540000 180000
40000 450000 120000 570000 240000
50000 450000 150000 600000 300000
60000 450000 180000 630000 360000
70000 450000 210000 660000 420000
80000 450000 240000 690000 480000
90000 450000 270000 720000 540000
100000 450000 300000 750000 600000
110000 450000 330000 780000 660000
120000 450000 360000 810000 720000
130000 450000 390000 840000 780000
140000 450000 420000 870000 840000
150000 450000 450000 900000 900000
160000 450000 480000 930000 960000
170000 450000 510000 960000 1020000
180000 450000 540000 990000 1080000
190000 450000 570000 1020000 1140000
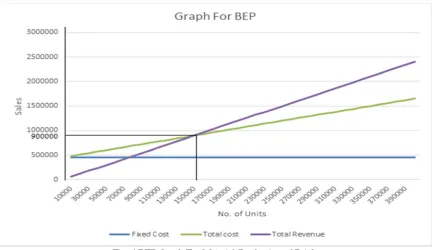
Fig. 4 BEP Graph For Material Production of Bricks
Total cost of bricks by buying from another site = Rs. 10,09,800 Total cost of bricks by manufacturing = Rs. 05,36,007
Profit to the contractor = Rs. 04,73,792
From above BEP calculation, we know that by manufacturing the bricks by contractor instead of buying from vendor, the contractor is in profit. So, he can manufacture the bricks.
II.RESULT
A. In the Quantitative Analysis study mainly focuses on inventory control techniques which includes EOQ Analysis to maintain sufficient stock of raw material during the period of short supply.
TABLE 7SUMMARY OF EOQANALYSIS
Name of material Annual Requirement
Order Quantity
Number of orders
Order cycle in Days
Cement 4461 630 Bags 7 52
Sand 426 100 Cu.M. 4 90
Coarse Aggregate 311 100 Cu. M. 3 120
Bricks 153145 27700 No. 6 60
Steel 34178 6450 Kg. 5 73
B. Also, from BEP analysis we know that Total Profit for the material Brick is up to 3% to the overall cost of bricks that indirectly minimise the total cost of construction.
VIII. CONCLUSION
After EOQ analysis for materials, it is concluded that economic order quantity & frequency of ordering has overcome the problems of Stock out successfully over the actual Site stock records.
The Total cost of inventory after adoption of EOQ analysis is less than without adopting EOQ.
Also, by knowing the demand of usage of materials, we can determine the reordering level by keeping some amount of safety stock such that there will be continuous supply of material and no delay of work.
[image:7.612.90.522.74.324.2]REFERENCES
[1] Bala, K. C., & Ndaliman, M. B. (2007). Practical Limitations of Break-Even Theory. AU J.T. 11(1), 58-61.
[2] Barwa, T. M. (2015). Inventory Control as an Effective Decision-Making Model. International Journal of Economics, Finance and Management Sciences, 465-472.
[3] Dr.G.Brindha. (2014). Inventory Management. International Journal of Innovative Research in Science,, 8163-8176.
[4] Khan, M. A., Qureshi, M. I., Apte, A. N., I, H., & Biswas, A. P. (2016). Cost Optimization Using EOQ. International Journal of Research in Advent Technology, 26-32.
[5] Kontuš, E. (2014). MANAGEMENT OF INVENTORY. Original scientific article, 245-256.
[6] Lin, T.-Y. (2010). An economic order quantity with imperfect quality and quantity discounts. Applied Mathematical Modelling, 3158-3165.
[7] Madgi, R. J., & Vanakudari, P. S. (07 July 2018). Inventory Control Techniques in Material Management. International Research Journal of Engineering and Technology (IRJET), 1586-1589.
[8] Miss. Nanaware, M. R., & Prof. Saharkar, U. R. (2017). APPLICATION OF INVENTORY CONTROL TECHNIQUE IN. International Journal of Engineering Research and General Science, 49-54.
[9] Mohopadkar, J. S., & Patil, D. P. (2017). Application of Inventory Management in Construction Industry. International Journal on Recent and Innovation Trends in Computing and Communication, 223-231.
[10] Morano, P., & Tajani, F. (2013). Break Even Analysis for the Financial Verification of Urban. Applied Mechanics and Materials, 1830-1835. [11] Morano, P., & Tajani, F. (2016). The break-even analysis applied to urban renewal investments: A. ELSEVIER, 10-20.
[12] Ndaliman, M. B., & Suleiman, U. Y. (2011). An Economic Model for Break-even Analysis. ResearchGate, 1-6.
[13] Rezaei, J. (2016). Economic order quantity and sampling inspection plans for imperfect. Computers & Industrial Engineering, 1-7.
[14] Soni, H., Pitroda, D. J., & J.J.Bhavshar, P. (2016). ANALYZING INVENTORY MATERIAL MANAGEMENT CONTROL. TECHNIQUE ON RESIDENTIAL CONSTRUCTION PROJECT. IJARIIE, 3071-3077.