Journal:
ageing
Article id:
afu168
Colour on-line figure
none
Colour print figures
none
The following queries have arisen while collating the corrections. Please check and advise us on the below
queries.
1.
Please check the insertion of telephone and fax numbers.
Age and Ageing Advance Access published November 14, 2014
at University of the West of England on November 20, 2014
http://ageing.oxfordjournals.org/
Objectively assessed physical activity and lower
limb function and prospective associations with
mortality and newly diagnosed disease in UK
older adults: an OPAL four-year follow-up study
K
ENNETHR. F
OX1, P
O-W
ENK
U2, M
ELVYNH
ILLSDON3, M
ARKG. D
AVIS1, B
ETHANYA. J. S
IMMONDS1,
J
ANICEL. T
HOMPSON4, A
FRODITIS
TATHI5, S
ELENAF. G
RAY6, D
EBORAHJ. S
HARP7, J
OANNEC. C
OULSON11
Centre for Exercise, Nutrition and Health Sciences, University of Bristol, Bristol, Avon, UK
2
Graduate Institute of Sports and Health, National Changhua University of Education, Changhua City, Taiwan
3
Department of Sport and Health Sciences, University of Exeter, Exeter, UK
4
School of Sport, Exercise, and Rehabilitation Sciences, University of Birmingham, Birmingham, UK
5
Department for Health, University of Bath, Bath, UK
6
Department of Health and Applied Social Sciences, University of West of England, Bristol, UK
7
Centre for Academic Primary Health Care, University of Bristol, Bristol, UK
Address correspondence to: K. R. Fox. Tel/Fax: (+44) 01392 253761. Email: [email protected]
Abstract
Background:objective measures of physical activity and function with a diverse cohort of UK adults in their 70s and 80s were used to investigate relative risk of all-cause mortality and diagnoses of new diseases over a 4-year period.
Participants:two hundred and forty older adults were randomly recruited from 12 general practices in urban and suburban areas of a city in the United Kingdom. Follow-up included 213 of the baseline sample.
Methods: socio-demographic variables, height and weight, and self-reported diagnosed diseases were recorded at baseline. Seven-day accelerometry was used to assess total physical activity, moderate-to-vigorous activity and sedentary time. A log recorded trips from home. Lower limb function was assessed using the Short Physical Performance Battery. Medical records were accessed on average 50 months post baseline, when new diseases and deaths were recorded.
Analyses:ANOVAs were used to assess socio-demographic, physical activity and lower limb function group differences in dis-eases at baseline and new disdis-eases during follow-up. Regression models were constructed to assess the prospective associations between physical activity and function with mortality and new disease.
Results:for every 1,000 steps walked per day, the risk of mortality was 36% lower (hazard ratios 0.64, 95% confidence interval (CI) 0.44–0.91, P= 0.013). Low levels of moderate-to-vigorous physical activity (incident rate ratio (IRR) 1.67, 95% CI 1.04–2.68,P= 0.030) and low frequency of trips from home (IRR 1.41, 95% CI 0.98–2.05,P= 0.045) were associated with diagnoses of more new diseases.
Conclusion:physical activity should be supported for adults in their 70s and 80s, as it is associated with reduced risk of mortality and new disease development.
Keywords:older adults, physical activity, physical function, mortality, newly diagnosed disease
Introduction
The value of physical activity for the prevention of coronary heart disease, stroke, type 2 diabetes and some cancers is now well established for the adult population [1,2]. Further benefits are seen in middle to later life as activity reduces risk
of physical disability [3], and cognitive impairment, dementia and Alzheimer’s disease [4]. Evidence is also emerging of the detrimental health effects of sedentary time, independent of physical activity [5].
Older adults are the least active sector of society. In the United Kingdom, <30% of 65–74 year olds and 15% of
Non-Commercial License (http://creativecommons.org/licenses/by-nc/4.0/), which permits non-commercial re-use,
distribution, and reproduction in any medium, provided the original work is properly cited. For commercial re-use, please contact [email protected]
at University of the West of England on November 20, 2014
http://ageing.oxfordjournals.org/
adults aged 75 or over reported any moderate intensity phys-ical activity lasting at least 10 min in the previous 4 weeks [6]. They are also the most sedentary sector, with US adults aged 60–69 spending over 8 h per day being sedentary [7]. Given that the older sector of the population is expanding and living longer, the promotion of active lifestyles has potential to extend life and reduce disease and disability.
Surprisingly, few studies have investigated the impact of physical activity on mortality and morbidity among those already in their late 70s and 80s [8–12]. These studies have included adults in their 60s, relied on self-reported physical activity and have yielded equivocal results. In contrast, recent systematic reviews of studies employing objective measures of physical function have shown that lower grip strength, walking speed, leg strength and balance are associated with higher risk of mortality in the over 70s [13]. A similar review investigating the prospective associations between these aspects of function and health outcomes identified effects for grip strength and walking speed on reduced risk of fracture, but associations with cardiovascular disease and stroke were inconclusive [14].
Physical activity and aspects of function are also moder-ately related [15] and can have reciprocal effects on each other. Low activity contributes to mobility deterioration and higher activity can improve or maintain mobility [16]. Conversely, mobility limitations, which might arise from con-ditions such as osteoarthritis or heart concon-ditions can also have a detrimental effect on physical activity [17]. To separate effects of activity from function, it is therefore important to provide robust assessments of both physical activity and function when investigating mortality and disease outcomes.
Concern has been expressed about the absence of use of objective measures for the assessment of physical activity when investigating mortality and morbidity in older adults [18]. Self-report is susceptible to socially desirable responding [19], and older adults have less accurate recall [20], and their physical activity is mainly walking which is less memorable than activity for leisure orfitness [21]. Accelerometry provides high precision data which can assess minute-by-minute activity at different levels of intensity, sedentary time and numbers of steps walked. This could be useful in helping identify whether particular levels of intensity are related to health benefit. Similarly, simple, home-based batteries of tests are available that provide valid estimates of several elements of function that reflect tasks of daily living and mobility [22].
The evidence base for the benefits of physical activity and good physical function remains limited for those already well into older age. This study focused on a population of UK older adults at least 70 years old (mean 78 years). Objective measures of both physical activity and lower limb function were employed to assess their influence on relative risk for all-cause mortality and diagnoses of new diseases over the following 4-year period.
Methods
Project OPAL (Older People and Active Living) was an ob-servational study conducted in 2007/08 with 240 adults aged 70 and older, living in suburban and urban sectors of a large
city in south west England. The aim of OPAL was to provide comprehensive objective documentation of physical activity and lower limb function in older people and to identify pos-sible determinants and consequences for health and well-being [15, 21, 23,24]. OPAL-PLUS was a follow-up study that provided health data from primary care records over the following 4–5 years [25]. Ethics approval for both studies was obtained from Bristol Southmead NHS (Ethics refer-ence 06/Q2002/127).
Sample
OPAL participants were recruited from 12 general practitioner (GP) surgeries, stratified by low, medium or high Index of Multiple Deprivation (IMD) and low or high access to local amenities. The sample was selected at random from the list of patients aged 70 or older at each practice following screening by a GP for (i) recent bereavement, (ii) terminal illness, (iii) debili-tating mental illness, (iv) inability to complete a questionnaire and (v) any other illness preventing participation. The final OPAL sample consisted of 115 females and 125 males. Age and gender of the sample were similar in distribution to those of the patient lists from which they were drawn. Percentages of either overweight or obese were similar to national distributions for England [6]. Also, the IMDs of participants’residence pro-vided a fair representation of the national IMD quartiles [26] (22.1% [lowest]; 27.9, 31.3 and 18.7% [highest]).
Baseline measures
OPAL baseline data were collected through two home visits as in Ref. [23]. For this paper, age (≤75.0–79.9, 80.0–84.9 and≥85.0 years), gender, highest level of education attained ( primary, secondary or tertiary), weight status calculated from measured height and weight (obese—body mass index (BMI) ≥30.0 kg/m2; overweight—BMI 25.0–29.9 kg/m2; normal/underweight—BMI <25.0 kg/m2), tertiles of IMD of area of residence and number of self-reported diagnosed conditions or diseases were used.
Physical activity
Physical activity was assessed by 7-day accelerometry using Actigraph GT1Ms (http://www.actigraphcorp.com) pro-grammed to record in 10-s epochs, to produce both count and pedometer data [24]. Data were reduced using MAH/ UFFE Analyser v. 1.9.0.3 (MRC Epidemiology Unit) set to ignore runs of 100 or more zeros, representing time when the monitor was not worn. Inclusion required at least 10 h of monitoring on at least 5 days. Daily means for registered wear time per day, total minutes of activity at moderate-to-vigorous intensity (MVPA) (>1,951 CPM), number of steps (STEPS) and minutes of sedentary time (0–99 CPM) were calculated. Additionally, a 7-day journey log recording time, purpose and transport mode of trips from the home was administered [21] and mean weekly frequency of trips from home (TRIPS) calculated.
K. R. Foxet al.
at University of the West of England on November 20, 2014
http://ageing.oxfordjournals.org/
Physical function
Participants’lower limb function was assessed using the Short Physical Performance Battery (SPPB) [2] that includes home-based tests of leg strength, walking speed and balance. These were summed to produce a lower limb function score.
Follow-up data
Data were extracted in October 2012 from the medical records of 213 (104 females) of the original 240 OPAL partici-pants (3 were withdrawn by their GPs, 21 withdrew by choice and 3 were not contactable). Mean lapse time since OPAL baseline assessment was 50 (±14) months. Number of new diagnoses of the chronic illnesses/conditions collected by the Quality Outcomes Framework in primary care (2011–12) [27] and date and cause of any death were recorded.
Data analyses
For ease of interpretation, STEPS representing activity volume, TRIPS indicating mobility from home and sedentary time were grouped into tertiles. MVPA was split into three groups (<10, 10–29 and≥30 min). Those in the most active group were therefore reaching recommended amounts, although this included all accumulated minutes rather than those achieved in at least 10-min bouts. Three lower limb function groups were formed (low:≤6, medium: 7–9, high: 10–12), which differentiate between levels of mobility disabil-ity [22]. ANOVAs were used to assess group differences in these variables in follow-up time, numbers of self-reported disease at baseline and numbers of new diseases recorded during follow-up.
Cox proportional hazard models were computed to address the prospective associations between physical activity and function variables at baseline and subsequent mortality. Poisson regression models, which are better suited for count data, were used to estimate associations with number of newly diagnosed diseases. The incident rate ratios (IRRs) in-dicate the number of newly diagnosed diseases per year for low and medium groups compared with the high activity or function (reference) group.
For mortality prediction, Model 1 was unadjusted, but for number of newly diagnosed diseases, Model 1 was adjusted for time lapse from baseline to follow-up, or point of death or move to a different practice. Model 2 was adjusted for confounders at baseline known to be associated with mortal-ity and morbidmortal-ity, including age, gender, educational attain-ment, IMD, weight status and number of self-reported diseases/conditions. Model 2 was also adjusted for the prac-tice recording system from which the data were extracted, because the four different systems we encountered produced some significant differences in disease diagnoses and health service usage means [25].
To assess the effects of activity and function independent-ly of each other, for the activity variables, Model 3 was adjusted for lower limb function. For lower limb function, in Model 3, STEPS as an indicator of activity volume was
adjusted for mortality, and MVPA as an indicator of higher intensity activity was adjusted for new disease prediction. These activity variables also emerged in Model 2 as the most potent activity variables. All analyses were performed with IBM SPSS 20.0.
Results
All 213 participants whose medical records were examined provided complete physical function, height and weight, and self-reported illnesses data at baseline. Two hundred and eight also provided valid accelerometry data (7 of these did not provide step data due to technical error). There were 33 deaths with a mean time from baseline of 29 (±19) months. There were no statistically significant differences in any socio-demographic variables, pre-existing disease, physical activity or lower limb function between the 213 adults in the final sample and those lost to follow-up (n= 27). Zero-order corre-lations between STEPS, MVPA, TRIPS and lower limb func-tion were r= 0.45–0.55, indicating a moderate univariate association.
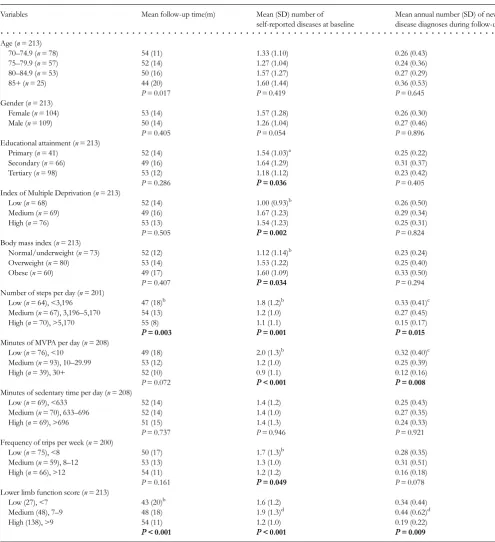
Mean follow-up times were not significantly different for any of the socio-demographic or weight status groups (Table1). Significantly more pre-existing diseases were reported at baseline for lower education, higher IMD and BMI groups. In contrast, no significant differences in group means for any socio-demographic variable or BMI groups were seen for numbers of newly diagnosed diseases.
Physical activity, lower limb function and mortality
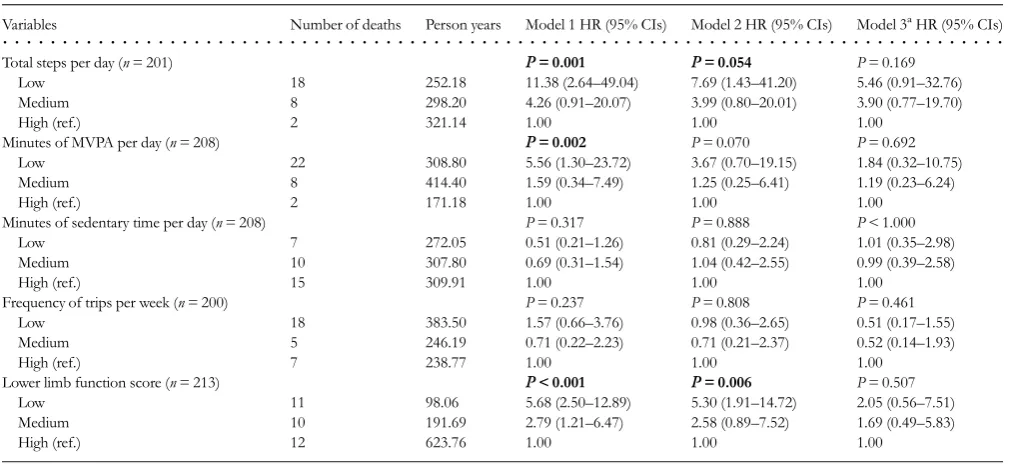
Table2shows the hazard ratios (HR) for all-cause mortality by level of STEPS, MVPA, TRIPS, sedentary time and lower limb function. A strong and significantly increased risk was seen for low levels of STEPS (HR [low versus high] 11.38, 95% CI 2.64–49.04,P= 0.001) and MVPA (HR [low versus high] 5.56, 95% CI 1.30–23.72,P= 0.002) in the unadjusted Model 1. For STEPS only, (HR [low versus high] 7.69, 95% CI 1.43–41.20,P= 0.054) all-cause mortality remained mar-ginally significant in adjusted Model 2. There was no evi-dence of an association with mortality for either volume of sedentary time or for trip frequency. However, a strong effect is seen in adjusted Model 2 (HR [low versus high] 5.30, 95% CI 1.91–14.72,P= 0.006) for lower limb function. Analyses (not shown) were repeated, treating physical activity as con-tinuous variables and revealed similar associations in terms of direction, magnitude and significance. An exception to this was for STEPS which reached statistical significance in Model 3 (additionally adjusted for lower limb function) (HR 0.64 per 1,000 STEPS/day, 95% CI 0.44–0.91,P= 0.013).
Physical activity, lower limb function and newly diagnosed disease
Sixty-two per cent of participants had at least one new disease diagnosed in follow-up. Of 210 newly diagnosed dis-eases, 60 (30%) were cardiovascular related, 37 (17.4%)
at University of the West of England on November 20, 2014
http://ageing.oxfordjournals.org/
arthritis, 35 (16.4%) cancer, 33 (15.5%) kidney disease and 18 (8.5%) some form of mental illness. Low-active and low-function groups had significantly more diseases at baseline.
[image:5.612.63.559.74.617.2]Also, follow-up times differed across STEPS and lower limb function groups and were therefore adjusted in the models predicting new disease. Table 3 shows a significantly
. . . .
Table 1.Follow-up time, baseline disease and new disease by socio-demographics, weight status, physical activity and lower limb function groupsVariables Mean follow-up time(m) Mean (SD) number of self-reported diseases at baseline
Mean annual number (SD) of new disease diagnoses during follow-up
Age (n= 213)
70–74.9 (n= 78) 54 (11) 1.33 (1.10) 0.26 (0.43)
75–79.9 (n= 57) 52 (14) 1.27 (1.04) 0.24 (0.36)
80–84.9 (n= 53) 50 (16) 1.57 (1.27) 0.27 (0.29)
85+ (n= 25) 44 (20) 1.60 (1.44) 0.36 (0.53)
P= 0.017 P= 0.419 P= 0.645
Gender (n= 213)
Female (n= 104) 53 (14) 1.57 (1.28) 0.26 (0.30)
Male (n= 109) 50 (14) 1.26 (1.04) 0.27 (0.46)
P= 0.405 P= 0.054 P= 0.896
Educational attainment (n= 213)
Primary (n= 41) 52 (14) 1.54 (1.03)a 0.25 (0.22)
Secondary (n= 66) 49 (16) 1.64 (1.29) 0.31 (0.37)
Tertiary (n= 98) 53 (12) 1.18 (1.12) 0.23 (0.42)
P= 0.286 P= 0.036 P= 0.405
Index of Multiple Deprivation (n= 213)
Low (n= 68) 52 (14) 1.00 (0.93)b 0.26 (0.50)
Medium (n= 69) 49 (16) 1.67 (1.23) 0.29 (0.34)
High (n= 76) 53 (13) 1.54 (1.23) 0.25 (0.31)
P= 0.505 P= 0.002 P= 0.824
Body mass index (n= 213)
Normal/underweight (n= 73) 52 (12) 1.12 (1.14)b 0.23 (0.24)
Overweight (n= 80) 53 (14) 1.53 (1.22) 0.25 (0.40)
Obese (n= 60) 49 (17) 1.60 (1.09) 0.33 (0.50)
P= 0.407 P= 0.034 P= 0.294
Number of steps per day (n= 201)
Low (n= 64), <3,196 47 (18)b 1.8 (1.2)b 0.33 (0.41)c
Medium (n= 67), 3,196–5,170 54 (13) 1.2 (1.0) 0.27 (0.45)
High (n= 70), >5,170 55 (8) 1.1 (1.1) 0.15 (0.17)
P= 0.003 P= 0.001 P= 0.015
Minutes of MVPA per day (n= 208)
Low (n= 76), <10 49 (18) 2.0 (1.3)b 0.32 (0.40)c
Medium (n= 93), 10–29.99 53 (12) 1.2 (1.0) 0.25 (0.39)
High (n= 39), 30+ 52 (10) 0.9 (1.1) 0.12 (0.16)
P= 0.072 P< 0.001 P= 0.008
Minutes of sedentary time per day (n= 208)
Low (n= 69), <633 52 (14) 1.4 (1.2) 0.25 (0.43)
Medium (n= 70), 633–696 52 (14) 1.4 (1.0) 0.27 (0.35)
High (n= 69), >696 51 (15) 1.4 (1.3) 0.24 (0.33)
P= 0.737 P= 0.946 P= 0.921
Frequency of trips per week (n= 200)
Low (n= 75), <8 50 (17) 1.7 (1.3)b 0.28 (0.35)
Medium (n= 59), 8–12 53 (13) 1.3 (1.0) 0.31 (0.51)
High (n= 66), >12 54 (11) 1.2 (1.2) 0.16 (0.18)
P= 0.161 P= 0.049 P= 0.078
Lower limb function score (n= 213)
Low (27), <7 43 (20)b 1.6 (1.2) 0.34 (0.44)
Medium (48), 7–9 48 (18) 1.9 (1.3)d 0.44 (0.62)d
High (138), >9 54 (11) 1.2 (1.0) 0.19 (0.22)
P< 0.001 P< 0.001 P= 0.009
aLow and medium significantly different to high group. bLow significantly different to medium and high group. cLow significantly different to high group.
dMedium significantly different to high group. K. R. Foxet al.
at University of the West of England on November 20, 2014
http://ageing.oxfordjournals.org/
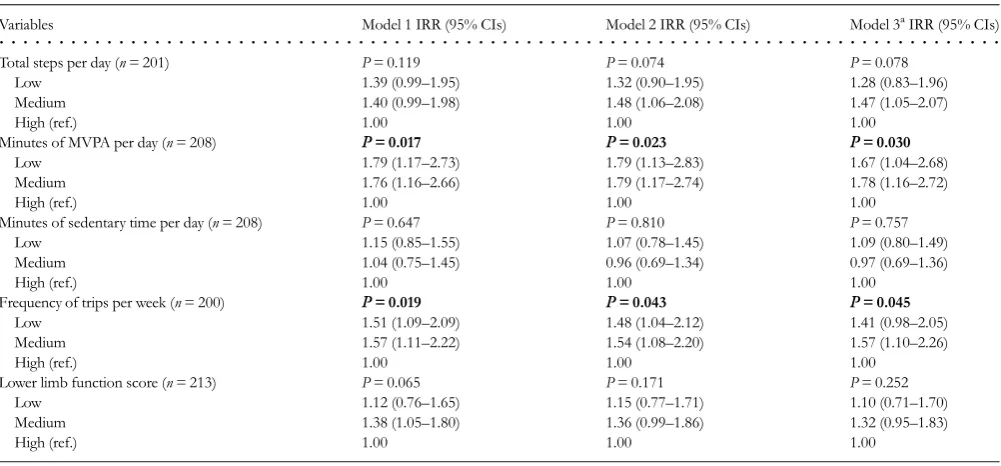
increased risk for new diseases for low levels of MVPA (IRR 1.67, 95% CI 1.04–2.68, P= 0.030) and TRIPS per week (IRR 1.41, 95% CI 0.98–2.05,P= 0.045) even after adjust-ment for all co-variates and lower limb function. No associa-tions were seen for sedentary time or lower limb function. Treating physical activity as continuous variables (not shown) made no difference to this pattern of associations.
Discussion
The benefits of physical activity for the prevention of prema-ture mortality and further morbidity, among people already in their 70s and 80s, are not well established. In this study, steps taken per day were significantly predictive of mortality with the risk being 36% lower for every 1,000 steps taken. Thisfinding supports Brownet al.[8] in a study with women (mean age: 75 years) and men (mean age: 72 years) which found risk reduction for mortality with low volumes of self-reported activity.
Lower limb function also indicated a strong association. Amount of walking is closely related to lower limb function, and both have indicated associations with mortality in previ-ous studies [8–12,13]. Model 3 of the regression analysis also indicated a degree of co-dependency in the prediction of mortality. There are many reasons why older adults lose lower limb function including osteoarthritis and falls, but physical activity is the most effective way of retaining func-tion. These findings suggest that the maintenance of a
moderate volume of walking may therefore be a key factor for reducing risk of premature mortality, even at this later stage of life. Furthermore, there is evidence from the LIFE project in the United States that lower limb function can be maintained or improved in older adults in their 70s and 80s through a regular programme of structured exercise [16].
[image:6.612.47.552.76.308.2]Amount of moderate-to-vigorous physical activity was a significant predictor of number of newly diagnosed diseases, even after adjustment for existing disease and lower limb function. This is in line with the evidence base underpinning current physical activity guidelines indicating that the main disease-related benefits are seen with 30 min of MVPA activ-ity each day [1,2]. It also corroborates previous results with OPAL participants showing that MVPA is an independent predictor of aspects of health service usage [25]. In our regressions, the high MVPA reference group included those who achieved 30 min per day (50.1 ± 25.4), compared with low and medium groups with mean MVPA of 3.7 and 18.1 min, respectively. However, only three individuals reached the high MVPA group volume through bouts lasting at least 10 min that features in guidelines. This is reflected in findings from a recent national survey in the United Kingdom, also based on accelerometry [28], showing only 7% of men and 3% of women met recommended amounts through 10-min bouts. Our results suggest that for adults of this age, the recommended amount of MVPA is beneficial even if it is accumulated in short bouts. Our previous analyses of the OPAL cohort data indicated that the bulk of total activity and MVPA was accumulated through active
. . . .
Table 2. Cox proportional regression models predicting all-cause mortality from baseline physical activity and lower limb functionVariables Number of deaths Person years Model 1 HR (95% CIs) Model 2 HR (95% CIs) Model 3aHR (95% CIs)
Total steps per day (n= 201) P= 0.001 P= 0.054 P= 0.169
Low 18 252.18 11.38 (2.64–49.04) 7.69 (1.43–41.20) 5.46 (0.91–32.76) Medium 8 298.20 4.26 (0.91–20.07) 3.99 (0.80–20.01) 3.90 (0.77–19.70)
High (ref.) 2 321.14 1.00 1.00 1.00
Minutes of MVPA per day (n= 208) P= 0.002 P= 0.070 P= 0.692
Low 22 308.80 5.56 (1.30–23.72) 3.67 (0.70–19.15) 1.84 (0.32–10.75)
Medium 8 414.40 1.59 (0.34–7.49) 1.25 (0.25–6.41) 1.19 (0.23–6.24)
High (ref.) 2 171.18 1.00 1.00 1.00
Minutes of sedentary time per day (n= 208) P= 0.317 P= 0.888 P< 1.000
Low 7 272.05 0.51 (0.21–1.26) 0.81 (0.29–2.24) 1.01 (0.35–2.98)
Medium 10 307.80 0.69 (0.31–1.54) 1.04 (0.42–2.55) 0.99 (0.39–2.58)
High (ref.) 15 309.91 1.00 1.00 1.00
Frequency of trips per week (n= 200) P= 0.237 P= 0.808 P= 0.461
Low 18 383.50 1.57 (0.66–3.76) 0.98 (0.36–2.65) 0.51 (0.17–1.55)
Medium 5 246.19 0.71 (0.22–2.23) 0.71 (0.21–2.37) 0.52 (0.14–1.93)
High (ref.) 7 238.77 1.00 1.00 1.00
Lower limb function score (n= 213) P< 0.001 P= 0.006 P= 0.507
Low 11 98.06 5.68 (2.50–12.89) 5.30 (1.91–14.72) 2.05 (0.56–7.51)
Medium 10 191.69 2.79 (1.21–6.47) 2.58 (0.89–7.52) 1.69 (0.49–5.83)
High (ref.) 12 623.76 1.00 1.00 1.00
HR, hazards ratio with confidence intervals (CIs).
Model 1: unadjusted; Model 2: adjusting for age, gender, educational attainment, IMD, weight status, GP Management System and number of self-reported chronic illnesses at baseline; Model 3: additionally adjusting for lower limb function.
aIn Model 3 for lower limb function additionally adjusting for STEPS.
at University of the West of England on November 20, 2014
http://ageing.oxfordjournals.org/
daily journeys for shopping and visiting friends [21].‘Walk and rest for a minute’may be a useful strategy for adults in this age group, particularly those working towards the recom-mended targets.
A surprising finding is that the frequency of trips from home also emerged as an independent predictor of newly diag-nosed disease. The association of frequency of trips with MVPA was moderate (r= 0.44), a finding recently supported by national-level accelerometry data [28]. However, our measure included all trips from the home regardless of the mode of transport, so that car and bus journeys were included. The higher tertile (reference group) included 12 (mean = 15.95) or more trips per week, and it is likely to be made up of people with socially involved lives which itself is related to reduced risk of mortality [29].
Although OPAL participants spent on average 11 h per day sedentary, our data showed no associations for sedentary time. Volume of sedentary time showed limited variance, with a standard deviation of <10% within each level, and this may have influenced its predictive power. Furthermore, the identification of sedentary time by use of accelerometer counts of 0–99 per minute has been challenged and may lack validity [30].
Limitations
The sample size of 213 was small compared with most pro-spective cohort studies. Although the strength of OPAL-PLUS was the objective assessment of physical activity and
function, accelerometry requires cut points in movement counts to define MVPA and sedentary time. For older adults, these are based on very limited data and may be prone to misclassification.
Mortality and disease have some co-dependence, and this may have influenced our results. Those who died early have had less time to contract new disease, whereas those who are already at risk of premature mortality may contract new con-ditions at a more rapid rate. Our analyses indicated that sig-nificantly more new diseases were recorded for those who died than survivors, even within a shorter follow-up. However, our regression results were unaffected, possibly because there were only 33 deaths.
A particular challenge with prospective cohort studies is the possibility of unmeasured, or poorly measured, factors being the true explanation of associations. Although we adjusted regressions for most established confounders, we did not include smoking or alcohol consumption. Also, there is a possibility that unidentified subclinical disease at baseline was associated with lower activity levels, and this may con-tribute to some associations.
Conclusions
[image:7.612.64.565.76.309.2]Even in this relatively small sample, the benefits of physical activity for reduced risk of premature mortality and further development of disease in older adults in their 70s and 80s can be seen. Volume of activity and amount of MVPA both emerge as important, with the effect for MVPA seen
. . . .
Table 3.Poisson regression models predicting number of newly diagnosed chronic illnesses from baseline physical activity and lower limb functionVariables Model 1 IRR (95% CIs) Model 2 IRR (95% CIs) Model 3aIRR (95% CIs)
Total steps per day (n= 201) P= 0.119 P= 0.074 P= 0.078
Low 1.39 (0.99–1.95) 1.32 (0.90–1.95) 1.28 (0.83–1.96)
Medium 1.40 (0.99–1.98) 1.48 (1.06–2.08) 1.47 (1.05–2.07)
High (ref.) 1.00 1.00 1.00
Minutes of MVPA per day (n= 208) P= 0.017 P= 0.023 P= 0.030
Low 1.79 (1.17–2.73) 1.79 (1.13–2.83) 1.67 (1.04–2.68)
Medium 1.76 (1.16–2.66) 1.79 (1.17–2.74) 1.78 (1.16–2.72)
High (ref.) 1.00 1.00 1.00
Minutes of sedentary time per day (n= 208) P= 0.647 P= 0.810 P= 0.757
Low 1.15 (0.85–1.55) 1.07 (0.78–1.45) 1.09 (0.80–1.49)
Medium 1.04 (0.75–1.45) 0.96 (0.69–1.34) 0.97 (0.69–1.36)
High (ref.) 1.00 1.00 1.00
Frequency of trips per week (n= 200) P= 0.019 P= 0.043 P= 0.045
Low 1.51 (1.09–2.09) 1.48 (1.04–2.12) 1.41 (0.98–2.05)
Medium 1.57 (1.11–2.22) 1.54 (1.08–2.20) 1.57 (1.10–2.26)
High (ref.) 1.00 1.00 1.00
Lower limb function score (n= 213) P= 0.065 P= 0.171 P= 0.252
Low 1.12 (0.76–1.65) 1.15 (0.77–1.71) 1.10 (0.71–1.70)
Medium 1.38 (1.05–1.80) 1.36 (0.99–1.86) 1.32 (0.95–1.83)
High (ref.) 1.00 1.00 1.00
IRR, incident rate ratio with confidence intervals (CIs).
Model 1: adjusting for time to follow-up; Model 2: adjusting for time to follow-up, age, gender, educational attainment, IMD, weight status, GP Management System and number of self-reported chronic illnesses at baseline; Model 3: additionally adjusting for lower limb function.
aIn Model 3 for lower limb function additionally adjusting for MVPA. K. R. Foxet al.
at University of the West of England on November 20, 2014
http://ageing.oxfordjournals.org/
independently of lower limb function and even if it is accu-mulated in bouts shorter than 10 min. Thesefindings indi-cate that physical activity should be encouraged in adults throughout their 70s and 80s, regardless of level of lower limb function and existing disease.
Key points
•The health benefits of physical activity for adults in their 70s and 80s are not established.
•Objective measures of activity and function have not been used in prospective studies with this age group.
• Volume of activity (as measured by steps per day) and function are predictive of reduced risk of mortality. •Moderate-to-vigorous activity is predictive of reduced risk
of new disease diagnosis, independent of lower limb function.
•Physical activity is beneficial for this age group regardless of socio-demographic characteristics, function and disease status.
Acknowledgements
The authors thank all the OPAL participants for their time and generosity, and acknowledge the help of Georgina Bentley, Janet Withall, Tanya Trayers and Carina Thorstensson with data collection, and Brad Metcalfe of Exeter University for statistical advice.
Conflicts of interest
None declared.
Funding
OPAL-PLUS, the follow-up study was made possible by a grant from the Dunhill Medical Trust (R200/0511) with additional support from the Avon Primary Care Research Collaborative and the South West General Practice Trust. Project OPAL provided the baseline data and was funded by Phase 1 of the National Prevention Research Initiative ((G0501312),http://www.npri.org.uk) that was supported by the British Heart Foundation, Cancer Research UK, Department of Health, Diabetes UK, Economic and Social Research Council, Medical Research Council, Research and Development Office for the Northern Ireland Health and Social Services, Chief Scientist Office, Scottish Executive Health Department, Welsh Assembly Government and World Cancer Research Fund. Professor Fox’s contribution is in part supported by the National Institute for Health Research (NIHR) Oxford Biomedical Research Centre based at Oxford University Hospitals NHS Trust and University of Oxford.
References
1. Department of Health. Start Active, Stay Active: A Report on Physical Activity for Health from the Four Home Countries’ Chief Medical Officers. London: Department of Health, 2011.
2. U.S. Department of Health and Human Services. Physical Activity Guidelines for Americans. Washington, DC: U.S. Department of Health and Human Services, 2008.
3. Vermeulen J, Neyens JL, van Rossum E, Spreeuwenber MD, de Witte LP. Predicting ADL disability in community-dwelling elderly people using physical frailty indicators: a systematic review. BMC Geriatrics 2011; 11: 33.
4. Hamer M, Chida Y. Physical activity and risk of neurodegen-erative disease: a systematic review of prospective evidence. Psychol Med 2009; 39: 3–11.
5. Rezende LFM, Rey-López JP, Matsudo VKR, Luiz OC. Sedentary behavior and health outcomes among older adults: a systematic review. BMC Public Health 2014; 14: 333. 6. Craig R, Mindell J, Hirani V. Health Survey for England 2008:
Physical Activity and Fitness. Leeds: The NHS Information Centre, 2009.
7. Matthews CE, Chen KY, Freedson PSet al. Amount of time spent in sedentary behaviors in the United States, 2003-2004. Am J Epidiol 2008; 167: 875–81.
8. Brown WJ, McLaughlin D, Leung Jet al. Physical activity and all-cause mortality in older men and women. Brit J Sport Med 2012; 46: 664–8.
9. Morgan K, Clarke D. Customary physical activity and survival in later life: a study in Nottingham, UK. J Epidemiol Community Health 1997; 51: 490–3.
10. Hakim AA, Petrovitch H, Burchfiel CM et al. Effects of walking on mortality among non-smoking retired men. N Engl J Med 1998; 338: 94–9.
11. Gregg EW, Cauley JA, Stone K et al. Study of Osteoporotic Fractures Research Group. Relationship of changes in physical activity and mortality among older women. JAMA 2003; 289: 2379–86.
12. Schooling CM, Lam TH, Li ZBet al. Obesity, physical activity, and mortality in a prospective Chinese elderly cohort. Arch Intern Med 2006; 166: 1498–504.
13. Cooper R, Kuh D, Hardy R; Mortality Review Group. Objectively measured physical capability levels and mortality: systematic review and meta-analyses. BMJ 2010; 341: c4467. 14. Cooper R, Kuh D, Cooper C et al. The FALCon and
HALCyon Study Teams. Objective measures of physical cap-ability and subsequent health: a systematic review. Age Ageing 2011; 40: 14–23.
15. Trayers T, Lawlor D, Fox KRet al. Associations of objectively measured physical activity with lower limb function in older men and women:findings from the Older People and Active Living (OPAL) Study. J Aging Phys Act 2014; 22: 34–43. 16. Pahor M, Guralnik JM, Ambrosius WTet al., for the LIFE study
inves-tigators. Effect of structured physical activity on prevention of major mobility disability in older adults. The LIFE Study Randomized Clinical Trial. JAMA 2014; doi: 10.1001/jama.2014.5616.
17. Lai JK, Lucas RM, Armstrong M, Banks E. Prospective obser-vational study of physical functioning, physical activity and time outdoors and the risk of hip fracture: a population-based cohort study of 158,057 older adults in the 45 and up study. J Bone Miner Res 2013; 10: 2222–31.
at University of the West of England on November 20, 2014
http://ageing.oxfordjournals.org/
18. Blair SN, Haskell WL. Objectively measured physical ac-tivity and mortality in older adults. JAMA 2006; 296: 216–8.
19. Adams SA, Matthew CE, Ebbeling CB et al. The effect of social desirability and social approval on self-reports of physic-al activity. Am J Epidemiol 2005; 161: 389–98.
20. Bonnefoy M, Normand S, Pachiaudi C, Lacour JR, Laville M, Kostka T. Simultaneous validation of ten physical activity ques-tionnaires in older men: a doubly labelled water study. J Am Geriatric Soc 2001; 49: 28–35.
21. Davis MG, Fox KR, Hillsdon Met al. Getting out and about in older adults: the nature of daily trips and their association with objectively assessed physical activity. Int J Behav Nutr Phys 2011; 8: 116. 22. Guralnik JM, Simonsick EM, Ferrucci L et al. A short
physical performance battery assessing lower extremity function: association with self-reported disability and prediction of mortal-ity and nursing home admission. J Gerontol 1994; 49: M85–94. 23. Fox KR, Hillsdon M, Sharp Det al. Neighbourhood
depriv-ation and physical activity in UK older adults. Health Place 2011; 17: 633–40.
24. Davis MG, Fox KR, Hillsdon M, Sharp DJ, Coulson J, Thompson JL. Objectively measured physical activity in a diverse sample of older urban-living UK adults. Med Sci Sport Exerc 2011; 43: 647–54.
25. Simmonds BAJ, Fox KR, Davis MGet al. Objectively assessed physical activity and function and subsequent health service use of UK adults aged 70 and over: a four tofive year follow up study. PLoS ONE 2014; 9: e97676.
26. Office of National Statistics. Indices of Deprivation 2007 for Super Output Areas. 2007.http://www.communities.gov.uk/ communities/neighbourhoodrenewal/deprivation/deprivation07 (November 2012, date last accessed).
27. Health and Social Care Information Centre. Quality and Outcomes Framework 2011-12. http://www.hscic.gov.uk/ catalogue/PUB08135(October 2012, date last accessed). 28. Jefferis BJ, Sartini C, Lee I-Minet al. Adherence to physical
activity guidelines in older adults, using objectively measured physical activity in a population-based study. BMC Public Health 2014; 14: 382.
29. Steptoe A, Shankar A, Demakakos P, Wardle J. Social isolation, loneliness, and all-cause mortality in older men and women. Proc Natl Acad Sci USA 2013; 110: 5797–801.
30. Hagströmer M, Oja P, Sjöström M. Physical activity and inactivity in an adult population assessed by accelerometry. Med Sci Sports Exerc 2007; 39: 1502–8.
Received 16 November 2013; accepted in revised form 11 September 2014
K. R. Foxet al.
at University of the West of England on November 20, 2014
http://ageing.oxfordjournals.org/