Impact of the position of the window in the reveal of a cavity wall on the heat loss and
the internal surface temperature of the head of an opening with a steel lintel
ABSTRACT
The interface between the head of the window and the wall represents one of the largest thermal bridges of a building and one of the areas with the highest risk of surface condensation. This paper confirmed the importance, and investigated the impact, of the location of the window in the reveal of a cavity wall on the Ψlintel and surface temperature of the area. Additionally, it studied the reliability and accuracy of assessing this thermal bridge using an adiabatic surface instead the actual window. Two possible construction details that meet PARTL 2013 were modelled and assessed with HEAT2D software, following two different methods: the standard and commonly used (adiabatic surface) method and the detailed one (including the actual window). The outputs revealed that the adiabatic surface prevents the software to account the heat transfer that in reality occurs between the window frame and the highly conductive steel lintel. Therefore, the current simplified method could underestimates the heat losses up to 33% and the surface temperature by over 4 ºC for certain locations. Additionally, it locates the optimal area for the frame between overlapping 70mm the cavity to align with the insulation layer of the cavity. Finally, it concluded that under current trends of extremely low Ψlintel the adiabatic surface has a greater impact than before, producing less accurate outputs, enough to start to think on the necessity of including the actual window during the assessment of the thermal performance of top hat lintels without base plate in low/zero carbon projects.
1. INTRODUCTION
A thermal bridge represents an area of least resistance to the heat flux through the building envelope. One of the most significant thermal bridges in cavity wall constructions is located at the head of openings, due to the sudden change in materials and geometry and the presence of steel lintels [1]. The side effects associated with a thermal bridge are greater heat loss and a subsequent reduction of the internal surface temperature in comparison with the surrounding area. This temperature gradient is naturally higher in corners and lintels [2]; [3]; [4]. Therefore, the lintel area is one of the most likely location for condensation and mould growth to occur.
Traditionally frames are fixed into the external leaf of the wall overlapping the cavity by a minimum of 30 mm, following the recommendation of the Robust Details catalogue [5]. However, well insulated walls are relatively thick, so the window can be placed at several locations in the reveal of the window opening. As energy heat loss associated with a thermal bridge is a result of the component performances as well as the way that components are interconnected [6], the location of the window in the reveal of a cavity wall also has an impact on the Ψlintel [4]; [6]; [7]; [8]. The linear thermal
transmittance [Ψ-value] measures the extra two-dimensional heat loss of the fabric through linear thermal bridges expressed as [W/mK] [9].
The window is part of the thermal envelope. The main design aim is to secure the continuity of this envelope. Therefore, in terms of thermal performance, the frame should be aligned with the layer of lower conductivity in the wall, the insulation layer. Roberts et al. [7] pointed out the importance of the location of the window with respect to the insulation layer of the wall, on the magnitude of the Ψlintel. In
their study the alignment of the window with the insulation of the cavity resulted in a significant reduction of the Ψlintel with respect to the extreme outer and inner locations. In the same line of
thoughts, the Zero Carbon Hub [8] concluded that in traditional brick and block cavity walls the deeper the window is moved into the cavity the better Ψ-value is achieved.
bridging at openings, which allow the substitution of the window with adiabatic boundary layers [9]. Therefore, Ψ-value is taken as independent of the window, and depends only on the location and geometry of the junction [9]. In terms of condensation risk, Ward [9] recommends that window should be included in the model, when known, to calculate the temperature factor.
1.1 Theory of heat loss calculations
A linear thermal bridge such as the steel lintel junction, is defined by its linear thermal transmittance [ψ-value] and its temperature factor [f -value] [10].
The linear thermal transmittance of the steel lintel junction [Ψlintel] measures the extra two-dimensional heat flow associated with the junction which is not accounted for by the U-values of the plane elements of the junction. The Ψlintel is calculated using the following equation in accordance with Ward and Sanders [10] and its units are W/mK:
𝛹 = 𝐿2𝐷− 𝑙
𝑤 ∙ 𝑈′𝑤 (1)
Where, L2D is the thermal coupling coefficient or the two-dimensional heat transfer coefficient between the inside and outside conditions, expressed in W/mK. U’w is the thermal transmittance or U-value of the flanking wall, expressed in W/m2K. lw is the length in metres over which the Uw value applies.
Additionally, the temperature factor at the internal surface [fRsi] is used to determine whether certain surfaces inside a building present potential for condensation because of their low surface temperature [9]. It is calculated under steady-state conditions by the following equation [9]:
𝑓𝑅𝑠𝑖 =𝑇𝑇𝑠𝑖−𝑇𝑒
𝑖−𝑇𝑒 (2)
Where Tsi is the minimum temperature of the internal surface and typically Te = 0 °C and Ti = 20 °C
are the external and internal air temperatures respectively, used for calculations for residential buildings in the UK [9]. If humid air contacts an internal surface with a temperature below dew point, for instance due to thermal bridging, condensation will occur [11]. For residential buildings in the UK Tsi should be greater than, or equal to, 15 °C, as determined by fCRsi = 0.75 the critical temperature to
avoid risk of condensation in dwellings [9]. Since the lintel area is one of the most likely locations for condensation, it is important to accurately calculate the temperature factor to determine any potential for condensation.
“Assessing the effects of thermal bridging at junctions and around openings” [9] and the “Conventions for calculating linear thermal transmittance and temperature factors” [10] are the guides used in the UK to perform the calculations of the heat loss and surface temperature associated with this type of thermal bridges. According to these documents, when assessing heat loss, the frame does not need to be included in the model and can be substituted for an adiabatic surface [9]. The reason for this is that often in the first stages of the design, the window that will be used is not known.
Previous research by Sierra et al. [12] investigated the impact on the calculation of Ψlintel and surface
it. Additionally, the adiabatic surface can increase by over 3 °C the actual internal surface temperature of the junction, which agrees with the recommendation suggested by Ward [9] to include the window when calculating the temperature factor. Otherwise, if the junction is not assessed correctly, it could hide possible risks of condensation which may show up once the building is finished.
Finally, it is also necessary to point out that the location of the window needs to balance thermal performance with other factors, especially when moving the frame to internal positions. For instance, Bloom [18] pointed out that deep reveals provide shade when glazing is positioned internally, giving reductions in daylight and solar gains. Deeper locations could also generate buildability and structural issues when fixing the window, requiring casing [8]. The main reason behind the extended use of the position recommended by the Robust Details catalogue [5] is structural. It gives stability, when installing and using windows and additionally it facilitates the sealing of the opening for airtightness.
The purpose of this research was to investigate the impact of the location of the window in the reveal of a cavity wall on the Ψlintel to determine the most efficient position in terms of minimizing the heat
loss of the fabric. At the same time, the variation of the surface temperature was also studied. Finally, this research also analysed the effect of moving the adiabatic surface in the reveal of the opening on the Ψlintel and its internal surface temperature.
2 METHODOLOGY
2.1 Data collection and modelling assumptions.
A parametric analysis was carried out to find out how Ψlintel and the internal surface temperature change depending on whether an adiabatic surface or the actual window is included in the model when moving the location of the frame in the reveal of the wall. The frame was located from left to right in six different positions as seen in Fig. 1:
1. Aligned with the outer face of the façade.
2. Fixed into the external leaf and overlapping the cavity 30mm.
3. Fixed into the external leaf and overlapping the cavity 70mm.
4. Aligned with centre of the cavity.
5. Fixed into the inner leaf overlapping this leaf by 50mm.
[image:3.595.155.443.543.741.2] 6. Aligned with the inner face of the room.
Two construction details (Case1 and Case2) were set up under PARTL1A 2013 [13] standards, incorporating a 2 mm top hat steel lintel without base plate as shown in Fig. 2. The first case study is expected to be the common construction trend under PARTL1A 2013. The second case study covers an alternative solution to keep a 100 mm cavity size by adding 35 mm of internal insulation.
Fig. 2. Specifications of the construction details studied.
They were modelled using the software package HEAT2D [14], under steady state conditions to calculate heat loss and surface temperature when moving the frame of the window to six different positions.
Any piece of software to assess thermal bridges needs to be validated to assure the trustability and consistency of the output generated by their mathematical models. Once validated, it is possible to simulate new cases achieving accurate and trustable outputs. HEAT2D has been fully validated by Blomberg [14] against the proposed reference cases included in the ISO 10211 [15]. Furthermore, the software has been also validated to assess steel lintels, comparing the numerical calculation outputs against real data from physical measurement provided by Ward et al. [10].
In addition to using validated software, correct assumption and inputs need to be included in the case-specific model to generate correct results. For this purpose, the assumptions and inputs to set up the calculation of the thermal transmittance of the lintel area followed ISO 10211 [15], the surface resistances for the calculation of internal surface temperatures for the purposes of evaluating condensation risk were input in accordance with ISO 13788 [11] and the assumptions and inputs to set up the calculation of the thermal transmittance of the frame profile used in this research followed ISO 10077-2 [16].
is reduced, since the heat loss through this system is known and has already been validated. The process to validate the calculation of the thermal transmittance of the windows is shown in the next paragraphs following the steps outlined in ISO 10077-2 [16].
For each case study and each of the six frame locations, the window unit was replaced either by an adiabatic surface according to BRE IP 1/06 [9] and BR 497[10] or a detailed window was modelled according to ISO 10077-2 [16] taking into consideration the heat transfer coefficients of the frame and the glass and the linear heat transfer coefficients of the glazing spacer. In this way it is possible to compare the outputs of the simplified and detailed method. For each surface of every model a temperature and a resistance were assigned. Therefore, following ISO 10211 [15], external surface resistance had an Rso = 0.04 m2K/W, the internal surface resistance had an Rsi = 0.13 m2K/W on perpendicular surfaces to thermal flux and 0.10 m2K/W on parallel surfaces. Furthermore, a difference of temperatures was set up from internal Ti = 20C to external Te = 0C [10].
The window selected to carry out the detailed method is represented in Fig.3 and Fig.4. It features a softwood frame 83 mm wide by 110 mm long and λ = 0.13 W/mK with a double pane glass 205 mm long (4–20–4) and aluminium spacer (λ = 160 W/mK) with a cavity filled with silica gel (λ = 0.13 W/mK), and a primary seal of polysulphide (λ = 0.4 W/mK). Furthermore, ISO 10077-2 [16] assumes vertical orientation of frame sections and air cavities so Rsi = 0.13 m2K/W is applied when calculating the thermal performance of the frames for the internal surfaces. The same document also states, that in the case of reduced radiation/convection due to edges between two surfaces, such as the ones represented in red in Fig. 3 and Fig. 4 i.e. between the frame and glass, a RSI= 0.20 m2K/W needs to be applied.
The detailed model was assessed following three steps: The first step calculated the Uf of the window frame by using a 190 mm long calibration panel (λ = 0.035 W/mK) and Up = 1.03 W/m2K instead of the glass. The thermal transmittance of the frame was then calculated according to equation (3) [16]:
𝑈𝑓 =
(𝐿2𝐷−𝑈𝑝 ∙𝑙𝑝)
𝑙𝑓 (3)
Where Up is the thermal transmittance of the central area of the panel, expressed in W/m2·K (1.031); lf is the width of the frame section expressed in m (0.11); lp is the visible width of the panel, expressed in m (0.19).
[image:5.595.135.464.560.682.2]The thermal conductance of the model calculated was L2D = 6.759/20 = 0.3379 W/mK and Uf = (0.3379 – 1.031x0.19)/0.11 = 1.291 W/m2K.
Fig. 3. First step. Calculation of the Uf of the frame of the window.
In the second step the panel was replaced by the original glass and a simplified spacer was added. The Ψg of the glazing edge was calculated by subtracting the heat flow through the glass and the frame from the heat flow of the whole model according to the equation (4) [16]:
𝛹𝑔 = 𝐿2𝐷− 𝑈𝑓 ∙ 𝑙𝑓− 𝑈𝑔 ∙ 𝑙𝑔 (4)
Where Ug (1.03) is the thermal transmittance of the central area of the glass, expressed in W/m2·K; lg (0.19) is the visible width of the panel, expressed in m.
[image:6.595.121.476.221.347.2]The thermal conductance of the model calculated was L2D = 9.549/20 = 0.4774 W/mk and Ψg = (0.4774 – 1.291x0.11 – 1.305x0.19) = 0.087 W/mK.
Fig. 4. Second step. Calculation of the Ψg of the glazing edge.
Finally, the third step carried out the numerical analysis of the entire construction detail including the detailed window using HEAT2D. The Ψ-value of the thermal bridge was calculated by subtracting the heat flow through the wall, glass, frame and the glazing spacer from the heat flow of the whole model according to equation (5) [16]:
𝛹= 𝐿2𝐷− 𝑈
𝑤 ∙ 𝑙𝑤− 𝑈𝑓 ∙ 𝑙𝑓− 𝑈𝑔 ∙ 𝑙𝑔 − 𝛹𝑔 (5)
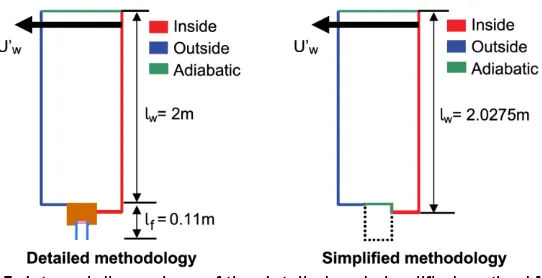
Where lw = 2 m in the detailed model. This is the dimension of the wall up to the window frame, measured from the inside, and expressed in metres as shown in Fig. 5.
Fig. 5. Internal dimensions of the detailed and simplified method [10].
On the other hand, the simplified model was also assessed using HEAT2D but replacing the window frame by an adiabatic boundary with zero heat flow according to Ward [9]. The Ψ-value of the thermal bridge is calculated by subtracting the heat flow through the wall, from the heat flow of the whole model according to the equation (6) [10]:
𝛹= 𝐿2𝐷− 𝑈
[image:6.595.163.434.512.651.2]For the simplified method lw = 2.0275 m, which corresponds with the dimension of the wall measured
up to the internal surface finish of the reveal of the opening underside the plasterboard [10] as shown in Fig. 5.
Therefore and based on the previous assumptions, 24 construction details were modelled in HEAT2D and a numerical analysis was carried out to obtain their corresponding Ψ-values and internal surface temperature in order to compare the outputs of two different calculation methods for six different positions using two different case studies.
3. RESULTS
The results are represented graphically in Fig. 6 ; Fig. 7 for comparison of the variation in Ψlintel and
[image:7.595.73.527.253.393.2]surface temperature depending on the location of the window and the method used when assessing both parameters for CASE1 and CASE2.
Fig. 6. Ψlintel for the detailed (red) and simplified method (black) depending on window location for CASE1 (left) and CASE2 (right)
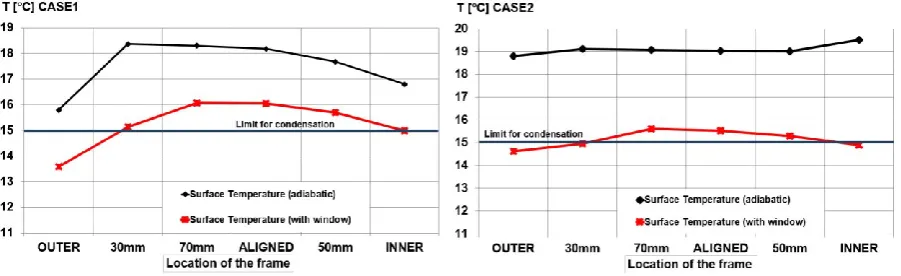
Fig. 7. Surface T for the detailed (red) and simplified method (black) depending on window location for CASE1 (left) and CASE2 (right)
The location of the window has a pronounced effect on the Ψlintel with differences up to 0.12 W/mK for
CASE1 and 0.077 W/mK for CASE2 between best and worst position. The larger values correspond to the outer locations and the lower to the inner ones for both cases. When calculating the heat loss the use of an adiabatic surface instead the detailed window reduces the Ψlintel for the two first and last
[image:7.595.74.525.439.577.2]The location of the window has a pronounced effect on the internal surface temperature for CASE1 with differences up to 2.5 °C and less pronounced for CASE2 with variations up to 1 °C. The larger variations correspond to the outer and inner locations, while for intermediate positions the temperature remains relatively stable. The use of an adiabatic surface has a higher effect in the case of the internal surface temperature in comparison with the Ψlintel, producing increases up to 3.2 °C for
CASE 1 (standard position) and 4.6 °C for CASE2 (inner position).
1. Ψ= 0.270 T= 15.78 C
2. Ψ= 0.201 T= 18.36 C
3. Ψ= 0.190 T= 18.30 C
4. Ψ= 0.181 T= 18.18 C
5. Ψ= 0.156 T= 17.67 C
[image:9.842.113.724.73.242.2]6. Ψ= 0.170 T= 16.8 C
Fig. 8. Variation of the distribution of isotherms when changing the window position for CASE 1 & simple method (adiabatic). Where T is the minimum internal surface temperature for each position of the window for CASE1.
1. Ψ= 0.276 T= 13.59C
2. Ψ= 0.215 T= 15.14C
3. Ψ= 0.188 T= 16.06C
4. Ψ= 0.175 T= 16.04C
5. Ψ= 0.153 T= 15.69C
6. Ψ= 0.190 T= 14.99C
[image:9.842.122.729.282.490.2]
1. Ψ= 0.115 T= 18.79 C
2. Ψ= 0.093 T= 19.11 C
3. Ψ= 0.082 T= 19.06 C
4. Ψ= 0.076 T= 19.03 C
5. Ψ=0.057 T= 19.01 C
[image:10.842.111.722.83.250.2]6. Ψ= 0.046 T= 19.50 C
Fig.10. Variation of the distribution of isotherms when changing the window position for CASE 2 & simple method (adiabatic). Where T is the minimum internal surface temperature for each position of the window for CASE2.
1. Ψ= 0.127 T= 14.62C
2. Ψ= 0.103 T= 14.96C
3. Ψ= 0.078 T= 15.61C
4. Ψ= 0.069 T= 15.52C
5. Ψ= 0.054 T= 15.30C
6. Ψ= 0.061 T= 14.90C
[image:10.842.121.727.294.491.2]4. DISCUSSION OF THE RESULTS
Based on the results shown in the previous section, it is possible to analyse the effect of the use of an adiabatic surface on the Ψlintel and internal surface temperature when moving the window frame in the reveal of the head of the opening.
In terms of Ψlintel [W/mK], the analysis of the outputs of the simplified method reveals that the location
of the window has an impact on the Ψlintel, in the same line of thoughts than [4]; [6]; [7] ; [8]. The
differences in heat loss are up to 0.12 W/mK for CASE1 and 0.077 W/mK for CASE2 between best and worst position. The larger values of the outer locations are due to the wider distance to the insulation layer in both cases. For CASE2 the decrease of the heat loss is continuous, when moving the frame to deeper positions in the reveal, due to the presence of a second insulation layer in the inner surface of the wall. Therefore, and in accordance with Roberts et al. [7] for thermal efficacy the frame should be aligned with the layer of lower conductivity in the wall.
The comparison between the outputs of the simplified method and the detailed one for the standard position reveals an increase of the heat loss of 7% for CASE1 and 11% for CASE2 (Fig. 6). When the adiabatic surface is located in the outer, standard or inner positions (1,2, 5 and 6 in Fig. 1), it covers a big portion of one of the two wings of the steel lintel. The adiabatic surface then acts for the software as a super-insulated material, not accounting the exchange of heat between the steel of the lintel (a highly conductive material) and the frame of the window. Therefore, for these locations the simplified method underestimates the heat losses that in reality happen.
The maximum difference between methods corresponds to the inner location (Fig. 6), and equals to 0.02 W/mK for CASE1 and 0.015 W/mK for CASE2, Although the absolute difference is bigger for the CASE1, the use of an adiabatic surface produces a larger relative percentage increase for the CASE2 (33%) in comparison with CASE 1 (12%), since CASE2 presents lower Ψ-values. Therefore, the lower are the Ψlintel, the more impact has the use of an adiabatic surface when calculating the heat loss and
less accurate are the outputs. This increase in heat loss for the inner position is not detected when an adiabatic surface is used for two reasons. Firstly, the inner steel wing is in direct contact with the internal environment. Therefore, for inner positions there is more heat exchange between frame and lintel than for outer positions. Secondly, the window is located between two insulation layers for CASE2 and position 6 (Fig. 1). Therefore, the heat will follow the frame-lintel connection, which in this case is the path of less resistance for the heat to escape. However, the presence of an adiabatic surface will encapsulate the lintel and the inner leaf of the wall between the cavity and internal wall insulation and a fictional super-insulated material, preventing any heat transfer between the lintel and the frame section. The detailed assessment demonstrates that, for CASE2 and position 6, the simplified method can underestimate heat losses up to 33%. Therefore, for internally insulated details the effect of the adiabatic surface cannot be neglected. For CASE1 this effect is softer due to the absence of inner wall insulation.
The current Ψlintel assessment method allows to not include the actual window for the assessment of
the head of the opening area [9]. At the time the document was published in 2006, the Ψ-values for this thermal bridge were large enough so that the inaccuracy of using an adiabatic surface did not have a big impact on the absolute and relative value of the heat loss due to this bridge. However, under the current trends of energy efficiency and with the “elemental recipe” proposed by PARTL 2013 [13] suggesting a Ψlintel = 0.050 W/mK for compliance, the use of the adiabatic surface could
during the assessment of both thermal performance and risk of condensation for top hat lintels without base plate.
It was also found that the location of the window has a pronounced effect on the other variable studied in the research for CASE1, the internal surface temperature, with differences up to 2.5 °C and less pronounced for CASE2 with variations up to 1 °C since the inner layer is insulated. The larger variations correspond to the outer and inner locations due to the wider distance to the middle insulation layer for CASE1 and only for the outer in the CASE2 due to the existence of the second inner insulation layer.
The use of an adiabatic surface has a higher effect in the case of the internal surface temperature in comparison with the Ψlintel, producing increases up to 3.2 °C for CASE 1 (standard position) and
4.6 °C for CASE2 (inner position). The reasons are similar to the ones presented before for the Ψlintel.
These results agree with the recommendation made by Ward [9] to include the frame when calculating the internal surface temperature. Otherwise, if the junction is not assessed correctly it could hide possible risks of condensation which may show up once the building is finished. In this way, Fig. 7 shows that the use of an adiabatic surface hides the existence of risk of condensation for outer, standard and inner positions (1, 2, and 6 in Fig. 1), showing greater internal temperatures than the actual ones.
Finally, the optimal position of the window should fulfil three requirements: Parallel isotherms to keep the continuity of the thermal envelope, low Ψ-values to reduce the heat loss and high surface temperature to avoid the risk of condensation. The distribution of the isotherms for each location reveals an area, from overlapping 70 mm the cavity to align with the insulation layer, where the isotherm became almost parallel. Additionally, it shows that the inner layer of the wall is kept warmer for the outer positions in comparison with the inner positions. In terms of heat loss, position 5 (Fig. 1) is the optimal followed by 4 and 3. However, these are un-usual positions for the window. The Energy Saving Trust [19] already suggested a similar location to 5 in an Enhanced Construction Detail [ECD] with internal insulation. Despite the good thermal performance of this detail, the buildability and airtightness problems that could produce [8] ; [20] made this detail not popular in the construction industry. In terms of lower condensation risk the optimal locations are 3 and 4 (Fig. 1). Based on the previous analysis, the optimal location will cover an area between overlapping 70 mm the cavity to align with the insulation layer of the cavity. Finally, the standard position (2) is a relatively less efficient and safe position if compared with 3 and 4, but with the advantage of being a much more robust detail.
When placing the window, the designer should try to align the frame with the insulation layer for continuity of the thermal envelope. However, in practice the decision about the location of the fenestration should be driven by other variables as well as the best thermal performance. Factors such as daylight distribution, solar gains, maintenance needs, water drainage in the sill area, thickness of the frame, buildability, airtightness, structural and aesthetic aspects also need to be taken into account [2] ; [18].
5. CONCLUSIONS
This paper has investigated the impact of the location of the window in the reveal of a cavity wall on the Ψlintel and surface temperature. Additionally, it has also studied the effect, on the accuracy of the
assessment of both parameters, of using an adiabatic surface instead of the actual window.
covering an area from overlapping the cavity 70 mm to aligned with the insulation of the cavity. Additionally, it also concludes that taking into account other factors, the current standard position is a relatively less efficient position, but more robust and buildable.
To date the profession uses an adiabatic surface to replace the actual window during the thermal assessment of the head of the openings. This prevents the software to account the heat transfer that in reality occurs between the window frame and the highly conductive steel lintel. Therefore, when the adiabatic surface covers big areas of the steel wings of the lintel such as the standard, outer or inner locations, the simplified assessment underestimates the heat losses. This is especially pronounced for internally insulated walls for which the simplified method underestimates the heat losses up to 33%.
It has also been demonstrated that the correct location of the window is vital to avoid condensation and that needs to be assessed including the actual window. Otherwise, the use of an adiabatic surface can increase the actual internal surface temperatures over 4 °C, hiding a possible risk of condensation.
In the past, when Ψ-values were greater, the impact of using an adiabatic surface was minimum. However, under current trends of energy efficiency, extremely low Ψlintel are achieved. This research
demonstrated that the use of the adiabatic surface could have a greater impact than before in the accuracy of the calculation of the heat loss. Under current PARTL 2013, differences of 7% to 11%, for the standard position when assessing the heat loss of common construction details, are large enough to start to think on the necessity of including the actual window during the assessment of thermal performance for top hat lintels without base plate.
6. ACKNOWLEDGEMENTS
This work couldn't have been done without the support of Professor Malcolm Bell. This work forms part of a project for which financial support was provided by the Knowledge Economy Skills Scholarships (KESS) from European Social Funds (ESF).
7. REFERENCES
[1] Energy Saving Trust. 2008. Enhanced Construction Details: Introduction and Use (CE297). London: EST.
[2] Maref, W. Van de Bossche. N; Armstrong, M. Lacasse, M.A. Elmahdy, H. Glazer, R. 2011.Laboratory Tests of Window-Wall Interface Details to Evaluate the Risk of Condensation on Windows. Journal of Testing and Evaluation, 39 (4), pp. 562-575. [3] Little, J. and Arregui, B. 2011. Thermal bridging- Understanding its critical role in energy efficiency. Construction Ireland, 5 (6), pp. 68-77.
[4] Misiopecki, C. Decheva, L. M. Jelle, B. P. Gustavsen, A. 2013. Practical Methods for Ensuring Energy-Efficient Window-to-Wall Connections. In: Proceedings of the 12th International Conference on Thermal Performance of the Exterior Envelopes of
Whole Buildings. Florida, 1-5 December 2013. ASHRAE.
[5] DTLR and DEFRA. 2001. Limiting thermal bridging and air leakage: Robust construction details for dwellings and similar
buildings. London: TSO.
[6] Cappelletti, F. Gasparella, A. Romagnoni, P. Baggio, P.2011. Analysis of the influence of installation thermal bridges on windows performance: The case of clay block walls. Energy and Buildings, 43 (6), pp. 1435-1442.
[7] Roberts, D. Bell, M. and Lowe, R., 2004. Evaluating the Impact of an Enhanced Energy Performance Standard on
Load-Bearing Masonry Domestic Construction – Report Number 2 – Design Process. PII Project CI 39/3/663. Leeds: Leeds
Metropolitan University Press.
[8] ZCH. 2013. Closing the gap between design and as-built performance new homes interim progress report. London: ZCH. [9] Ward, T. I. 2006. Assessing the Effects of Thermal Bridging at Junctions and Around Openings. BRE IP 1/06. Watford: BRE. [10] Ward, T. Hannah, G and Sanders, C. 2016. Conventions for Calculating Linear Thermal Transmittance and Temperature
Factors. BR 497. 2nd ed. Watford: BRE.
[11] BSI. 2012. ISO 13788:2012 "Hygrothermal performance of building components and building elements - Internal surface
temperature to avoid critical surface humidity and interstitial condensation - Calculation methods. London: BSI
[12] Sierra, F., Bai, J., Maksoud, T. 2015. Impact of the simplification of the methodology used to assess the thermal bridge of the head of an opening. Energy and Buildings, 87, pp. 342–347.
[13] DCLG. 2013. Approved Document L1A: Conservation of Fuel and Power in New Dwellings. London: DCLG [14] Blomberg, T. 1998. HEAT2. Lund: Lund University.
[15] BSI. 2007. ISO 10211:2007. Thermal bridges in building construction - heat flows and surface temperatures - detailed
calculations. London: BSI.
[16] BSI. 2012. ISO 10077-2:2012. Thermal Performance of Windows, Doors and Shutters. Calculation of Thermal
Transmittance—Part 2: Numerical method for frames. London: BSI.
[18] Bloom, M. 2011. Window form in deep walls. The effect on light and solar transmittance. Powys: CAT.
[19] Energy Saving Trust. 2011. Enhanced Construction Details: Thermal bridging and airtightness (CE302). London: EST. [20] Concrete Centre. 2014. Thermal performance: Part L1A 2013. Fabric and services options for energy and carbon