How to Reach a Compromise Solution on Technical
and Non-Structural Flood Control Measures
Pavel KOVÁŘ
1, Martin PELIKÁN
2, Darina HEŘMANOVSKÁ
1and Ivan VRANA
2 1Faculty of Environmental Sciences and 2Faculty of Economics and Management,Czech University of Life Sciences Prague, Prague, Czech Republic
Abstract
Kovář P., Pelikán M., Heřmanovská D., Vrana I. (2014): How to reach a compromise solution on technical and non-structural flood control measures. Soil & Water Res., 9: 143–152.
Harmful impacts of floods are the result of an interaction between extreme hydrological events and environmental, social, and economic processes. Flood management should consider many diverse aspects and influences and an integrated approach to flood management therefore plays an important role. In order to make an analysis and provide an adequate flood management, it is necessary to bring together a team comprising experts e.g. from the fields of hydrology and water resources, nature protection, risk management, human security, municipal administration, economics, and land use. Estimates by experts can serve finding solutions to given YES/NO problems, and estimating the value of specific attributes or parameters. It is not easy to adopt the solution which represents the best possible agreement among the participating experts, since experts and other participants can represent diverse standpoints. In particular, landowners and leaseholders upstream a catchment are often in a different position than the members of the municipal flood control committee downstream in a city with a high inhabitancy. In order to measure and evaluate the level of agreement between experts and landowners, a newly developed method for assessing the level of agreement and the τ-agreement value was applied. The aim of the present paper is to illustrate the use of a fuzzy-group-agreement decision-making procedure of this kind, involving a broad range of standpoints in a case study of the Zdravá Voda catchment, Žarošice, Czech Republic. This illustration has been made by comparison of hydrological model scenarios with the experts’ decision. The method used in the paper applied towards aggregating expert proposals expressed as fuzzy quantities to propose a binary solution to estimate a decisive parameter numerical value. The decision achieved for the Zdravá Voda catchment was that the efficiency of structural measures (polder) was superior over the non-structural measures (replacement of the arable land by grassland).
Keywords: agreement; averaging operator; consensus; environmental decision making; flood risk management; fuzzy uncertainty; multi-aspect decision
Floods caused by extreme hydrological events have environmental, social, and economic consequences. Flood protection is a topic, where it is difficult to adopt appropriate measures, because participants (either stakeholders or experts) in the decision making pro-cedure often advocate very divergent and sometimes even antagonistic opinions and standpoints. A detailed overview of classical averaging methods to process standpoints of experts is described in Vaníček et al. (2009). The major objective of the paper is to show, how a bearable solution can be reached in these situations, when classical approaches and methods (e.g.
The new approach is based on optimization of decision procedure which yields optimum decisions in the sense of minimizing entropy of input data (e.g. from stakeholders, experts, etc.). If participants in the decision making procedure hold similar standpoints, it is easy to find a solution and also to set parameters of such solution to fully satisfy all participants. For instance, if the value of some quantity should be selected (e.g. the amount of arable land reduction), the arithmetic mean or a median of participants’ proposals can be used. But there exist situations, when standpoints of participants might be opposing, which prevents using classical methods and still some solution/decision should be adopted. Finding flood prevention measures is a typical example of such a situation. The new method and operator MaxAgM has recently been developed for these situations, which brings the maximum possible agreement within all conflicting standpoints. The Zdravá Voda catchment case study shows how proper water management can resolve this problem.
MATERIAL AND METHODS
Case study catchment. The Zdravá Voda catch-ment is situated in South Moravia, Czech Republic, northwest of the village of Žarošice, the inhabited part of which is endangered by floods. The lower part of the Zdravá Voda catchment is periodically exposed to floods, which are mainly due to the soil low infiltration capacity of the catchment. The vil-lage of Žarošice was flooded on several occasions, causing major damage to land owners and to the surrounding infrastructures.
During the last several decades the Zdravá Voda catchment has suffered some disasters with high levels of damage due to flooding and soil erosion. Because the catchment is ungauged, the KINFIL model (Kovář et al. 2002) along with the “fuzzy consensus-based approach” (Vrana et al. 2012) have been used to set adequate prevention. Models of this kind are used to carry out analyses of flood events on small catchments, where both land use and management play a significant role, and where man-made interventions in land use can have a decisive influence on the design discharges. A combination of geographical information system (GIS) techniques with the KINFIL model, based on physical infiltra-tion and on kinematic wave transformainfiltra-tion of the overland flow, provides a tool for analyzing rainfall-runoff events, design discharge assessments, and flood scenario simulations.
This catchment has an annual average tempera-ture of 9°C and an annual average precipitation of 560 mm. The area is formed by loess and loess loam. The catchment area was surveyed and the resulting data were stored in GIS database. The area and other physiographic parameters of this subcatchment are presented in Tables 1 and 2. Soils are classified into hydrological soil groups with similar runoff poten-tial and land-cover conditions (NRCS 2007). Soils are classified into four groups (A, B, C, and D), the runoff potential of which ranges from low to high. The hydrological soil group in combination with the land use and land cover (treatment) determines the hydrological soil-cover complex, for which tables assigning CN have been prepared (NRCS 2004).
The map given in Figure 1 shows the runoff curve numbers (CN). CN (US SCS 1985; Ponce & Hawkins 1996) is an index which ranges theoretically from 0 to 100 (a larger CN indicates a greater runoff po-tential), although in practice usually 40 ≤ CN ≤ 98. The CN values represent the combined effect of soil type, land use, and land cover.
Table 1 shows that the main problem of the subcatch-ment is its extended area of arable land (77.0%), with a high CN value (78), which is usually a source area for a fast flow component instead of infiltration into the soil.
[image:2.595.305.531.493.580.2]Modelling flood transformation processes on the catchment. We applied a stepwise procedure of the
Table 1. Hydrological soil groups and curve numbers (CN) on the Zdravá Voda catchment
Land use A CN CN-final (ha) (%)
Arable land 14.14 77 78 60 Orchard (unmaintained) 3.43 19 55 11 Retention reservoir 0.84 4 61 2 In total 18.41 100.0 73
A – area of catchment with particular land use
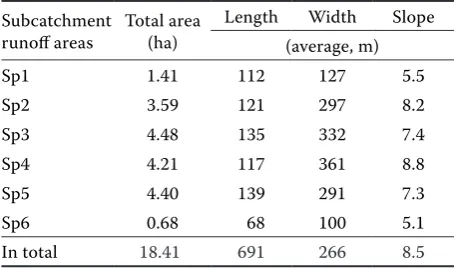
Table 2. Characteristics of the Zdravá Voda catchment
Subcatchment
runoff areas Total area(ha)
Length Width Slope
(average, m)
Sp1 1.41 112 127 5.5
Sp2 3.59 121 297 8.2
Sp3 4.48 135 332 7.4
Sp4 4.21 117 361 8.8
Sp5 4.40 139 291 7.3
Sp6 0.68 68 100 5.1
[image:2.595.304.533.624.758.2]flood transformation process in the catchment under investigation as shown in Figure 2 (steps 1–5). The transformation of the rainfall-runoff process depends on how much of the rainfall participates in overland flow (rainfall excess). Next, from step 6, the effect of non-structural and structural measures on the flood wave is assessed. The flow can be retarded by changing the land use in the catchment area which reduces the height of the flood wave. The impact of the direct flood wave can be reduced and the flood wave can be delayed by planning a properly land-scaped catchment area. Biotechnical improvement measures on a catchment represent the “hydraulic roughness”. The transformation process depends very much on proper implementation of measures of this type. Non-structural flood prevention measures of an agrobiological character and structural (technical) measures which include hydraulic structures (e.g. dikes and polders) are also found in Figure 2, together with necessary measures and proposed actions.
The decision-making procedure is done by a team of specialists from different fields. They consider ap-plications from structural and non-structural meas-ures. This group is supplemented by the stakeholders who have some relations to the land in the catchment (e.g. land owners, land users, municipalities, etc.). Their preferences are implemented by the aggregation method MaxAgM (Vrana et al. 2012). This method-ology is independent and neither directly connected with the KINFIL nor with other hydrological model.
The flood protection is a problem, which is in-fluenced by many factors and aspects. Therefore, a team of specialists participated in the decision-making process. Specialists in hydrology and water management, nature protection, risk management, land use, civil service administration, municipal administration, economics, as well as rescue team coordinators and land owners, were all invited to participate in the team of most important “stake-holders”. The team should be composed of so many participants to cover major expected standpoints. The method provides also possibility to weight the standpoints of individual participants e.g. accord-ing to their qualification, importance of their role, number of representatives for the given role, etc. Weighting should be used with care, because it is “socially” sensitive and it does not change the re-Figure 1. Runoff curve numbers (CN) in the Zdravá Voda
[image:3.595.306.532.80.486.2]subcatchment – polder
[image:3.595.67.290.82.327.2]sults overly. The bearable exception is weighting for reaching equal representation of individual roles, in order that each role had the same impact on the result regardless on the number of “actors” playing this role. Influence of this weighting is illustrated in the case study. For simplicity, we shall call all team members “participants”. Their task was to evaluate the existing situation and to propose the best (from their perspective) solution.
It was thus possible to determine the most appro-priate runoff transformation measures. The group of specialists made a comprehensive flood control evaluation. The steps in the procedure where the involvement of the team of specialists was most important is indicated in gray in Figure 2.
The flood impact mitigation procedure (2), as shown in Figure 2, was based on computing the design rainfalls for an N-year return period, which cause the design input discharges, and may ultimately result in flooding. A specialist in meteorology de-termined the relevant rainfall station (Kyjov) with N-year observations of the 1-day maximum rainfall, P1d,N , and further calculated for a short duration td as rainfall depth Pt,N for N = 10 and 100 years and td = 10, 20, 30, and 60 min (Table 3).
A functioning simulation model is very impor-tant, as indicated in step (3) – Figure 2. The KINFIL model was chosen as the most appropriate for this purpose (Kovář et al. 2002, 2012). KINFIL uses the physically-based infiltration theory (Morel-Seytoux & Verdin 1981; Morel-(Morel-Seytoux 1982) and is based on the CN values of the catchment as the main parameter. The model parameters correspond with CN (US SCS 1985, 1986). The CN values and the soil parameter relationships (e.g. saturated hydraulic conductivity Ks and sorptivity at field capacity Sf) were determined by correlating the design rainfall parameters in the Czech Republic (Kovář 1992).
These two parameter pairs, Ks – CN and Sf – CN, can be related as Ks= f1(CN) and Sf= f2(CN) when f1 and f2 are the relations dependant on the soil category. Their correspondences were tested (Brakensiek & Rawls 1981; Morel-Seytoux & Verdin 1981) and computed keeping the same methodology but for 62 rainfall data stations in the Czech Republic (Kovář 1992; Kovář et al. 2002; Kovar & Svitak 1994) for return periods 1 < N < 100 years to design rainfall durations 10 < t < 300 min. This synthetic event analysis has been prioritized over using the classic CN method (US SCS 1992). The runoff com-ponent of the model is expressed in the kinematic wave equation for catchments (Kibler & Woolhiser 1970; Singh 1996; Beven 2006) solved through the finite difference methods and the explicit numerical Lax-Wendroff scheme (Singh 1996).
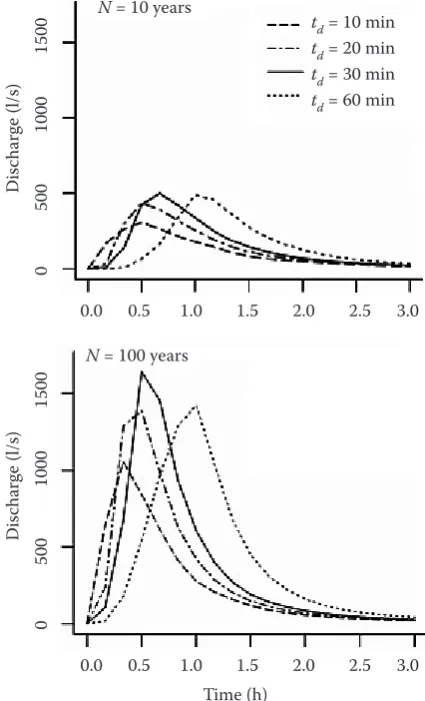
ArcInfo (GIS) was applied in action (4) – Figure 2, to assess the drainage pattern in the catchment (Table 2). Individual small subcatchments are thus replaced by a system of serial and parallel cascades of planes, arranged according to flow direction. This is an advan-tage of the KINFIL model. It features the geometric parameters of planes (length, width), slopes and CN values, as well as the flow pattern (fragmentation) system. The fragmentation subcatchment systems Sp1 to Sp6 are illustrated in Figure 1, respecting slopes and land use. All these parameters were used on the Zdrava Voda catchment, simulating design rainfall-runoff events for N = 10 and 100 years. The series of design hydrographs were computed in step (5) – Figure 2, in order to determine the corresponding design rainfall duration td = 10, 20, 30, and 60 min. The 30 min de-sign rainfall hydrographs were the highest and thus the most threatening. They are plotted in Figure 3.
[image:4.595.62.536.614.757.2]The (stakeholder/expert) group decision method. Distinguishing two types of flood prevention meas-ures for mitigating design discharges non-structural
Table 3. N-year design rainfalls at the Kyjov station (N = 10 and 100 years)
N
(years) Rainfall duration (min) Rainfall depth (mm)
Time step ∆t = 10 min
1 2 3 4 5 6
10 10 20.8 20.8 – – – – –
10 20 26.4 3.2 13.2 – – – –
10 30 30.3 10.2 10.1 10.1 – – –
10 60 36.2 6.1 6.1 6.0 6.0 6.0 6.0
100 10 36.1 36.1 – – – – –
100 20 46.8 23.4 23.4 – – – –
100 30 54.4 18.2 18.1 18.1 – – –
measures and technical measures, major CN pa-rameters in the KINFIL model can be effectively decreased through non-structural flood prevention, thus reducing/diminishing the peak flow. Arable land has usually a higher value of CN which signalises a higher flood risk for the stakeholders when they make decision (Arnette et al. 2010). The team comprised the following experts: two hydrologists and water management specialists, one nature pro-tection specialist, one risk management specialist, two land-use specialists, two representatives of the municipalities, one economist, and two landowners. The team consisted of a total of eleven members. According to Vrana et al. (2012), the specialists’ opinion can be expressed as a choice of any real number on the closed interval (Xmin, Xmax). Then, the formula for τ-agreement is
where
M – number of specialists
MaxAgM is defined as the value τ for which τ-agreement Agr(X|τ) reaches its maximum. Thus, this averaging operator represents a value τ for which the best collective agreement of all estimates is achieved. MaxAgM is the optimum operator for achieving the best agreement of expert opinions, because it corresponds to the highest τ-agreement value, and it is therefore superior to all other aver-aging operators.
MaxAgM provides an optimum solution in the sense of minimizing entropy and it is therefore su-perior to any other solutions (see Vrana et al. 2012 for details). The true wish (need) of all participants to find a solution (regardless of their standpoints) is the only requirement for application of this method. The good understanding of the method by the par-ticipants is important to correctly interpret the individual steps of the decision-making procedure. Such understanding can be achieved by a special-ized meeting of the participants. The objective of the paper is to show how to organize application of the MaxAgM method for the decision about flood protection measures. The whole procedure is il-lustrated by the presented case study in which a seminar was held with the participation of the above mentioned experts. The discussions were on flood prevention and evaluation methodology, and also on reading and interpreting hydrographs. In order to demonstrate the impact on flood prevention,
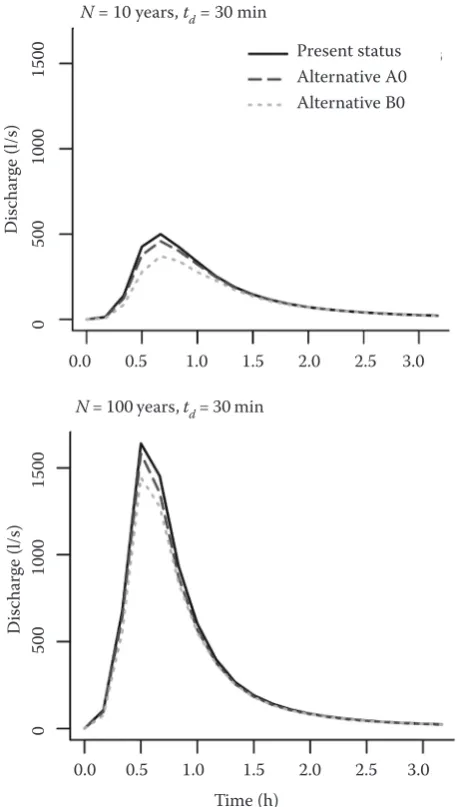
[image:5.595.307.520.360.711.2]the impact was pre-calculated for six pattern sce-narios (alternatives) combining partial (30%) or full (100%) replacement of arable land by permanent grassland, with structural measures (a polder versus a reservoir), as depicted in Table 4. Besides other information, all team members received design hydrographs, pre-calculated for time recurrence N = 10 and 100 years for non-structural scenarios A0 and B0, corresponding to a 30% and 100% reduc-tion of arable land (Figure 4). Hydrographs for two technical scenarios, one with a classic streamflow reservoir and one with a dry polder, were adopted after a decision on the percentage of arable land reduction had been made (Figure 5). According to these scenarios, the KINFIL model parameters were set up to simulate the individual scenario, taking into account the change in land use and the hydraulic parameters of the reservoir or polder. The changes in land use characterized by the different CN for the different scenarios are given in Table 5.
Figure 3. Design hydrographs of the subcatchment of the Zdravá Voda polder with return period N and various durations of rainfall td
Agr(X|τ) = 1 + 1
∑
M
log2
(
1 – |Xi –τ|)
M i=1 2dXDi
sc
har
ge (l/s)
Time (h)
0.0 0.5 1.0 1.5 2.0 2.5 3.0
0 500 1000 1500
N = 100 years
0.0 0.5 1.0 1.5 2.0 2.5 3.0
td= 10 min
td= 20 min
td= 30 min
td= 60 min
N = 10 years
Di
sc
har
ge (l/s)
RESULTS
At the seminar of experts, the hydrographs provided by experts with information on the impact of arable land reduction and on the impact of the selection of a reservoir or a polder (i.e. flood prevention measures) were given to the participants in the expert role to learn the Stakeholder Decision Method. The team members were aware of the necessity to take flood prevention measures, and all were given the same task: “Propose an appropriate replacement of arable land by grassland as a measure for mitigating the risk of flooding. Express your proposal as percentages between 0–100%, and indicate the recommended upper and lower limit for your proposal”. (This means that the specialists expressed their proposals as fuzzy num-bers with a triangular memnum-bership function.) Their proposals are presented in Table 6. The first column gives the experts’ specialization, the second column shows the position of the peak value of the triangular fuzzy number for the proposed arable land reduc-tion, and the third and the fourth columns show the deviation of the base of the triangular fuzzy number in both directions around the position of the peak value (e.g. values 40, 3, 6 indicate that the land use expert’s proposal is a triangular fuzzy number with a base of 37–46% and a peak at 40%). The rightmost column assigns weights to each expert’s opinion in the same order, and expresses a single overall weighting for each category of experts.
The expert proposals had to be aggregated in order to achieve a common standpoint, see e.g. Grabisch et al. (2011) for aggregation functions. These proposals put forward by the experts were aggregated by calculating the Maximum Agreement Mean – MaxAgM, a special averaging operator that maximizes the agreement in order to minimize the entropy of the common deci-sion. This optimum averaging operator generalizing
[image:6.595.66.533.100.229.2]consensus approach introduced by Tastle & Wier-man (2007) was developed and introduced in Vrana
Figure 4. Design hydrographs of scenarios A0 (−30% of ar-able land) and B0 (−100% of arar-able land) for return period N = 10 and 100 years and for time duration td = 30 min
Di
sc
har
ge (l/s)
Time (h)
0.0 0.5 1.0 1.5 2.0 2.5 3.0
0 500 1000 1500
N = 100 years, td = 30 min
0.0 0.5 1.0 1.5 2.0 2.5 3.0 Present status Alternative A0 Alternative B0
Di
sc
har
ge (l/s)
0 500 1000 1500
[image:6.595.303.532.305.709.2]N = 10 years, td = 30 min Table 4. Alternative for mitigating the flood impacts on the Zdravá Voda – polder subcatchment
Scenario description Non-structural measures (land use change) Technical measures reservoir polder
Present status no change no no
Alternative A0 −30% arable land no no
Alternative A1 −30% arable land yes no
Alternative A2 −30% arable land no yes
Alternative B0 −100% arable land no no
Alternative B1 −100% arable land yes no
Alternative B2 −100% arable land no yes
et al. (2012). (The word consensus is a concept widely used in information theory. It means the best possible agreement. But it can be substituted e.g. by the word “agreement”.)
The representation used in Table 6 shows the peak value of the triangular fuzzy quantity (column 2) and deviations from the peak value (columns 3 and 4). But also other representations are possible.
Vrana et al. (2012) also introduced MaxAgr soft-ware, which calculates MaxAgM from the specialists’ evaluations. In our case study, this software was used to aggregate the expert opinions from Table 6. It calculated the arable land reduction value for which Maximum Agreement is reached: MaxAgM = 75 (i.e. the optimum value of τ for which τ-agreement Agr(
X
|τ) reaches its maximum) and MaxAgr = 0.74. For each decisionsituation we also mention the value of median and arithmetic mean to see if they are similar or distant.
If the experts’ proposals were considered as crisp values (at the peak of their triangular membership functions, i.e. the second column in Table 7), we achieved MaxAgM = 75 with MaxAgr = 0.73, while median = 90 and arithmetic mean = 63.45.
[image:7.595.62.284.78.478.2]In non-weighted situations (i.e. when all participating experts have the same value of weight coefficient 1) of all crisp and fuzzy expert proposals, the maximum agreement 0.74–0.75 was achieved for a 75% reduction of arable land. This lies between median = 90% and arithmetic mean = 63.45%. We can see that the median and the arithmetic mean have very distant values in Table 5. Land use: curve number (CN) values for different alternatives on the Zdravá Voda – polder subcatchment
Scenario Land use Area (ha) CN (–) Total CN change
Present status
arable land 14.14 78
grassland – 69 orchard 3.43 55
polder area 0.84 61
in total 18.41 73.0 0
A0, A1, A2*
arable land 9.90 78
grassland 4.24 69
others (const.) 4.27 61
in total 18.41 72.0 –1
B0, B1, B2**
arable land 0.0 78
grassland 14.14 69
others (const.) 4.27 61
in total 18.41 67 –6
[image:7.595.306.532.114.325.2]*−30% arable land; **−100% arable land
Figure 5. Design discharges for C scenarios (C0: 75% re-duction of arable land, C1: reservoir transformation, C2: polder transformation)
Table 6. Experts’ proposals on replacing arable land (in %)
Expert of arable landReduction – +
Hydrology 100 15 0
Hydrology 90 10 10
Nature protection 90 5 5
Risk management 95 10 5
Economics 35 0 0
Land use 20 0 5
Land use 40 3 6
Municipality 98 5 2
Municipality 95 5 5
Land owner 35 2 2
Land owner 0 0 15
Di
sc
har
ge (l/s)
Time (h)
0.0 0.5 1.0 1.5 2.0 2.5 3.0
0 500 1000 1500
N = 100 years, td = 30 min
0.0 0.5 1.0 1.5 2.0 2.5 3.0
Di
sc
har
ge (l/s)
0 500 1000 1500
N = 10 years, td = 30 min
[image:7.595.305.533.576.757.2]our case, so these averaging operators provide only very inaccurate estimates of expert standpoints. A value of 75% was therefore adopted for the final cal-culation of CN (Table 7). It is clear that the proposed method provides much more accurate result than the classical median and arithmetic mean.
This measure decreased the peak flow, depending on the N-year input in the hydrograph. According to the acquired data, as indicated in Tables 4 and 7, arable land can be transferred to permanent grassland, with the effect of reducing the CN value and thus also the direct runoff (Woodward et al. 2003; Soulis et al. 2009).
The KINFIL parameters Ks and Sf were derived from the corresponding CN-values, which reflect the changes in the land-use scenario. The physiographic values (length, width, and slope) are identical. This land use transformation weighted the CN-value by 4 points. This is shown in Table 7.
Structural or technical flood prevention measures require major financial investments (see step (7) – Figure 2). Because the catchment includes areas which must be protected from floods (urbanized areas), structural measures seemed to be necessary. There were two basic options: (1) to construct a classical water reservoir for temporary storage in order to lower the level of the flood waves by means of a reservoir safety spillway, or (2) to build up a polder storage, with a similar water storage capacity as the reservoir, but with a much larger flooding area and a longer safety spillway (with doubled length). The second solution is both cheaper and closer to nature. Both options are based on a simple transformation procedure described by the continuity and momentum equations (i.e. safety
spillway). Figure 5 indicates measurements made by four design hydrographs for N = 10 and 100 years, each for rainfall duration td = 30 min (critical time), indicating the runoff from the Zdravá Voda catchment, with two scenarios of structural measures (C1 for a reservoir, and C2 for a polder) with a 75% reduction of arable land (scenario C0).
The team of experts provided answers to two ques-tions (answers that were important for decision about structural measures):
“Is it better to keep the current situation (with-out a structural change), or should structural flood prevention measures be implemented?” The answer to this question was unanimously YES to structural flood prevention measures.
“Which flood prevention measure is more ad-equate: a reservoir or a dry polder?” The answer to this question had to be formulated using linguistic terms according to the Likert scale: definitely res-ervoir (DR), rather resres-ervoir than polder (RtP), no preference (NP), rather polder than reservoir (PtR) or definitely polder (DP).
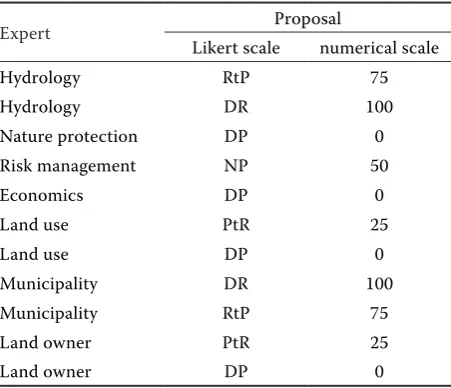
[image:8.595.305.531.528.722.2]The answers of the team members are presented in Table 8. They have been transformed to a numeri-cal snumeri-cale (0, 100), where 0 corresponds to DP, 25 to PtR, 50 to NP, 75 to RtP, and 100 to DR. With the use of MaxAgr software, a value of MaxAgM = 30 was calculated with MaxAgr = 0.71 and median = 25. The majority of the experts opted for the storage polder solution, choosing it as the most feasible op-tion, with least investment required. The area could
Table 7. Land use – curve number (CN) values for the best agreement of all experts, i.e. a 75% replacement of arable land by permanent grassland on the Zdravá Voda – polder subcatchment
Scenario Land use Area (ha) CN (–) Total CN change
Present status arable land 14.14 78
grassland – 69
orchard 3.43 55
polder area 0.84 61
in total 18.41 73 0
C0, C1, C2* arable land 3.54 78
grassland 10.60 69
others (const.) 4.27 61
in total 18.41 69 –4
*−75% arable land
Table 8. Experts’ proposals for building a reservoir or a dry polder
Expert Proposal
Likert scale numerical scale
Hydrology RtP 75
Hydrology DR 100
Nature protection DP 0
Risk management NP 50
Economics DP 0
Land use PtR 25
Land use DP 0
Municipality DR 100
Municipality RtP 75
Land owner PtR 25
Land owner DP 0
[image:8.595.61.290.580.742.2]be turned into permanent grassland. The result-ing inflow/outflow hydrographs for both structural measures were calculated for time recurrence N = 10 and 100 years and for CN = 69, which corresponds to a 75% reduction of the arable land. This final suggestion was indicated as scenario C, when C1 presents flood transformation by a reservoir and C2 presents flood transformation by a polder. The corresponding hydrographs for N = 10 and 100 years caused by the most critical design rainfall duration td = 30 min are depicted in Figure 5.
Flood wave reduction by means of a dry polder results in a lower flood peak with less investment costs. The polder flooded area is larger than the alternative reser-voir area, but with a smaller spillway, which is usually a more expensive hydraulic safety structure. Together with reduction in arable land, this proposal offers a solution which was confirmed by the best possible agreement among all experts involved in the project.
DISCUSSION AND CONCLUSION The aggregating approach, assuming general con-sensus among all experts, together with the aggrega-tion operator Maximum Agreement Mean MaxAgM, has been presented here. The results obtained by the new MaxAgM averaging operator can differ from results produced through common averaging operators. The value of MaxAgM falls in the interval between the arithmetic mean and the median.
If the experts’ conclusions were very similar, i.e. practically consensual, then averaging operators such as the median, the arithmetic mean or the maximum-agreement mean provide almost the same results and no more sophisticated method is needed. However, the median, the arithmetic mean may differ sig-nificantly when the specialists’ conclusions are very dissimilar (which is quite common in environmental projects). Then the aggregation operator Maximum Agreement Mean MaxAgM provides the only way to reach a widely acceptable solution. The method for calculating MaxAgM has an advantage over existing aggregating measures, since it directly calculates a value that corresponds to the best possible agree-ment among all involved experts.
The main advantage of the MaxAgM method is its usability when classical statistical methods fail. This happens if participants’ standpoints are very diverse, which results in a large distance between the arithmetic mean and a median of assessed quanti-ties in a decision situation. Moreover, the MaxAgM method always results in an optimum solution and it
is therefore superior to any other solutions. However, in the case of similar standpoints of participants, if the arithmetic mean and the median are very close, it is easier to use classical statistical methods, because the value of the MaxAgM falls between the arithmetic mean and the median.
In our case study the team of eleven experts and stakeholders comprised representatives from various professions, whose overall commitment was meeting the differing requirements of various stakeholders. It was therefore expected that the hydrological methods used in flood impact mitigation were set quite clearly. In other words, they had to be formulated in a way that would be generally understandable for both professionals and non-professionals. The evaluation by specialists was used for setting the parameter values (the CN value), and also for enabling binary YES/NO decisions whether or not to adopt proper structural measures. The experts answered in the form of fuzzy numbers as well as of crisp values.
The case study confirmed the usefulness of the group decision methodology. We can note that the classical aggregation measures differed significantly from MaxAgM (i.e. median = 90, MaxAgM = 75, arithmetic mean = 63.45 in our case).
A combination of the maximum-agreement-based method of multi-expert decision-making under fuzzy conditions and the application of MaxAgr software proved to be an acceptable solution and became an effective tool for solving any multi-dimensional environmental problems, which are ill-structured, uncertain, and vague, and where the standpoints of experts, especially experts from different fields, are not uniform but conflicting or even contradictory.
Acknowledgements. This project was supported by the Technology Agency of the Czech Republic, Project No. TA 02020402 “Water Regime Optimalization to Mitigate Impact on Hydrologic Extremes”.
References
Arnette A., Zobel C., Bosch D., Pease J., Metcalfe T. (2010): Stakeholder ranking of watershed goals with the vector analytic hierarchy process: Effects of participant grouping scenarios. Environmental Modelling & Soft-ware, 25: 1459–1469.
Bardossy A., Duckstein L., Bogardi J. (1993): Combina-tion of fuzzy number representing expert opinions. Fuzzy Sets and Systems, 57: 173–181.
Brakensiek D.L., Raws W. J. (1981): An infiltration based rainfall runoff model for SCS type II distribution. In: Winter Meeting ASAE. Palmer House, Chicago. Chen Z., Zhao L., Lee K. (2010): Environmental risk
as-sessment ofshore produced water discharges using a hybrid- fuzzy stochastic modelling approach. Environ-mental Modelling & Software, 25: 782–792.
de Roo A., Burek P., Gentile A., Udias A., Bouraoui F., Aloe A., Bianchi A., La Notte A., Kuik O., Tenreiro J.E., Vandecasteele I., Mubareka S., Baranzelli C., Van der Perk M., Lavalle C., Bidoglio G. (2012): A multi-criteria optimisation of scenarios for the protection of water resources in Europe. [Report ENR 25552 EN.] JRC Scientific and Policy Reports, JCR,Ispra.
Ferraro D.O. (2009): Fuzzy knowledge-based model for soil condition assessment in Argentinean cropping systems. Environmental Modelling & Software, 24: 359–370.
Grabisch M., Marichal J.-L., Mesiar R., Pap E. (2011): Aggregation functions: Means. Information Sciences,
181: 1–22.
Kibler D.F., Woolhiser D.A. (1970): The kinematic cas-cade as a hydrologic model. Hydrology Paper No. 39, Colorado State University, New York.
Kovář P. (1992): Possibilities to determine design dis-charges on small catchment using the KINFIL model. Vodohospodársky časopis, 40: 197–220. (in Czech) Kovar P., Svitak M. (1994): A possibility of modelling
direct runoff on small catchments using geographical information systems. Zeitschrift fuer Kulturtechnik und Landentwicklung,35: 345–357.
Kovář P., Cudlín P., Heřman M., Zemek F., Korytář M. (2002): Analysis of flood events on small river catchments using the KINFIL model. Journal of Hydrology and Hy-dromechanics, 50: 157–171.
Kovar P., Vassova D., Hrabalikova M., Vrana I. (2012): Stakeholders’ consensus on technical measures. In: Klijn F., Schweckendiek T. (eds): Comprehensive Flood Risk Management. Taylor and Francis Group, London. Morel-Seytoux H.J. (1982): Analytical results for
predic-tions of variable rainfall infiltration. Journal of Hydrology,
59: 209–230.
Morel-Seytoux H.J., Verdin J.P. (1981): Extension of the SCS rainfall runoff methodology for ungaged watersheds. [Report FHWA/RD-81/060.] US National Technical In-formation Service, Springfield.
NRCS (2004): Hydrologic soil-cover complexes. Chapter 9. In: National Engineering Handbook, Part 630 Hydrology. US Department of Agriculture, Washington, D.C. NRCS (2007): Hydrologic soil groups. Chapter 7. In:
Na-tional Engineering Handbook, Part 630 Hydrology. US Department of Agriculture, Washington, D.C.
Ponce V.M., Hawkins R.H. (1996): Runoff curve number: Has it reached maturity? Journal of Hydrologic Engineer-ing, 1: 11–19.
Refsgaard J.C., van der Sluijs J.P., Højberg A.L., Van-rolleghem P.A. (2007): Uncertainty in the environ-mental modelling process – A framework and guidance. Environmental Modelling & Software,22: 1543–1556. Singh V.P. (1996): Kinematic Wave Modelling in Water
Resources. John Wiley & Sons, Inc., New York.
Soulis K.X., Valintzas J.D., Dercas N., Londra P.A. (2009): Investigation of the direct runoff generation mechanism for the analysis of the SCS-CN method ap-plicability to a partial area experimental watershed. Hy-drology and Earth System Sciences, 13: 605–615. Tastle W.J., Wierman M.J. (2007): Consensus and
dis-sention. A measure of ordinal dispersion. International Journal of Approximating Reasoning, 45: 531–545. US SCS (1985): National Engineering Handbook, Section 4:
Hydrology. US Soil Conservation Service, USDA, Wash-ington, D.C.
US SCS (1986): Urban Hydrology for Small Watersheds. US Soil Conservation Service, USDA, Washington, D.C. US SCS (1992): Soil Conservation Program Methodology.
Chapter 6.12. Runoff Curve Numbers. US Soil Conserva-tion Service, USDA, Washington, D.C.
Vaníček J., Vrana I., Aly S. (2009): Fuzzy aggregation and averaging for group decision making: A generalization and survey. Knowledge-Based Systems, 22: 79–84. Vrana I., Vaníček J., Kovář P., Brožek J., Aly S. (2012):
A new fuzzy group agreement-based approach for mul-tiexpert decision making in environmental issues. Envi-ronmental Modelling & Software, 36: 99–110.
Woodward D.E., Hawkins R.H., Jiang R., Hjemflet A.J., Van Mullem J.A., Quan Q.D. (2003): Runoff curve number method: Examination of the initial abstraction ratio. In: Proc. World Water & Environmental Resources Congr. and Related Symposia, Denver, 1–10.
Received for publication February 5, 2014 Accepted after corrections April 16, 2014
Corresponding author: