DESKTOP GENERATED MICROPLANAR X-RAY BEAMS AND THEIR BIOLOGICAL EFFECTS
Soha Bazyar
A dissertation submitted to the faculty at the University of North Carolina at Chapel Hill in partial fulfillment of the requirements for the degree of doctor of philosophy in the joint
department of biomedical engineering in the North Carolina State University and the University of North Carolina at Chapel Hill.
Chapel Hill 2018
Approved By:
Yueh Z. Lee Otto Zhou David Lalush Joel E. Tepper Maureen Su
© 2018 Soha Bazyar
ALL RIGHTS RESERVED
ABSTRACT
Soha Bazyar: Desktop Generated Microplanar X-ray Beams and Their Biological Effects (Under the direction of Yueh Z. Lee)
Cancer affects 1 in 2 men and 1 in 3 women in the US and about half of all cancer patients receive some type of radiation therapy sometime during the course of their treatment. Normal tissue toxicity is the most important dose-limiting side effect of radiotherapy. This effect not only occurs after conventional broad beam radiotherapy (BB) but also following new radiation modalities namely, intensity modulated radiotherapy and proton therapy.
Microbeam radiotherapy (MRT) is a novel preclinical approach for radiotherapy, which delivers spatially fractionated submillimeter lines of the collimated quasi-parallel of a single high-dose (100Gy<) radiation (peaks), separated by wider nonirradiated regions (valleys).
Interestingly, the preclinical studies on animal models have consistently demonstrated the selective tumoricidal effect of MRT with the ability to even cure the aggressive orthotopic tumor models while sparing the normal tissue.
Most of the MRT studies have been conducted in spars synchrotron facilities around the world. To make this technology more available for preclinical biomedical studies and facilitate the translation of this promising modality to the clinic, here a desktop approach for applying MRT has been sought. My dissertation goal was to develop a more accessible microbeam approach, study its effectiveness and evaluate some of the hypothetical underlying radiobiological mechanism of the desktop MRT approach.
In this work, the effect of MRT and BB on normal mouse brain will be first evaluated using battery of neurocognitive tests, up to 8-months post irradiation. Next, a novel method for applying microbeams using an industrial cabinet animal irradiator will be introduced and a detailed description of its final characteristics will be given, including a comprehensive evaluation of the treatment geometry and a full-scale phantom-based quantification of its dosimetric output. Subsequently, the in vitro and in vivo efficacy of this new approach will be investigated. Later, the role of the acquired immune system will be evaluated in the tumor response after MRT. Finally, future project directions will be described briefly. Based on the results of this work, the author’s belief that our approach for applying MRT can be easily reproduced in other research facilities for radiobiological research and has definite clinical translation potential.
To my best friend and my husband Ali. I couldn’t have done this without you.
To my mentor Dr. Yueh Z. Lee who believed in me. Thank you for your endless support along the way.
ACKNOWLEDGMENTS:
First, I would like to thank my graduate advisors, Drs. Yueh Z. Lee, Otto Zhou, Joel E.
Tepper, Maureen Su and David Lalush. Without their inspiration, support and trust in me none of this work would have been possible.
Next, I would like to thank the entirety of the Zhou Group in the University of North Carolina at Chapel Hill (UNC-CH) Physics Department for their help during this project, in particular, Dr. Jianping Lu and Ms. Christina Inscoe. The foundations for this work is the groundbreaking research of those in this group that came before me, specially Drs. Michael John Hadsell, Lei Zhang and Pavel Chtcheprove. I am incredibly grateful for the opportunity to follow their leads.
I wish to acknowledge the support of different groups and people at the UNC-CH who contributed directly to my research: to Drs. Timothy E. O’Brien and Elaine M. Zeman for all of their support, kindness and devotion to my own education; to Drs. C. Ryan Miller and Robert S. McNeil at UNC Translational Neuro-oncology Laboratory and Dr. Pearl Bakhru at Su Lab for their generous help and guidance with the cells culture; to the Animal Histopathology &
Lab Medicine Core and Translational Pathology Laboratory staff for their help in preparing, scanning, and interpretation of the histology slides; to the Physics Shop and Makerspace staff for making the mouse holder, shielding and Barns Maze platforms; to the staff at the Division of Laboratory Animal Studies at Marsico Hall, Animal Studies Core and Tissue Culture Facility at Lineberger Comprehensive Cancer Center for their assistance throughout in vivo
studies; to Mark Bruckner at Environmental Health department for his collaboration during dosimetry evaluation.
I am so grateful of UNC-CH mouse behavioral phenotype core continuous support during neurocognitive studies.
I wish to acknowledge the great work of Drs. Otto Zhou and Sha Change for developing the 1st generation of carbon-nanotube based desktop mirobeam irradiator, US Patent No.:
US8,600,003B2, that was utilized during neurocognitive studies.
Finally, and most importantly, I would like to appreciate the continuous encourage and support of my family, to my parents, Aliasghar and Mansoureh Bazyar, who thought me the value of hard working and to my sister, Sahar, who showed me how to enjoy the most difficult moments, and to love of my life, my husband, Ali. Because of him I had the courage to apply for PhD in an engineering field. I am truly thankful of him for all sacrifices he made during our adventurous life journey.
TABLE OF CONTENTS
LIST OF FIGURES...xii
LIST OF TABLES ...xviii
LIST OF ABBREVIATIONS AND SYMBOLS ... xix
CHAPTER 1 INTRODUCTION... 1
1.1 Background: ... 1
1.2 What is MRT? ... 3
1.3 Synchrotron based MRT studies? ... 5
1.4 Constraints of synchrotron microbeam radiation therapy: ... 6
1.5 Aims: ... 7
CHAPTER 2 EVALUATING THE NORMAL TISSUE TOXICITY OF MICROBEAM RADIOTHERAPY IN THE BRIAN ... 9
2.1 Rationale: ... 9
2.2 Approach: ... 11
2.2.1 Animals: ... 11
2.2.2 Irradiation: ... 11
2.2.3 Neurocognitive Testing: ... 14
2.2.4 Immunohistochemistry: ... 18
2.2.5 Statistical Analysis: ... 20
2.3 Results: ... 21
2.4 Discussion: ... 24
CHAPTER 3 INVESTIGATING AN EFFICIENT AND FEASIBLE DESKTOP APPROACH TO EVALUATETHE TREATMENT
POTENCY OF MICROBEAM RADIOTHERAPY: A) DEVELOPING
A COLLIMATOR BASED MICROBEAM RADIOTHERAPY APPROACH ... 30
3.1 Rationale: ... 30
3.2 Approach: ... 31
3.2.1 Irradiation: ... 31
3.2.2 Collimation: ... 32
3.2.3 Dosimetry: ... 33
3.2.4 Immunohistochemistry: ... 35
3.3 Results: ... 36
3.4 Discussion: ... 39
CHAPTER 4 INVESTIGATING AN EFFICIENT AND FEASIBLE DESKTOP APPROACH TO EVALUATE THE TREATMENT POTENCY OF MICROBEAM RADIOTHERAPY: B) EVALUATING THE BIOLOGICAL EQUIVALENCE DOSE ... 44
4.1 Rationale: ... 44
4.2 Approach: ... 45
4.2.1 Cell Culture: ... 45
4.2.2 Clonogenic Assay: ... 45
4.2.3 Irradiation and Dosimetry: ... 47
4.2.4 In vivo Mouse Studies: ... 47
4.2.5 Acute Skin Injury: ... 48
4.3 Results: ... 49
4.3.1 Calculating in vitro dose equivalence between BB and MRT (clonogenic assays): ………49
4.3.2 Calculating in vivo dose equivalence between BB and MRT (acute skin reaction):………..……….49
4.4 Discussion: ... 51
CHAPTER 5 INVESTIGATING AN EFFICIENT AND FEASIBLE DESKTOP APPROACH TO EVALUATE
THE TREATMENT POTENCY OF MICROBEAM RADIOTHERAPY:
C) EVALUATING THE MICROBEAM TREATMENT EFFICACY ... 54
5.1 Rationale: ... 54
5.2 Approach: ... 55
5.2.1 Mouse Model: ... 55
5.2.2 Therapeutic Effect: ... 55
5.2.3 Irradiation: ... 55
5.2.4 Statistical Analysis: ... 55
5.3 Results: ... 56
5.4 Discussion: ... 57
CHAPTER 6 PRELIMINARY STUDIES INTO THE MECHANISM OF THE MICROBEAM RADIOTHERAPY EFFECT ON IMMUNE RESPONSE ... 59
6.1 Rationale: ... 59
6.1.1 Immune system: ... 59
6.1.2 Immune escape mechanisms of tumor: ... 67
6.1.3 Radiation therapy and the immune system:... 69
6.2 Approach: ... 73
6.2.1 Cell Culture: ... 73
6.2.2 Mice: ... 73
6.2.3 Tumor Treatments and Reagent: ... 73
6.2.4 Irradiation and Dosimetry: ... 74
6.2.5 Immunostaining of Tumor Sections: ... 74
6.2.6 Statistical Analysis: ... 77
6.3 Result: ... 77
6.3.1 Intact acquired immune system is required for
treatment response to MRT: ... 77
6.3.2 MRT induces more robust cytotoxic lymphocyte recruitment: ... 78
6.3.3 Cytotoxic T-cells play a crucial role in tumor response after MRT: ... 79
6.3.4 MRT alone does not elicit persistent anti-tumor response: ... 80
6.4 Discussion: ... 80
CHAPTER 7 LIMITATIONS, FUTURE DIRECTION AND CONTRIBUTION ... 82
7.1 Limitations and future researches: ... 82
7.2 Contribution to science: ... 86
APPENDIX 1. CONCURRENT MICROBEAM RADIATION THERAPY AND IMMUNE CHECKPOINT BLOCKER: INITIAL FEASIBILITY STUDIES ... 89
A1.1. Rationale: ... 89
A1.2. Approach: ... 91
A1.2.1. Cell Culture: ... 91
A1.2.2. Mice: ... 91
A1.2.3. Tumor Treatments and Reagent: ... 91
A1.2.4. Irradiation and Dosimetry: ... 92
A1.2.5. Statistical Analysis: ... 92
A1.3. Result: ... 93
A1.3.1. Microbeam radiotherapy is more effective than standard irradiation when combined with immune checkpoint blockers: ... 93
A1.3.2. Combined microbeam radiotherapy and immune checkpoint blockers induces anti-tumor memory: ... 93
A1.3.3. The anti-tumor memory is CD8 dependent: ... 94
A1.4. Discussion: ... 94
REFERENCE... 95
LIST OF FIGURES
Figure 1-1: Cancer statistics and facts... 1 Figure 1-2: The illustration of direct and indirect effect of ionizing radiation on DNA ... 1 Figure 1-3: The dose-response curve for the radiation therapy. ... 2 Figure 1-4: A: Cystic cavitation of tissue along the beam path;
B: Complete loss of cell bodies along the beam path while the normal tissue
has maintained its integrity. ... 3 Figure 1-5 Schematic picture of conventional broad beam radiation therapy (BB)
versus spatially fractionated microbeam radiation therapy (MRT).
In BB, a homogeneous single dose of irradiation is delivered to the target (top mouse and continuous line in the graph), while in MRT,
a single high dose of irradiation deposits in micrometer beams (peak) that are separated by non-irradiated regions (valley)
(bottom mouse and dashed line in the graph). ... 3 Figure 1-6: Effects of synchrotron MRT on rats bearing an orthotopic
9GLS tumor. Brain tumor growth control and increase in rat survival.
A: T2-weighted MR imaging follow-up illustrates the evolution of the lesion size: untreated (a–c) or treated by MRT (d–h).
B: Kaplan Meier curves showing the survival of 9LGS tumor bearing rats.
Untreated controls are represented in grey, while animals treated by MRT are plotted in black. MRT induced a significant increase in
the median survival time of animals (D65 versus D20, log rank test, p = 0.0003). ... 4 Figure 1-7: Cerebellum of a piglet ~15 months after irradiation
(skin entrance dose: 300 Gy), stained horizontal tissue section.
The tissue maintains its normal architecture. The thin white horizontal parallel stripes, clearly visible in the inset, correspond to the paths of
the microbeams; the beam spacing was ~210 µm. Two thick white horizontal
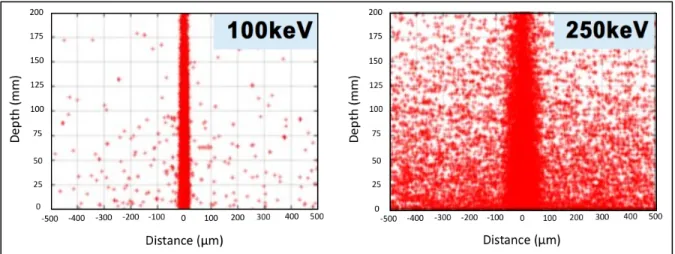
lines show the anteroposterior limits of the array of microplanes. ... 5 Figure 1-8: Increasing the X-ray mean energy markedly increases
the amount of energy deposits in valley area by scatter22. ... 7 Figure 2-1: CAD drawing showing the detailed configuration of the microbeam
radiation therapy system with the electron beam and X-ray beam indicated.
The X-ray beam is collimated by a microbeam collimator to 300µm beamwidth. ... 10 Figure 2-2: Image-guided Microbeam Radiotherapy Method Abstract.
A: Lateral radiograph of mouse head was taken to locate the bregma.
The head was stabilized using two ear-bars and teeth wire.
Embedded steel bead served as the fiducial marker. B: The skull
outlines were sketched over the same radiograph. The anatomical place of the hippocampus is shown regarding the bregma. D: Schematic lateral view of mouse skull with a cut along the corpus callosum at midline.
The gray lines demonstrate the two microbeams. In our device,
the microbeam planes intersect with the vertical plane at a slight angle of 8 degrees. The center of the treatment was placed 2mm posterior to the bregma (C) and 2.5mm inferior to the top of the skull.
E: The side (top) and top view (bottom) of a mouse under irradiation.
The head was fixed by ear bars and teeth wire. Gafromic EBT-3 film
was placed on top of the mouse head (entrance plan) to record the two beams
and generate the dose profile (F). ... 12 Figure 2-3: Broad-beam (BB) Irradiation Method Abstract. A: The schematic
picture demonstrates the steps to collimate down the beam to 2.5mm (D).
B: The fabricated collimator was placed in close contact with the mouse head.
C: The GafchromicTM EBT-3 film attached to fabricated collimator to
record the entrance dose (D) and generate the beam profile (E). ... 14 Figure 2-4: Comparison of Normal Mouse (top row) vs. Impaired One
(bottom row). The white dots are the position of mouse neck (junction of head and body) at each second during first 10 min of open-field activity test (superimposed scatter plots are generated using idTracker44). The impaired mouse spends more time at the periphery (A vs. B) and did less rearing (C vs. D) and buried fewer marbles after
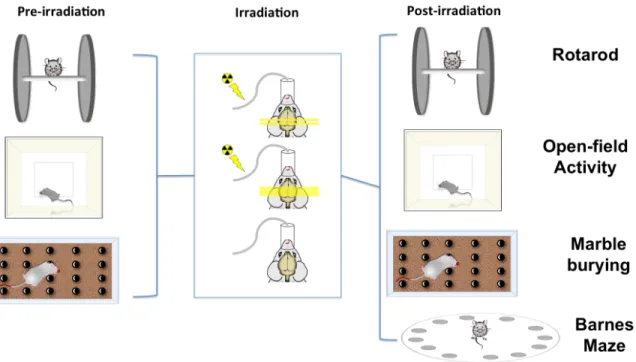
30min test (E top vs. bottom)... 16 Figure 2-5: Method Abstract. The mice were pre-evaluated using rotarod,
open-field activity and marble burying tests were randomly assigned to three treatment groups: broad beam (BB), microbeam radiotherapy (MRT) and controls. All mice were maintained under gaseous anesthesia for the equal duration of time. The post-irradiation evaluations were performed each month by rotarod, open-field activity and marble burying and 8-month after exposure Barnes maze test was used to evaluate the mice. All mice brains were sent
for histological assessments 9-month post-irradiation. ... 22 Figure 2-6: Predicted Mean of Mice Weight. The mice were weighed at
their arrival to the facility and each week after irradiation. The error bars are SD. ... 23 Figure 2-7: Picture of a BB-treated mouse head 6 months post-irradiation.
The arrow points to the circle of gray hair at irradiation site. ... 26 Figure 2-8: Top) H&E stain 4 months after 2 arrays of ≈40 Gy microbeam
radiation therapy. No significant change was detected in the field of radiation. Bottom) The basophilic areas demonstrate radionecrosis after
radiation with 40Gy72. ... 28
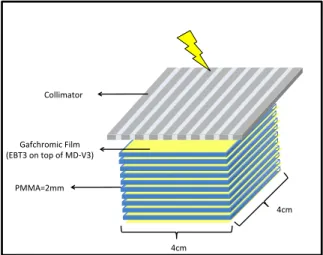
Figure 3-1: Microbeam Collimator A) The top view of the collimator;
B) The detailed layers of collimator (the picture is not drawn to scale). ... 32 Figure 3-2: Schematic picture of PMMA phantom used for dosimetry
evaluations. Eleven layers of Gafchromic EBT-3 and MD-V3 films were sandwiched with 10 pieces of PMMA sheets to measure MRT and CRT
behavior in depth. ... 34 Figure 3-3: A, B) The irradiator setting used for our studies. C) The simulated
X-ray spectrum. D) Intensity through different thickness of aluminum ... 35 Figure 3-4: The beam profile at the PMMA phantom entrance A) Gafchromic
film showing the beam pattern. B) A single beam pattern at y-direction:
the peak dose did not fall when the distance to the central axis increased.
C) The normalized beam profile in x-direction: homogeneous peaks and valleys. ... 37 Figure 3-5: The dosimetric characteristics of microbeams at different depth
of PMMA phantom. A) Percentage dose drop of peak, valley and integral dose vs. CRT; please note that all the dose values were normalized to the entrance dose in CRT and integral dose at the entrance plan in MRT. B) Dose drop of the PVDR at different depths, normalized to the entrance PVDR. C) Beams
pattern at different depth of PMMA phantom. ... 38 Figure 3-6: The spatial resolution of the MRT in phantom and mouse brain.
A layer of EBT3 (4×10 cm) was sandwiched between two layers of PMMA (2 mm each) and placed under the minibeam collimator (longest dimension along the beam), at 37 cm FSD (A,B). C) The mini-beam behavior in the film:
the peaks were distinguishable at 10 cm depth. D) γ-H2AX staining of the mouse brain, 6h post irradiation with 100 Gy MRT: the beam kept their
resolution deep in the tissue (D,E). ... 40 Figure 3-7: The three-channel calibration curve for Gafchromic™ MD-V3 and
EBT-3. EBT-3 is more sensitive in dose range ≤ 20 Gy, while MD-V3 can be
used for higher doses up to 100 Gy. ... 41 Figure 3-8: The major limitation in using industrial irradiators for applying
MRT and our approaches to minimize their effects. Our solutions to one limitation may also help with other one (dashed line) or worsen the effect
of another limitation (dotted line). ... 42 Figure 3-9: A) the comparison of the generated beam intensity between
a small (left) vs. large (right) focal spot irradiator; B) The comparison in generated beam profile deep in the tissue in small (left) or large
(middle and right) focal spot irradiator are used and the collimator is placed near the source (left and middle) vs. near the target (right); C) The equation demonstrates in large focal spot irradiators, penumbra has inverse
relation with the focal spot to surface distance; D) The schematic shows that by increasing the FSD, parallel septa in collimator can be used, and wider radiation field can be covered. The rectangle covers equal radiation field,
far or close to the source, trapezoid area contains beams with the same degrees. ... 43
Figure 4-1: The schematic beam profile, demonstrating the different dose component of MRT ... 44
Figure 4-2: Schematic Picture of the Clonogenic Assay protocol to investigate the in vitro effect of MRT on two murine cancer cell lines (B16-F10 and TRP). Left bottom, is a picture of irradiated cell culture flask with attached radiochromic film on the top. ... 46
Figure 4-3: The in vivo studies setting. A) For all experiments, the anesthetized mouse was fixed on an in-house mouse holder and all the body except irradiation field was covered with a 1cm lead. Note that the collimator is not shown all the way to the left to enable seeing the underneath shielding and mouse holder; B) The radiation field was 1.5cm×1.5cm to cover the entire mouse thigh; C) Two pieces of Gafchromic® MD-V2 films were placed at the entrance and exit plans for dosimetry purpose. ... 48
Figure 4-4: Cell Survival Curves. Surviving fraction vs. BB dose and MRT peak dose of two different murine cell lines (B16-F10 on the left and TRP on the right), evaluated using the clonogenic assay. ... 50
Figure 4-5: Normal Tissue Radiation Injury. The image on the left demonstrates a mouse with score 3 post-irradiation acute skin Injury. Mean score of acute skin injury up to 30 days post-irradiation with different MRT peak and BB peak doses (n=5 per group). Error bars are SEM. ... 51
Figure 5-1: The abstract methodology for evaluating the therapeutic efficacy of MRT ... 56
Figure 5-2: Mice treated for flank melanoma. Survival (A) and mean tumor volume ± SEM (B) without treatment or after either BB or MRT. P-value for survival is by log-rank. Shaded area in B demonstrates the time-points where the tumor volume between BB and MRT was statistically significant. ... 57
Figure 6-1: Hallmarks of cancer ... 60
Figure 6-2: Flowchart of immune system ... 61
Figure 6-3: The ontogeny of immune cells ... 63
Figure 6-4: Classes of MHC ... 64
Figure 6-5 Subsets of helper T-cells ... 66
Figure 6-6: Immune stimulatory effects of irradiation117 ... 70
Figure 6-7: Tumor model and experiment schedule. Immunocompetent or Rag1K0 mice were injected s.c. with syngeneic B16-F10 cells (8×10⁴) into the right thigh on day 0. On day 8, irradiation, either as MRT or BB, was given in a single dose locally, exclusively to the tumor inoculation site with the rest of the body shielded. Mouse anti-CD8a was given i.p on day -2, 0 and then twice a week as indicated. Tumor dimensions were
measured until the tumor volume reached 1.5 cm3 or day 60. The mice survived the primary challenge, were re-challenged by injecting the same number of the B16-F10 cells s.c. to the left thigh on day 60 and followed-up for the next 60 days. For histology studies, tumors were harvest 2 and 7 days
after irradiation... 75 Figure 6-8: The Kaplan-Meier curves (A,C,D) demonstrate the proportion of
the mice survived in various treatment groups at different time points after cell inoculation (Day 0); C) The treatment effect of the MRT was suppressed in the Rag- mice that lack acquired immune system (p<.001); D) MRT did not induce a significant difference in the overall survival of the Rag- mice compared to
the BB; B, E and F demonstrate the tumor volume at different time points after cell injection; E) The suppressive effect of MRT on tumor growth was diminished in the Rag- mice (p<.001); F) MRT did not significantly
hinder the tumor growth in Rag- mice vs. conventional irradiation. ... 78 Figure 6-9: Top) The histological section of mouse melanoma one week after,
mock irradiation (Sham), conventional irradiation (BB) or microbeam radiation therapy (MRT), stained for mouse CD8a.
It demonstrates the higher number of CTLs infiltration in MRT group.
The bars are 0.2mm. The graphs demonstrate the median number of CTLs, B-cells, Tregs and THs in three different study groups. MRT significantly increased the number of CTLs and B-cells infiltrations into the tumor
one week after irradiation. The number of Tregs was significantly suppressed
after MRT. The number of THs was statistically the same in treatment groups. ... 79 Figure 6-10: Kaplan-Meier curve demonstrates the survival of sham and
CD8 depleted mice after different treatment. ... 79 Figure 6-11: Left leg tumor volume in the re-challenged mouse.
MRT did not induce long term memory in this mouse. ... 80 Figure 7-1: A) The cross-beam pattern as used at synchrotron labs.
B,C) Hypothetical crossbeam application with the ring irradiator
for irradiating deep sited brain tumor. ... 84 Figure 7-2: The beam pattern of a prototype collimator with 150 µm beam
FWHM and center to center distance of 750 µm. The collimator was made
to be used under the industrial irradiator. ... 85 Figure A1-1: Mean survival curves created by weighted averaging of Kaplan–Meier
survival curves of melanoma patients treated in different clinical trials151. ... 89 Figure A1-2: Tumor model and experiment schedule. ... 92 Figure A1-3: The Kaplan-Meier curve demonstrates the survival in
different treatment group. Five out of ten mice that received combined
MRT+anti-CTLA-4 survived up to 90 days post tumor inoculation (log rank p<.001). ... 93 Figure A1-4: Mean tumor volume±SEM in second rechallenge test.
The tumor did not grow in the immunocompetent mice. ... 94
LIST OF TABLES
Table 2-1: Pre-irradiation Evaluation of the Mice in Three Groups. ... 21
Table 2-2: Post-irradiation Longitudinal Neurocognitive Evaluation ... 24
Table 3-1: Comparison of XRAD-320 vs. Xstrahl-300 ... 33
Table 3-2: Collimator Dosimetric Characteristics ... 36
Table 4-1: Radiation Therapy Oncology Group Scoring System for Acute Radiation Skin Injury ... 48
Table 4-2: In vitro Radiobiological Equivalent Dose. ... 50
Table 4-3: Calculated α and β values and goodness of fitted curve... 53
Table 6-1: Classes of human leukocyte antigens (HLA) ... 64
Table 6-2: Immune-evade mechanisms of cancer cells117 ... 68
Table A1-1: Efficacy and safety results from a phase III trial of anti-PD1 alone or combined with anti-CTLA-4 versus anti-CTLA-4 alone in treatment-naive patients with advanced melanoma157 ... 90
LIST OF ABBREVIATIONS AND SYMBOLS ANOVA = Analysis of Variance
APC = Antigen Presenting Cell
BB = Conventional Broad Beam Radiotherapy CNT = Carbon-nanotube X-ray Technology CRT = Conventional Radiation
CTL = Cytotoxic Lymphocyte
ED50 = Dose of a Treatment Observed to Yield Half-Maximal Efficacy FSD = Focus-Surface Distance
FWHM = Full Width Half Maximum HLA = Human Leukocyte Antigen HVLAl = Aluminum Half-Value-Layer
IACUC = Institutional Animal Care and Use Committee IF = Immunofluorescence
IMRT = Intensity Modulated Radiotherapy IP = Intraperitoneal
MHC = Major Histocompatibility Complex MRT = Microbeam Radiotherapy
NK cell = Natural Killer Cells PDD = Percentage Dose Drop PVDR = Peak-to-Valley Dose Ratio RBED = Radiobiological Equivalent Dose RT = Radiation Therapy
SF = Surviving Fraction SC = Subcutaneous TCR = T-cell Receptor
TD50 = Dose of a Treatment Observed to Yield Half-Maximal Toxicity.
TH = Helper T-cells Treg = Regulatory T-cell
UNC-CH = The University of North Carolina at Chapel Hill
CHAPTER 1 INTRODUCTION 1.1 Background:
Despite tremendous breakthrough discoveries in the field of cancer treatment during the last century, an estimated 1,735,350 new cases of cancer will be diagnosed and 609,640 people will die from this disease, in 2018 in US alone1 (Fig 1-1).
Approximately, 50 percent of all cancer patients will benefit from radiotherapy (RT) sometimes during their course of treatment2. Consequently, RT remains the most widely utilized treatment modality in the clinical management of cancer and any enhancement in the efficacy of this treatment modality will benefit a large number of patients. RT deposits significant energy in the target tissue, which damages the DNA of
cells either directly or indirectly through the formation of free radicals (Fig 1-2).
Cells whose DNA is damaged beyond repair stop dividing or die. Extensive studies pioneered by Bergonié and Tribondeau (1960) have shown that the Figure 1-1: Cancer
statistics and facts
Figure 1-2: The illustration of direct and indirect effect of ionizing radiation on DNA
most sensitive cells to RT are those that are undifferentiated, rapidly dividing and highly active metabolically. As a result, the cancer cells are more sensitive to the effects of RT.
Unfortunately, RT does not only destroy the cancer cells, but it may also damage the normal cells (Fig 1-3). Therefore, although increasing the dose of radiation increases the degree of tumor control, normal tissue toxicity becomes the major confounding limitation. The type, severity and clinical presentation of the toxic side
effects from RT depend on the area of the body being treated, the dose given per day, the total dose given, the patient’s general medical condition, and other treatments given at the same time. For instance, therapeutic doses of radiation to the brain almost always produces some level of side-effects, ranging from headache to cognitive dysfunction to frank brain necrosis.
During last few decade, efforts have been made to optimize the therapeutic index of RT (Fig 1-3). Temporal fractionation was one of the initial major advances in side effect reduction. It is based on the ability of normal tissue to repair sub-lethal damages between sequential treatments. Lately, modern technologies enabled the application of the more advanced modalities namely intensity modulated RT (IMRT), image guided RT and stereotactic RT, all of which have significantly reduced the dose derived to tumors adjacent tissue. However, most recent studies have demonstrated that even advanced modalities like IMRT and proton therapy can damage the healthy tissue 3. As a result, further improvements are needed.
Figure 1-3: The dose-response curve for the radiation therapy.
1.2 What is MRT?
More than 50 years ago, a study by Zeman et al. revealed a surprising fact that formed the principle idea of microbeam radiotherapy.
These researchers observed that the deposition of over 4000Gy by single-particle, high-energy beams of heavy ions over a 25µm path caused no tissue damage in mouse brain cortex. Radiating 1mm of the same tissue with
only 7% of this dose caused massive tissue necrosis (Fig 1-4)4. In 1992, researchers at Synchrotron Light Source of Brookhaven National Laboratory, Upton, NY exploited these Figure 1-5: A: Cystic cavitation of tissue along the beam path; B: Complete loss of cell bodies along the beam path while the normal tissue has maintained its integrity.
Figure 1-4: Schematic picture of conventional broad beam radiation therapy (BB) versus spatially fractionated microbeam radiation therapy (MRT). In BB, a homogeneous single dose of irradiation is delivered to the target (top mouse and continuous line in the graph), while in MRT, a single high dose of irradiation deposits in micrometer beams (peak) that are separated by non-irradiated regions (valley) (bottom mouse and dashed line in the graph).
findings and used a multi slit collimator to convert synchrotron light source to 25µm microbeam. They denominated this method “Microbeam radiation therapy” or MRT5.
In contrast to conventional radiation which delivers a spatially homogenous radiation dose to the target, MRT is an array of ultra-high dose (in magnitude of hundreds of Gy) of micrometer (under 1mm; usually <200µm) quasi-parallel beams, which generate ‘peaks’.
These beams are separated by wider not directly irradiated regions (two to four times wider than peak), referred to as ‘valley’ (Fig 1-5). Although in MRT most of the tissue that are placed in the valley area would only receive scattered dose, preclinical studies have consistently demonstrated that tumor control or cure can be achieved, even in radioresistant orthotopic murine models of cancers (Fig 1-6) 6–8.
Furthermore, the tolerance of normal tissues to this type of irradiation has been observed in several preclinical experiments. For instance, the tolerance of normal tissues to MRT was surprisingly high in the rat skin 9, fast-growing immature tissues such as the duck brain in ovo10, the chick chorioallantoic membrane 11, the cerebella of normal, suckling rat pups12, as well as adult rat and mouse brains6,13–15 and in normal weanling piglet cerebella16–18 (Fig 1-7).
Figure 1-6: Effects of synchrotron MRT on rats bearing an orthotopic 9GLS tumor. Brain tumor growth control and increase in rat survival. A: T2-weighted MR imaging follow-up illustrates the evolution of the lesion size: untreated (a–c) or treated by MRT (d–h). B: Kaplan Meier curves showing the survival of 9LGS tumor bearing rats. Untreated controls are represented in grey, while animals treated by MRT are plotted in black. MRT induced a significant increase in the median survival time of animals (D65 versus D20, log rank test, p=0.0003).
1.3 Synchrotron based MRT studies?
Since the 1990s, MRT has been vastly implemented and studied at third generation synchrotron sources mainly the European Synchrotron Radiation Facility (ESRF), in Grenoble, France. There are multiple technical reasons that make the synchrotron sources most suitable for applying microbeams:
1. The goal microbeam width during the synchrotron studies was typically less than 100µm. To maintain the beam separation of the microbeams deep in the tissue, orthovoltage X-ray energies are used instead
of megavoltage. As shown in Fig 1-8, at megavoltage energy the amount of energy deposition by secondary electrons is high, which would increase the valley dose and diminish the narrow penumbra of the beams. At kilovoltage energies, in conventional irradiators, X-ray production occurs through Bremsstrahlung radiation, resulting in more than 99% of the electrons depositing their energy as heat at the anode, which lowers the potential dose rate of conventional X-ray tubes. In synchrotron sources, X-ray is generated by inserting devices called wigglers into the electron beam storage ring that cause the electrons to oscillate under the influence of a varying magnetic field19,20. The output of these wigglers is typically a spectrum of X- rays that has a median and maximum energy of around 100keV and 600keV, Figure 1-7: Cerebellum of a piglet ~15 months after irradiation (skin entrance dose: 300 Gy), stained horizontal tissue section. The tissue maintains its normal architecture. The thin white horizontal parallel stripes, clearly visible in the inset, correspond to the paths of the microbeams; the beam spacing was ~210 µm.
Two thick white horizontal lines show the anteroposterior limits of the array of microplanes.
respectively21. All of the X-ray photons are compressed into a field with a tiny angle.
Consequently, synchrotron sources are able to generate orthovoltage X-ray beams at the rate of hundreds of Gy per second.
2. During the microbeam treatment, even a slight motion (mm or less), would smear the peak and valley doses. This problem would arise not only from the gross movement of the subject, but also due to physiological motion of the target tissue. For instance, even the brain experiences a few mm of motion under normal cardiac and respiratory pulsation. The ultra- high dose rate of synchrotron sources could limit the total duration of radiation and, consequently, the chance of motion.
3. Conventional irradiators, in contrast to synchrotron sources, generate divergent X-ray photons. Based upon the definition of MRT as quasi parallel micrometer X-ray beams, industrial irradiators are generally considered inappropriate source for applying MRT, unless significant collimation is applied, that further limits the dose rate.
1.4 Constraints of synchrotron microbeam radiation therapy:
As described previously, the use of synchrotron radiation to implement MRT is seemingly ideal, but it has also hindered the translation of this interesting modality to the clinic. Most of the studies of this novel modality have been limited to the four 3rd generation synchrotron laboratories around the world, and currently only two of them actively run microbeam studies.
The limited availability minimized the potential for other groups to replicate studies.
Furthermore, there are considerable cost and safety roadblocks to clinical implementation.
Methods for estimating absolute dosimetry are also limited, having been based almost entirely on simulation.
It has not been shown conclusively in radiobiological studies that the ultra-high dose rates at synchrotron sites are necessary for successful treatment. The high dose rate, although decreasing the chance of smearing of the beam at the fixed target, results in the potential for high dose deposition within the valleys and creating a homogenous radiation field after even a slight motion.
1.5 Aims:
To step beyond the limitations synchrotron sources introduced to the field, the overarching goal of my dissertation was to develop a compact MRT treatment approach to allow implementation in physical, radiobiological and preclinical research. The following are the crucial steps that will guide technical development and alongside these developments, facilitate the appropriate clinical application of MRT:
Figure 1-8: Increasing the X-ray mean energy markedly increases the amount of energy deposits in valley area by scatter22.
1. Evaluate the normal tissue toxicity of microbeam radiotherapy in the brain.
2. Investigate an efficient and feasible desktop approach to evaluate the treatment potency of microbeam radiotherapy.
a. Develop a collimator based microbeam radiotherapy approach for an industrial cabinet irradiator.
b. Evaluate the biological equivalence of MRT to BB in vitro and in vivo.
c. Evaluate the microbeam treatment efficacy in orthotopic melanoma mouse models 3. Preliminary studies into the mechanisms of the microbeam radiotherapy effect on immune response; including investigating the differential tumor response in intact vs. immune-deficient mouse models.
CHAPTER 2 EVALUATING THE NORMAL TISSUE TOXICITY OF MICROBEAM RADIOTHERAPY IN THE BRIAN
2.1 Rationale:
Annually, approximately 200,000 new cases of malignant brain tumors are diagnosed in the US alone23,24. RT has remained an important treatment modality for intracranial tumors despite the inevitable normal tissue toxicity. As a result, as treatment modalities have improved, patients live long enough to experience radiation-induced brain injury25,26. Accordingly, the American Cancer Society has stressed that future research should focus on reducing the complications of radiotherapy to maximize the quality of life for patients after treatment26.
Preclinical MRT has demonstrated the normal tissue sparing of this modality. However, most of these studies on the effect of MRT on normal brain tissue are focused on the short-term outcome after whole- or one-hemisphere-brain MRT27–29. Consequently, more recently, many groups, including Smyth et al., have emphasized the importance of evaluating chronic irradiation-induced changes by MRT treatment on a confined area of the brain30. Under current radiation approaches, acute (days to weeks after irradiation) and subacute (1–6 months post- irradiation) radiation-induced brain injuries are rare and reversible, while the delayed injuries (6 months to 1-year post-irradiation) are irreversible and progressive31. In addition, the volume of normal brain that is irradiated (the field size) is an important determinant of toxicity.
To make this technology more available for preclinical biomedical studies, the Chang and Zhou groups at UNC-CH have developed the first desktop MRT device based on the spatially distributed carbon nanotube X-ray technology (CNT)32, which enables delivering a high dose of radiation in a laboratory setting. This system uses multiple concurrently activated cold cathodes sources arranged in a line (Fig 2-
1). By distributing the electron beam along a very long and narrow line on the anode instead of a single point, significantly better heat dissipation and therefore, higher dose delivery rates can be achieved as compared to conventional point-focused X-ray tubes.
Furthermore, the radiation beam can be readily gated with physiological signals during irradiation 33. Previous studies found
that applying image-guided MRT using this desktop setting was able to induce tumor control in an intracranial murine tumor model, without causing any significant histological changes up to 30 days post-irradiation34,35. However, the histological evaluations indicated that BB might cause more normal brain tissue damage than MRT in later time-points34. Consequently, I hypothesized that applying image-guided MRT using this novel method would elicit less neurocognitive impairment than equivalent BB irradiation in long-term follow-up. Here, the goal was to evaluate the potential effects of MRT on normal brain tissue and compare it with conventional broad beam (BB) post-irradiation in acute, subacute and more importantly, the chronic time intervals.
Electron Beam
Fan Beam
Microbeam Beam
Figure 2-1: CAD drawing showing the detailed configuration of the microbeam radiation therapy system with the electron beam and X- ray beam indicated. The X-ray beam is collimated by a microbeam collimator to 300µm beamwidth.
2.2 Approach:
2.2.1 Animals:
Four-week-old male C57BL/6J mice (Jackson Laboratory, Bar Harbor, ME) were acquired and allowed to acclimate for a week before study initiation.
The mice were housed in the University of North Carolina at Chapel Hill (UNC-CH) Division of Laboratory Animal Medicine pathogen free designated environment and cared for in accordance with the United States Department of Health and Human Services Guide for the Care and Use of Laboratory Animals; all procedures were approved by UNC-CH Institutional Animal Care and Use Committee (IACUC). Mice were housed in a temperature and light- controlled environment with 12-h light/dark cycle (lights on at 7 AM) and provided food and water.
2.2.2 Irradiation:
Mice were randomly assigned to three treatment groups: microbeam radiotherapy (MRT), broad-beam radiotherapy (BB) and sham. All the mice underwent treatment at eight weeks old under anesthesia with 1%-2.5% isoflurane in medical-grade oxygen at 0.8-1 L/min flow rate.
All mice kept anesthetized for an equal duration of time (two hours) to normalize the influence of isoflurane on behavioral tests outcomes36,37.
2.2.2.1 Dosimetry:
GAFCHROMIC™ EBT3 (Ashland Advanced Materials, Covington, KY, US) film was placed at the dose entrance plane for dosimetry and evaluating the dose profiles. The key technical features of GAFCHROMIC™ EBT3 films that make them suitable for our purpose
included the minimal response difference over a wide photon energy range and high spatial resolution (25µm or higher)38. As a result, several MRT studies have used these radiochromic films for the dosimetry evaluations32,39,40.
The film was cross-calibrated to an ion chamber and scanned41,42. Scanned films were processed using in-house written Matlab script (R-2015a, The MathWorks, Inc, Natick, MA) using principles described by Borca et al43.
Figure 2-2: Image-guided Microbeam Radiotherapy Method Abstract. A: Lateral radiograph of mouse head was taken to locate the bregma. The head was stabilized using two ear-bars and teeth wire. Embedded steel bead served as the fiducial marker. B: The skull outlines were sketched over the same radiograph. The anatomical place of the hippocampus is shown regarding the bregma. D: Schematic lateral view of mouse skull with a cut along the corpus callosum at midline. The gray lines demonstrate the two microbeams. In our device, the microbeam planes intersect with the vertical plane at a slight angle of 8 degrees. The center of the treatment was placed 2mm posterior to the bregma (C) and 2.5mm inferior to the top of the skull. E: The side (top) and top view (bottom) of a mouse under irradiation. The head was fixed by ear bars and teeth wire. Gafromic EBT-3 film was placed on top of the mouse head (entrance plan) to record the two beams and generate the dose profile (F).
2.2.2.2 Microbeam Radiotherapy:
Image-guided MRT was applied on normal mice brains by desktop CNT-based MRT system41. Lateral X-ray projections were taken using onboard micro-CT scanner to locate the bregma (Fig 2-2a,b). An embedded steel bead (1/32 inch ≈ 0.8 mm) in the holder was used as the fiducial landmark (Fig 2-2a). Since the microbeam plane intersects with the vertical plane at a slight angle of 8 degrees (collimator angle)42, it was crucial to calculate the distance to the center of hippocampus from the registered images in both anterior-posterior and superior- inferior directions (Fig 2-2c,d).
After imaging, the mice were mechanically translated from the imaging to the irradiation position. Detailed descriptions of the device and dosimetry have been previously reported42. Two arrays of microbeams were delivered unidirectional along the coronal plane across each mouse brain (Fig 2-2e). Each microbeam was 300 µm wide, spaced at 900 µm center-to-center distance and the radiation field was centered on the hippocampus (2mm posterior and 2.5 mm inferior to bregma) (Fig 2-2c,d). The peak dose was 36 Gy and 5 Gy dose of X-ray was manually deposited in valley area (Fig 2-2f).
2.2.2.3 Broad-Beam Radiotherapy:
An industrial X-ray machine (X-RAD 320, PXi, North Branford, CT) was used for the BB irradiation. The dose rate, after 1.5 mm aluminum, 0.25 mm copper, plus 0.75mm tin filter, was 1.06 Gy/min at a focal surface distance of 47 cm (Fig 2-3a). For BB irradiation, the hippocampal area was irradiated with 10 Gy of X-ray over 2.5 mm irradiation field, creating an integrated equivalent dose to the MRT beams. The beam was collimated down to 10 mm wide using an industrial 4-leaf adjustable collimator (PXi, North Branford, CT) and then
further collimated to 2.5 mm using fabricated collimator out of 1.5 cm plates of lead (Fig 2- 3a,b). The setting applicability was pretested and the dose was measured using GAFCHROMIC™ EBT3 film (Fig 2-3c,d). During the experiment, the mice were positioned such that their heads were in close contact with the fabricated collimator and stabilized using ear bars and nose cone (Fig 2-3b). The collimator was placed 1 mm anterior to the interaural line to target hippocampus. The orientation of beam was same as MRT.
Figure 2-3: Broad-beam (BB) Irradiation Method Abstract. A: The schematic picture demonstrates the steps to collimate down the beam to 2.5mm (D). B: The fabricated collimator was placed in close contact with the mouse head. C: The GafchromicTM EBT-3 film attached to fabricated collimator to record the entrance dose (D) and generate the beam profile (E).
2.2.3 Neurocognitive Testing:
Mice were assessed using a battery of neurocognitive function tests at baseline and at each month after treatment and weighed using a scale with the accuracy of 10-1 grams weekly for the duration of the study. To minimize the effects of social influences on the behavior, mice were housed three in a cage, in each, there was one member of each group. All the experiments were performed between 9:00 am-3:00 pm during consecutive days of a week. The baseline
weight and measurements of rotarod, open-field, and marble burying were compared between treatment groups, to make sure no baseline difference existed among treatment groups. A pretest was performed during which mice were evaluated pre-treatment and every week up until one month and every month post-irradiation up until three months to evaluate the appropriate time point to perform the behavioral test.
2.2.3.1 Rotarod:
Mice were placed on a cylinder, which slowly accelerates to a constant rotating speed. While the heads of the mice are placed against the direction of the rotating rods, normal mice learn to walk forward as the rod rotating-speed increases. For each trial, revolutions per minute (rpm) were set at an initial value of 3 and progressively increased to a maximum of 30 rpm across 5 min. In all test sessions, the time latency before the mouse lost its balance was measured in seconds, up to maximum 300 sec.
2.2.3.1.1 Pre-treatment training:
An accelerating rotarod (Acceler. Rota-rod (Jones & Robertson) for mice, model 7650, Ugo Basile, Varese, Italy) was used for the acquisition of the task. For the first session, mice were given 3 trials, with 45 secs between each trial. A second test session with 2 trials was conducted 48 hours later, to evaluate consolidation of motor learning.
2.2.3.1.2 Post-treatment evaluation:
A similar accelerating rotarod was used for the re-evaluation of motor coordination. For each test, mice were given 2 trials, with 45 secs between each trial.
Figure 2-4: Comparison of Normal Mouse (top row) vs. Impaired One (bottom row). The white dots are the position of mouse neck (junction of head and body) at each second during first 10 min of open-field activity test (superimposed scatter plots are generated using idTracker44).
The impaired mouse spends more time at the periphery (A vs. B) and did less rearing (C vs. D) and buried fewer marbles after 30min test (E top vs. bottom).
2.2.3.2 Open-Field Activity:
Novel environment exploration, general locomotor activity, and anxiety-related behaviors in rodents were assessed systematically within a square 41 cm x 41 cm Plexiglas® box. Mice were filmed during the 30 min trial. Measures were taken of the number of the rearing events (frequency with which the mice stood on their hind legs) and duration of time they spend doing locomotion and in the central square (29 cm x 29 cm, 50% of field area) vs. periphery in both baseline and post-treatment assessments.
A high duration of locomotion behavior and time spent in the central square indicate increased exploration and a lower level of anxiety45. It had been shown that anxiolytics administration increases exploration time in the center of the open-field while stressful stimuli decrease the number of center visits (Fig 2-4.a-b)45. Open-field activity, therefore, represents
F
G
H
Control mouse
Disturbed mouse Locomo2on &
Center Rearing Marble Burying Barnes Maze
a valid measure of marked changes in “anxiety-like” behaviors46. In addition, rearing frequency corresponds with hippocampal electrical activity (Fig 2-4.c-d)47.
2.2.3.2.1 Pre-treatment:
Mice were assessed by 30 min trial in an open-field arena, crossed by a grid of photobeams.
Counts were taken of the number of photobeams broken during the half an hour trial either horizontally or vertically (VersaMax, AccuScan Instruments).
2.2.3.2.2 Post-treatment:
Mouse activity was recorded during 30 min experiment in the same size arena and assessed for the same parameters using different software (The Observer XT 10, Noldus Bv, Wageningen, The Netherlands).
2.2.3.3 Marble Burying:
Digging is a species-specific behavior of mice. It has been shown that hippocampal lesions markedly reduce the number of buried marbles to the point that cages of mice with hippocampal lesions appears to have had no mice in them at all (Fig 2-4.d)48. To quantify this behavior, twenty 9/16” (14.3mm) black glass marbles were placed in equally distance five row and four columns in a 28 x 17 x 10 cm clear plastic cage, two third of which was filled with bedding. The cages were covered thoroughly after putting the mice in them. The number of buried marbles was counted after 30 min. Buried marble was defined as the one that more than half of it was in the bedding.
2.2.3.4 Barnes Maze:
During the test, a mouse was placed at the center of a 92 cm circular table around which there were 20 holes each 5 cm along the edges. Animals escaped from a brightly lit open arena into a small basket located under one of the openings. The opening to place the basket under was assigned for each mouse randomly and remained the same all along the testing period. The Barnes Maze platform was made in-house using measurements from Sunyer et al. 49. Printed patterned papers were placed in different places in the room as spatial cues. Mice were tested for 7 consecutive days and measure was the duration of time before finding the right opening.
Each test session was up until they enter the escape box or up to 5 min. If mice were not able to find the correct opening during the test the period, they were gently directed toward it.
The mice were evaluated by the Barnes maze test 8-month post-irradiation (to measure chronic effect). At this time point, the open-field activity was not performed because both tests are based on the fear of isolation and being exposed in brightly lit areas. Running both test at the same time may desensitize the mice against the exposed environment, and as a result, may introduce bias.
2.2.4 Immunohistochemistry:
Brain tissues from the animal were collected at the end of the 3rd- (pretest group) and 9th- month post-treatment. Whole mouse brains were fixed in formalin for 48h, processed, embedded in paraffin, serially sectioned at the 5µm thickness and were used for IHC.
IHC was carried in Bond the fully automated immunostainer (Leica). Slides were dewaxed in Bond Dewax solution (AR9222) and hydrated in Bond Wash solution (AR9590).
Hematoxylin and Eosin (H&E) stain was done in the Autostainer XL (Leica Biosystems Inc., Vista, CA). For pretest mouse, In addition to H&E, following rabbit polyclonal antibodies were used: cleaved caspase-3 (cC3), #CP229C (Biocare Medical, Concord, CA), CD11b, #NB110- 89474 (Novus Biologicals, Littleton, CO), CD31, #ab28364 (Abcam, Cambridge, MA), GFAP, #Z0334 (Dako, Carpinteria, CA), Ki-67 #NCL-Ki67p (Leica Biosystems Inc., Vista, CA); Rabbit monoclonal anti-PCNA, clone EPR3821, #ab92552 was from Abcam (Cambridge, MA) and Rat monoclonal antibodies against F4/80 (#14-4801-82, clone bM8) and Myelin Basic Protein (MBP, #ab7349, clone 12) were from eBioscience (San Diego, CA) and Abcam (Cambridge, MA) respectively.
IHC and immunofluorescence were carried in Bond the fully automated immunostainer (Leica). Slides were dewaxed in Bond Dewax solution (AR9222) and hydrated in Bond Wash solution (AR9590). Antigen retrieval for all antibodies except cC3 was performed for 30 min at 100ºC in Bond-Epitope Retrieval solution1 pH-6.0 (AR9961) and in solution2 (pH9.0) for cC3.
After pretreatment slides were incubated for 30 min with PCNA (1:1000), CD11b (1:1500), GFAP (1:2500) and ki-67 (1:300) and for 60 min with cC3 (1:50), CD31 (1:200), F4/80 (1:50) and MBP (1:200). Detection of CD31, cC3, Ki-67, GDAP, CD11b and PCNA was performed using Bond™ Polymer Refine Detection system (DS9800). Detection of F4/80 was done using Bond Intense R Detection system (DS9263), supplemented with 1:500 Goat Anti-Rat (Biotin) secondary antibody (ab7096). Stained slides were dehydrated and coverslipped.
Immunofluorescent (IF) detection of MBP was done using Bond Intense R Detection kit (DS9263) supplemented with biotinylated Rabbit Anti-Rat Immunoglobulins (DAKO, E0468) and TSA-Cy3 (SAT704A001EA, Perkin Elmer) reagent; slides were counter-stained with
Hoechst 33258 (Invitrogen) and mounted with ProLong Gold antifade reagent (P36934, Life Technologies). Positive and negative controls (no primary antibody) were included for each antibody. H&E stained slides were digitally imaged in the Aperio ScanScope XT (Leica) using 20x objective. High-resolution acquisition (20x objective) of the IF slides (MBP) in the DAPI and Cy3 channels were performed in the Aperio ScanScope FL (Leica).
2.2.5 Statistical Analysis:
Statistical analysis was performed by SAS/STAT® version 9.4 (SAS Institute Inc., Cary, North Carolina). A p-value < 0.05 was considered statistically significant. The means of baseline values were compared using ANOVA to ensure there was no significant difference at baseline among treatment groups. A multilevel model, random coefficients approach was used to make inferences concerning treatment group differences. Random coefficient models allow simultaneous inferences at the aggregate and individual level while accounting for correlation between subjects that arises in longitudinal studies. These models are also more flexible than traditional ANOVA approaches because the constraint that each subject has the same regression coefficients is removed. Random coefficient models are also more powerful than standard cross-sectional methods with appropriate multiple comparison controls. For each outcome, the level 1 regression equation was found using the partial residual sum of square (PRESS) statistic under 5-fold cross-validation to determine the order of the polynomial fit.
Fitting the polynomial structure discovered using the above method; we chose the order of the random effects that would minimize BCC in the unconditional models while yielding nonzero covariance for the highest order term. Each random coefficient was modeled as a function of treatment group, engendering the level 2 regression equations. Interactions with
treatment group and time arising from the level 2 equations were assessed using type 3 tests and dropped where they were not significant. When the treatment group was found to predict linear or higher order slope terms, regions of significance were calculated. Tests of differences in treatment groups were conducted where the treatment group was found to predict intercepts only.
Table 2-1: Pre-irradiation Evaluation of the Mice in Three Groups.
Measurement P-value
Weight 0.576
Rotarod 0.365
Marble Burying 0.216
Open-field Activity
Rearing 0.332
Center 0.506
Locomotion 0.241
2.3 Results:
Fig 2-5 demonstrates a schematic flowchart of the current study. Mice were weighted and pre-evaluated using a series of cognitive tests and randomly assigned in three treatment groups (see pre-irradiation Fig 2-5). No significant differences were among MRT, BB, and shams in any of measurements at baseline (Table 2-1).
Mice brains in MRT and BB groups were irradiated with integrated equivalent dose (irradiation phase Fig 2-5). All mice in MRT and BB groups tolerated the irradiation procedures well, with
no specific veterinary concerns. Acute skin effects (erythema, desquamation, inflammation or epilation) were not detected in any mice after any irradiation approach.
Histological studies and pretest results (see Fig 2-8) demonstrated no measurable changes during the acute phase post-irradiation (up until one month) and as a result, the mice were evaluated every month post-irradiation using a battery of test in the current study as demonstrated in Fig 2-5, post-irradiation phase. The BB mice, whose brains were irradiated with homogeneous 10Gy of X-ray using a 2.5mm wide beam, tended to gain weight at a slower rate than MRT and non-irradiated mice. This difference became statistically significant between BB and controls since week 31 post-irradiation until the end of the experiment (week=42) (Fig 2-6).
Figure 2-5: Method Abstract. The mice were pre-evaluated using rotarod, open-field activity and marble burying tests were randomly assigned to three treatment groups: broad beam (BB), microbeam radiotherapy (MRT) and controls. All mice were maintained under gaseous anesthesia for the equal duration of time. The post-irradiation evaluations were performed each month by rotarod, open-field activity and marble burying and 8-month after exposure Barnes maze test was used to evaluate the mice. All mice brains were sent for histological assessments 9-month post-irradiation.
There was no difference in the duration of time mice kept their balance on the rotating rod, duration of rearing and duration of time mice spent in the central area of the open-field arena by treatment group (Table 2-2).
The number of the buried marbles in BB was significantly less than the control group and significantly less than the MRT group at all time points (p≤0.01) and BB mice spent less time searching around the open-field arena (p<0.001).
BB mice spent more time finding the correct hole in the Barnes maze test than shams in all test sessions (p=0.044). There were no differences between the MRT and shams for either of these outcomes.
Interestingly, at five-month post-irradiation, a depigmented line appeared in all BB mice at the site of irradiation (Fig 2-7) which progressed until 6th month and remained the same without any regression or progression for the duration of the study (up to 9-month post-irradiation). In two out of eight mice in MRT group, a line of gray hair appeared in the exit plan at the beginning of 8-
month after irradiation that stopped progression after 20 days and did not regress up to the end of study.
The brain tissues of the mice were collected 4 and 9 months post-treatment in pretest and test studies, respectively (Fig 2-5 histology). No histological changes were detected in any mice brain sample using IHC (Fig 2-8).
Figure 2-6: Predicted Mean of Mice Weight. The mice were weighed at their arrival to the facility and each week after irradiation. The error bars are SD.
Table 2-2: Post-irradiation Longitudinal Neurocognitive Evaluation
Behavioral Tests Group Difference* P-value
Rotarod MRT vs. Control vs. BB 0.520
Marble Burying
MRT-Control=0.0572 0.910
MRT-BB=1.410 0.011+
Control-BB=1.353 0.009+
Open-field Activity
Rearing MRT vs. Control vs. BB 0.180 Center MRT vs. Control vs. BB 0.510
Locomotion
MRT-Control=35.211 0.235
MRT-BB=120.50 0.0005+
Control-BB=85.291 0.005+
Barnes Maze
MRT-Control=3.549 0.861
MRT-BB=-36.298 0.085
Control-BB=-39.847 0.044+
*The difference between predicted means are reported when a test showed statistically significant difference among groups; +P-Value<0.05
2.4 Discussion:
Radiation-induced cognitive impairment is the most frequent complication among long-term cancer survivors and occurs in up to 50–90% of adult brain tumor patients who survive more than 6 months post fractionated partial or whole brain irradiation50–53. In spite of adequate disease control, cognitive impairment interferes with the patients’ ability to function at their
pretreatment levels. Multiple prior animal studies have reported that synchrotron MRT induces less neurotoxicity than conventional radiotherapy54,55. Here, I found that MRT using the first- generation CNT-based image-guided desktop microbeam irradiator would also cause less neurocognitive impairment than equivalent BB irradiation.
Local irradiation of hippocampal area with 10 Gy led to declined cognitive function in BB mice compared to sham (See Table 2-2). It has been found that 8-month after X-ray irradiation of mouse brain with 10 Gy, there was significant inhibition in neurogenesis level at hippocampus56. These may explain the decline in BB mice cognitive level in the current study at 8th-month post-irradiation measured using Barnes maze test.
Interestingly, no significant difference was found between MRT and shams at any time points post-irradiation. Different studies have reported that brain normal tissue can maintain its normal function and integrity at higher doses of X-ray in MRT than conventional radiotherapy methods. Four main mechanisms have been postulated to play a crucial role in keeping the normal tissue integrity after MRT. First, a “beneficial” bystander effect is hypothesized to facilitate the restoration of injured cells in central nervous system57. Second, due to the unique spatial distribution of X-ray in MRT, the total contact surface between highly irradiated and damaged tissue along the beam and minimally irradiated valley area is increased which may allow cells in the valley to maintain the function of the normal tissue. Third, multiple studies revealed that normal brain macro and microvasculature show higher tolerance to MRT and immature vessels like tumor neovascular are preferentially damaged by this method58. At last, recently, it has been shown that a spectrum of the immune response would be evoked after radiation therapy. Interestingly, studies have demonstrated that activated immune responses after MRT favor the tumor resolution while preserve the normal tissue function 59,60.
No acute skin effects were observed in any mouse after broad- or micro-beam radiotherapy.
In the current study, we observed the depigmentation hair circle in all BB-treated mice at the site of irradiation (Fig 2-7). Kinoshita et al. also observed the same effects when locally irradiated C57BL/J6 mice by a single fraction of 10 Gy61. Microbeam radiation therapy utilizes relatively low beam energies to
maintain the spatial fractionation deep in the tissue (an anode voltage energy of 160 kVp was used in the present study), which results in the lower dose penetration than the conventional radiotherapy. As a consequence, a significantly higher dose to the skin's surface needs to be applied during MRT to ensure an adequate dose delivery to the target tissue.
Paradoxically, in multiple microbeam
therapy studies higher than normal tolerance of normal skin tissue has been observed9,30. Interestingly, a line of gray hair appeared in two mice in MRT group at the exit plan 8-month after X-ray exposure. Previous studies have shown that skin effects are more severe at the joint places like axilla, groin and toes where the skin is subject to friction, or has folds in its surface62. Since this line coincides with the junction of mouse head and neck, we hypothesized that this effect may be due to the constant motion of these tissues with the associated inflammation.
Figure 2-7: Picture of a BB-treated mouse head 6 months post-irradiation. The arrow points to the circle of gray hair at irradiation site.
No significant histological differences were detected 4- and 9-month post-irradiation based on light microscopy level (Fig 2-8). While some hypothesized that neurocognitive changes may precede histological changes, a growing number of studies have correlated the radiation- induced cognitive deterioration to changes in the subcellular and molecular level of neuronal function and plasticity, particularly hippocampal long-term potentiation63. These changes can happen even after a modest dose of X-ray (2-10 Gy)64.
It is well established that the hippocampus plays a crucial role in learning and memory and its damage leads to various behavioral alterations including spatial learning impairment and disturbances in fear/anxiety responses65,66. Given these critical roles and the importance of hippocampal sparing radiotherapy in clinical applications67, I focused on the hippocampus as the target of the treatment and used a radiation field size to cover the whole mice hippocampus68. As a consequence, the chosen behavioral tests were focused on evaluating hippocampal-associated function.
Here, I mimicked clinical irradiation protocols, so I applied a local low X-ray dose that I knew would induce cognitive impairments69, but was well below the threshold for inducing obvious histological changes. Due to the distinct spatial fractionation of X-ray beam in MRT, finding the actual equivalence dose of MRT is complex. Previous studies have used different assumptions for the physical or biological equivalent dose60,70. Priyadarshika et al. suggested that the integrated dose of MRT, which is the microbeam dose averaged over the entire radiation volume, might be more relevant than the peak or valley dose when compared to broad-beam radiation71. In the previous study using the prototype of CNT-MRT irradiator, it has be found that 10Gy of the BB would induce same treatment efficacy as the integrated MRT dose34. Accordingly, here I also assumed that integral dose is close to actual equivalent dose,