• No results found

IMPROVING SIGNAL IDENTIFICATION FOR FAST-SCAN CYCLIC VOLTAMMETRY

N/A
N/A
Protected

Academic year: 2020

Share "IMPROVING SIGNAL IDENTIFICATION FOR FAST-SCAN CYCLIC VOLTAMMETRY "

Copied!
163
0
0

Loading.... (view fulltext now)

Full text

(1)

IMPROVING SIGNAL IDENTIFICATION FOR FAST-SCAN CYCLIC VOLTAMMETRY

Justin Allen Johnson

A dissertation submitted to the faculty at the University of North Carolina at Chapel Hill in partial fulfillment of the requirements for the degree of Doctor of Philosophy in the Department of Chemistry.

Chapel Hill 2017

Approved by:

R. Mark Wightman

James W. Jorgenson

Matthew R. Lockett

Regina M. Carelli

Paul B. Manis

(2)

 2017

(3)

ABSTRACT

Justin Allen Johnson: Improving Signal Identification for Fast-Scan Cyclic Voltammetry (Under the direction of R. Mark Wightman)

Fast-scan cyclic voltammetry (FSCV) is a powerful analytical tool for monitoring the in vivo concentration dynamics of electroactive neurotransmitters. Coupled with the use of microelectrodes, the approach allows for unsurpassed spatiotemporal resolution and is readily amendable to studies in freely moving animals. However, since its inception, the issue of selectivity has been of central concern. Correct identification and isolation of neurotransmitters signals is critical to interpretation of FSCV data, and much of the progress in the field has focused on methods of improving the ability to do this more robustly. Here, this work is expanded upon to both improve the use of existing methods (i.e. principal component

analysis-inverse least squares regression, or PCA-ILS) and introduce new tools (i.e. multivariate curve resolution, or MCR-ALS, and convolution-based removal of non-faradaic currents) for this purpose.

Chapter 1 presents the historical context of this work, highlighting the methods that have been

successfully developed and employed for isolating catecholamine signals. In Chapter 2, the evaluation of

the pitfalls of common methods of model training (i.e. the use of non-experimental training data) for PCA-

ILS is discussed, with focus on elucidating the source of errors that arise from this approach. To help

avoid these pitfalls, MCR-ALS, a method that does not require independent training data, characterized

for use with FSCV data as a possible alternative. Next, Chapters 4 and 5 focus on the introduction, and

exploration of the possibilities afforded by, the use of convolution to predict and remove non-faradaic

currents from FSCV data. Chapter 4 specifically focuses on optimization of this method and the removal

of ionic interferences from background-subtracted data collected with standard waveforms. Chapter 5

builds on this work to explore possible modifications to the experimental protocol (i.e. the use of high scan

rates and higher waveform holding potentials) that tailor to this convolution-based procedure, which

allows for the removal of the majority of the background current. The potential of this latter approach for

simultaneous monitoring of information about phasic and basal levels of dopamine is then evaluated.

(4)

ACKNOWLEDGEMENTS

I must start by thanking my advisor, Dr. R. Mark Wightman, for his mentorship throughout my time at graduate school. He has been an invaluable source of guidance, knowledge, and wisdom, and this work would not have been possible without his guiding hand and encouragement. I must also thank him for slogging through the (considerably longer) drafts of these chapters and for his continued patience while I (slowly) learn the art of ‘less is more’.

I must also thank those that contributed to the work presented in these chapters. First, I must acknowledge the assistance of my lab mate Nathan Rodeberg, who contributed to the work presented in Chapters 2, 3, and 5. He has been an excellent partner in conducting research, and I thank him for all the hours he has put in to helping this work become a reality. Additionally, I must acknowledge my

undergraduate, Josh Gray, who contributed to Chapter 3. He is an exceptional student, and I wish him the best of luck during his pursuit of a MD/PHD degree. Finally, I thank Caddy Hobbs, who contributed to Chapter 4, and who made my life as a TA considerably easier for a semester.

I also want to thank Dr. Elizabeth (Bucher) Schultze for showing me the ropes when I first joined

the Wightman lab. Additionally, I must thank my partner, Sara Turner, who has kept me level-headed

throughout the process of graduate school, and my parents, who have supported me in innumerous ways

in my pursuit of a scientific career since I was young. Finally, I thank my friends – in particular, Wesley

Storm, Chris Backlund, Douglas Kirkpatrick, Andrew Walden, and Javier Grajeda – who have made my

time here at graduate school considerably easier by their presence.

(5)

TABLE OF CONTENTS

LIST OF TABLES ... viii

LIST OF FIGURES ... ix

LIST OF ABBREVIATIONS AND SYMBOLS ... xi

CHAPTER 1: UNRAVELING VOLTAMMETRIC NEUROTRANSMITTER MEASUREMENTS ... 1

INTRODUCTION ... 1

EXPERIMENTAL APPROACHES TO DOPAMINE SIGNAL ISOLATION ... 2

CALIBRATION METHODOLOGIES ... 8

PRESENT LIMITATIONS IN QUANTITATING FSCV MEASUREMENTS ... 11

CONCLUSION ... 14

DISSERTATION OVERVIEW ... 15

REFERENCES ... 16

CHAPTER 2: FAILURE OF STANDARD TRAINING SETS IN THE ANALYSIS OF FAST-SCAN CYCLIC VOLTAMMETRY DATA ... 21

INTRODUCTION ... 21

THEORY ... 23

Calibration ... 23

Principal Component Regression... 28

RESULTS AND DISCUSSION... 36

Theoretical Failings of Standard Training Sets. ... 36

Concatenation of Training Sets from Multiple Animals. ... 40

Evaluation of ‘Library’ Approach to Generalized Training Set Generation. ... 42

CONCLUSIONS ... 46

METHODS ... 47

REFERENCES ... 48

(6)

CHAPTER 3: MULTIVARIATE CURVE RESOLUTION FOR SIGNAL ISOLATION

FROM FAST-SCAN CYCLIC VOLTAMMETRIC DATA ... 51

INTRODUCTION ... 51

EXPERIMENTAL SECTION ... 54

Instrumentation and Software. ... 54

Electrochemical Experiments. ... 54

In Vivo Measurements. ... 54

Data Analysis. ... 55

THEORY ... 55

Multivariate Curve Resolution-Alternating Least Squares. ... 55

Implementation of Soft Constraints Using Penalty Functions. ... 58

Methods for Selection of the Number of Components. ... 59

RESULTS AND DISCUSSION... 62

In Vitro Evaluation of Dopamine-pH Mixtures with MCR-ALS. ... 62

Evaluation of In Vivo FSCV Data. ... 70

Residual Analysis. ... 74

CONCLUSIONS ... 77

REFERENCES ... 79

CHAPTER 4: REMOVAL OF DIFFERENTIAL CAPACITIVE INTERFERENCES IN FAST-SCAN CYCLIC VOLTAMMETRY ... 84

INTRODUCTION ... 84

EXPERIMENTAL SECTION ... 86

Instrumentation and Software. ... 86

Electrochemical Experiments. ... 87

In Vivo Measurements. ... 88

(7)

Optimization and Validation of Convolution-Based Approach ... 105

CONCLUSIONS ... 110

REFERENCES ... 111

CHAPTER 5: MEASUREMENT OF PHASIC AND BASAL DOPAMINE CHANGES USING CONVOLUTION-BASED REMOVAL OF BACKGROUND CURRENT ... 115

INTRODUCTION ... 115

EXPERIMENTAL SECTION ... 117

Instrumentation and Software. ... 117

Electrochemical Experiments. ... 118

In Vivo Measurements. ... 118

RESULTS AND DISCUSSION... 119

Effect of Negative Holding Potentials. ... 119

Convolution-Based Removal of Divalent Cation Interferences. ... 121

Prediction of the Background Current. ... 124

In Vivo Measurement of Phasic and Basal Changes Dopamine Levels. ... 131

CONCLUSIONS ... 134

REFERENCES ... 135

APPENDIX 1.1: DESCRIPTION OF ERROR PROPAGATION ANALYSIS METHOD ... 137

REFERENCES ... 139

APPENDIX 2.1: MATHEMATICAL DESCRIPTION OF PRINCIPAL COMPONENT ANALYSIS ... 140

REFERENCES ... 143

APPENDIX 2.2: F-TEST FOR GLOBAL VS. SUBJECT-SPECIFIC MODEL COMPARISON ... 144

REFERENCES ... 145

APPENDIX 4.1: SIMULATION OF MODEL BACKGROUND CURRENTS ... 146

REFERENCES ... 150

(8)

LIST OF TABLES

Table 3.1. Rank estimated by Malinowski’s F-Test, orthogonal projection approach, ROD function, and the EFA approach for different simulated time separations of

dopamine and pH boluses ... 65 Table 3.2. Summary of comparison of PCA-ILS and MCR-ALS estimates of spectral

and concentration profiles for in vivo FSCV data collected during intracranial

self-stimulation trials (n = 25 rats) ... 73 Table 3.3. Percent difference between Q

α

values determined from Malinowski’s F-test

analysis of independently collected training set (10 CVs x 1) and experimental data (50 CVs x 6) for 25 intracranial self-stimulation data sets and relative standard deviation

of the latter. ... 75

(9)

LIST OF FIGURES

Figure 1.1. Comparison of voltammetric measurements of ascorbic acid (AA), 3,4-dihydroxyphenylacetic acid (DOPAC), and dopamine (DA) at carbon-fiber

microelectrodes. ... 4

Figure 1.2. Concentration error estimation for PCA-ILS analysis of a representative FSCV recording. ... 12

Figure 2.1. Representative in vivo electrochemical recording showing dopamine and pH changes. ... 25

Figure 2.2. The generation of principal components. ... 27

Figure 2.3. The scoring process of principal component analysis. ... 29

Figure 2.4. Construction of PCR model estimate for a dopamine cyclic voltammogram... 31

Figure 2.5. Use of the p vectors in the calculation of analyte concentrations. ... 34

Figure 2.6. Errors in the use of non-experimental training sets. ... 38

Figure 2.7. Model parameters of interest for concatenated training sets. ... 39

Figure 2.8. Results of F-test comparing models with subject-specific or global parameters for Equation 2.7 for concatenated training sets ... 41

Figure 2.9. Summary of ‘library’ approach to generate randomized standard training sets. ... 43

Figure 2.10. Average k

j

vectors for models built using training sets (n = 10 CVs, 5 per analyte) generated by a randomized ‘library’ approach from training sets collected within different subjects and using different carbon electrodes. ... 44

Figure 3.1. Graphical representation of the bilinear calibration model (Equation 3.1) with FSCV data. ... 56

Figure 3.2. Evaluation of color plot with orthogonal projection approach (OPA) and evolving factor analysis (EFA). ... 61

Figure 3.3. Results of unconstrained MCR-ALS analysis of FSCV data from a flow-injection analysis of a bolus of dopamine. ... 63

Figure 3.4. Effect of the weighting parameter w on the MCR-ALS fits to isolated injections of dopamine and pH. ... 67

Figure 3.5. Successive fitting using P-ALS ‘soft’ equality constraints for analysis of simulated in vitro dopamine-pH mixtures ... 69

Figure 3.6. Spectral fits for MCR-ALS analysis of increasing numbers of electrically evoked dopamine transients. ... 71

Figure 3.7. Interferent identification using MCR-ALS. ... 76

Figure 4.1. FSCV signals in the absence of analytes and during ionic concentration

changes in phosphate-buffered saline. ... 89

(10)

Figure 4.2. Background-subtracted FSCV signals for Na

+

and Ca

2+

concentration

changes in phosphate-buffered saline ... 90

Figure 4.3. FSCV signals seen during ionic concentration changes in TRIS buffer. ... 93

Figure 4.4. Convolution-based approach for removal of ionic artifacts. ... 95

Figure 4.5. Removal of artifacts arising from Na

+

concentration changes in TRIS buffer. ... 97

Figure 4.6. In vivo analysis of supraphysiological release of neurotransmitters during a spreading depression event using the convolution-based method. ... 99

Figure 4.7. Background-subtracted FSCV signals for dopamine concentration changes in PBS and TRIS buffer. ... 100

Figure 4.8. Convolution-based correction of flow-cell analysis of dopamine in PBS buffer. ... 101

Figure 4.9. Results of one-phase exponential decay fit to current response to 40 mV voltage step at carbon-fiber microelectrode. ... 103

Figure 4.10. Voltage-dependent psuedocapacitance determined from small amplitude CVs. ... 104

Figure 4.11. Power spectra for a triangular voltage wave and a typical impulse response estimation .... 106

Figure 4.12. Effect of step size on prediction for different voltage step amplitudes ... 107

Figure 4.13. Comparison of convolution-based and PCR –only removal of ionic artifacts. ... 109

Figure 5.1. Effects of negative holding potentials. ... 120

Figure 5.2. Sensitivity testing after tyramine fouling and treatment with waveforms with differing holding potentials. ... 122

Figure 5.3. Removal of ionic artifacts seen during flow-injection analysis of magnesium in TRIS buffer. ... 123

Figure 5.4. Evaluation of T-650 PAN-type and P-55 pitch-type carbon fibers. ... 126

Figure 5.5. Prediction and removal of background currents using 0.0 V holding potential. ... 127

Figure 5.6. Use of high scan rates for detection of dopamine ... 130

Figure 5.7. In vivo measurement of phasic and basal dopamine changes after cocaine administration ... 132

Figure A4-1.1. Model-simulated voltammetric currents for the components of the

carbon-fiber double layer. ... 149

(11)

LIST OF ABBREVIATIONS AND SYMBOLS

* probability less than 0.05

** probability less than 0.01

*** probability less than 0.001 [X] concentration of analyte X

C degrees Celsius

AA ascorbic acid

Ag/AgCl silver/silver chloride

C concentration matrix

CaCl

2

calcium chloride

CV cyclic voltammogram

D experimental data matrix

DA dopamine

DOPAC 3,4-dihydroxyphenylacetic acid

DV dorsal-ventral

E error matrix

E

app

applied potential EFA evolving factor analysis FFT fast Fourier transform FSCV fast-scan cyclic voltammetry

FSCAV fast-scan controlled adsorption voltammetry

g grams

HCl hydrogen chloride H

2

O

2

hydrogen peroxide

HDCV High-Definition Cyclic Voltammetry

Hz Hertz

i.p. intraperitoneal injection

KCl potassium chloride

(12)

kg kilograms

L liters

A microamperes

m micrometer

M micromolar

mA milliamperes

MCR-ALS multivariate curve resolution-alternating least squares

mg milligrams

MgCl

2

magnesium chloride

ML medial-lateral

mL milliliters

mm millimeter

mM millimolar

ms millisecond

n number of samples

N

2

molecular nitrogen

nA nanoamperes

nM nanomolar

NaCl sodium chloride

NaH

2

PO

4

monosodium phosphate NaHCO

3

sodium bicarbonate NaOH sodium hydroxide NaSO

4

sodium sulfate

NE norepinephrine

(13)

PC principal component

PCA-ILS principal component analysis-inverse least-squares regression PCR principal component regression

PLS partial least squares R

2

coefficient of determination

σ standard deviation

s second

S spectral matrix

S.E.M. standard error of the mean

t time

TRIS tris(hydroxymethyl)aminomethane TTL transistor-transistor logic

UEI universal electrochemical instrument UNC University of North Carolina at Chapel Hill

V volts

(14)

CHAPTER 1: UNRAVELING VOLTAMMETRIC NEUROTRANSMITTER MEASUREMENTS

INTRODUCTION

Neurotransmission is a multifaceted phenomenon, relying on both electrical and chemical impulses for information propagation and processing throughout the nervous system. In its most basic form, neurons act as the central units of this transmission. Control of their transmembrane voltage gradients allow these specialized cells to transform extracellular chemical information, sensed at the cell body and dendrites, into electrical signals called action potentials. These action potentials are conducted through axons to synapse, where the action potential translates into controlled chemical release to influence downstream cells. A complete picture of neurotransmission thus requires tools to probe these multiple aspects on the cellular level and to understand the interplay between them.

The study of neuronal electrical activity has a well-established history in the field of electrophysiology, beginning in the 1950s with the pioneering experiments of Hodgkin and Huxley.

(Hodgkin & Huxley, 1952a, 1952b, 1952c) However, the real-time in vivo chemical analysis of neurotransmission, and more specifically neurotransmitters, is a less mature field and a formidable analytical challenge. The heterogeneous and complex nature of the neuronal environment demands high sensitivity, spatiotemporal resolution, and chemical selectivity to glean meaningful insight into the

neurobiological phenomena studied. Consequently, electrochemistry, which can provide sub-second

measurements of charge stemming from redox reactions of electroactive compounds, has found

considerable, if not straightforward, success in this endeavor.(Bucher & Wightman, 2015) Appropriate

choice of instrumentation, experimental design, and electrode materials (e.g. carbon-fiber

(15)

measurements of a catecholamine neurotransmitter (i.e. dopamine, or DA) were prevented by interference by the neuroprotective antioxidant ascorbic acid, which is present in orders of magnitude larger concentrations within the extracellular environment.(Kissinger et al., 1973) Even with the advances in the field since this report, the topic of appropriate isolation, assignment, and quantitation of

electrochemical signals remains a central concern for researchers.

Indeed, many of these advances have been focused on enhancing the selectivity of in vivo electrochemical measurements. While controlled-potential amperometry has exquisite time resolution and sensitivity, the poor selectivity of the method has hindered its widespread adoption. All redox active species that can undergo electron transfer at the electrode contribute to the single measurements taken at a time point, and there exists no mechanism for separation of these contributions using this data alone.

As such, cyclic voltammetry has become the preferred approach. Stratification of the analyte responses along the potential axis generates unique voltammetric profiles that depend on the electrochemical properties of the analyte at the specific electrode surface, introducing another degree of separation into the measurements. However, traditional approaches to cyclic voltammetry, either in measurement or analysis, do not directly provide the selectivity or sensitivity desired to measure crucial neurotransmitters (i.e. catecholamines and indolamines), requiring further refinements to optimize the method for in vivo analysis.

Here, the development of cyclic voltammetry for in vivo neurotransmitter analysis will be briefly discussed. Focus will be placed on the experimental innovations permitting robust and selective dopamine measurements, as this has been the traditional system studied in in vivo cyclic voltammetric experiments. The discussion will then shift to the analysis of in vivo voltammetric data, specifically the evolution of the methods used and their interpretation. Finally, the sources of measurement error will be discussed.

EXPERIMENTAL APPROACHES TO DOPAMINE SIGNAL ISOLATION

It is a primary goal of in vivo electrochemistry to be able to convert the obtained measurements into meaningful statements on neurotransmitter temporal dynamics and concentrations with confidence.

To accomplish this, several criteria must be met. First, the phenomena that contribute to the measured

(16)

electrochemical signal must be understood, and the experiment must be designed such that it will generate a measurable signal from a phenomenon relating to the neurotransmitter of interest. Second, a subsection of the signal that carries information solely about the specific neurotransmitter of interest must be isolated. Finally, a means of transforming the isolated information about the neurotransmitter into concentration estimates must be deployed. The first two criteria can be partially met through experimental means (e.g. the deployment of appropriate electrochemical methodologies), while complete fulfillment of the second and third criteria relies on the use of robust calibration methodologies. This discussion begins by tracing the development of the experimental methodologies that lead to the current state of in vivo voltammetry.

As mentioned before, it was realized early that the traditional voltammetric procedures would prove insufficient to gain clear insight into catecholamine dynamics due to the interferences provided by its metabolites and other ambient species, which are typically found in orders of magnitude higher concentrations than dopamine in extracellular fluid.(Wightman et al., 1988b) The first step towards interpreting the electrochemical data was then identifying the subset of electroactive species present in the extracellular environment capable of generating signals. For this, experiments carried out using electrochemistry with modified electrodes and perfusion methods coupled to offline liquid chromatography were used to identify homovanillic acid, uric acid, 3,4-dihydroxyphenylacetic acid, and ascorbic acid as the primary components of the electrochemical signals.(Kovach et al., 1984; Salamone et al., 1984). Of these, the primary species of concern are 3,4-dihydroxyphenylacetic acid (DOPAC), the oxidative catabolite produced by monoamine oxidase, and ascorbic acid (AA), a neuroprotective antioxidant, both of which have similar voltammetric peak positions as dopamine on unmodified carbon electrodes.

The first path towards improving selectivity focused on understanding of the carbon electrode

surface and possible modifications to improve selectivity. Gonon and colleagues reported that brief

application of a high-frequency triangular wave (0 to 3 V vs. Ag/AgCl) resulted in the separation of a

(17)

Figure 1.1. Comparison of voltammetric measurements of ascorbic acid (AA), 3,4-dihydroxyphenylacetic

acid (DOPAC), and dopamine (DA) at carbon-fiber microelectrodes. (A) Slow-scan voltammograms (100

mV/s) for AA, DOPAC, and DA (left to right) taken at unmodified (a) and electrochemically pretreated (b)

carbon-fiber microelectrodes. (Kovach, et al., 1984) (B) Fast-scan voltammograms (200 V/s) for AA,

DOPAC, and DA (left to right) taken at bare carbon-fiber microelectrodes.(Baur et al., 1988)

(18)

Further, cyclic voltammetric characterization of these compounds using modified electrodes showed a change in their behavior (Figure 1.1A), namely the appearance of peaks in the voltammograms of DOPAC and DA, suggesting adsorptive pre-concentration at the electrode. (Kovach, et al., 1984) Consequently, there was a corresponding increase in sensitivity reported for use of these oxidized fibers towards the catecholamines.(Feng et al., 1987) However, these fibers exhibit a decrease in sensitivity in brain tissue with time, leading to high detection limits unsuitable for robust analysis of small dopamine changes. As such, later approaches focused on continued excursions to more moderate anodic potential limits (1.4) during the measurement, which was demonstrated to help increase and maintain sensitivity

throughout measurements, albeit at the cost of selectivity.(Hafizi et al., 1990; Heien et al., 2003;

Takmakov et al., 2010b) A second electrode modification for the increase in selectivity was the use of a perflourinated ion-exchange membrane (i.e. Nafion) at the electrode surface. (Gerhardt et al., 1984; Nagy et al., 1985) The negatively charged polymer membrane acts to filter out anions (e.g. ascorbic acid and DOPAC at physiological pH), preventing their access to the electrode surface. This allows for the relative isolation of the dopamine signal, coupled to a slight increase in sensitivity.(Baur, et al., 1988)

The second breakthrough for selective electrochemical measurements was the introduction of

fast-scan cyclic voltammetry (FSCV), in which the scan rate of the voltammetric sweep is hundreds of

volts per second. This approach was introduced by Millar and colleagues for calibration of the amount of

iontophoretically ejected dopamine.(Millar et al., 1981) However, its potential for direct measurement of

naturally released dopamine was soon realized. Four years later, the technique was shown to be capable

of selective in vivo measurement of dopamine evoked from electrical stimulation, a finding supported by

iontophoretic evaluation of DOPAC and dopamine.(Millar et al., 1985) Subsequent characterization of the

technique showed that this selectivity derives from the differing electron transfer rates between dopamine

and its interferents. At high scan rates, the slow kinetics of ascorbic acid and DOPAC oxidation push their

voltammetric peaks to potentials more positive than that of dopamine (Figure 1.1B), allowing resolution of

(19)

inherent advantages. Increasing scan rates results in increasing voltammetric signal intensities, and thus in sensitivity.(Bard & Faulkner, 2001) The shortening of the measurement window also enables access to sub-second information about the dynamics of neurotransmitter changes.

However, there are drawbacks to these approaches towards increasing selectivity. Modified electrodes distort the temporal response of the sensor beyond that attributable to diffusion from the release site to the electrode.(Feng, et al., 1987; Kovach, et al., 1984) These artifacts stem from the adsorptive characteristics of the electrode and, in the case of Nafion films, the time needed to diffuse through the film to the electrode surface.(Bath, et al., 2000; Kile et al., 2012) Subsequent treatment of the obtained data is then needed to obtain a correct picture of the dopamine response, which is typically done with convolution. (Engstrom et al., 1988; Kawagoe & Wightman, 1994; Wightman et al., 1988a) Another issue that arises is the presence of new types of interferences. The most prominent one is the large background current observed when using rapid scan rates for voltammetric measurements, which, at carbon electrodes, consists of non-faradaic and faradaic components. In many ways, the union of

microelectrodes and FSCV is mutually advantageous, as the small exposed electrode surface permits the background current to be minimized. However, given the concentrations of neurotransmitters found in vivo, this background signal still dwarfs the analytical signal by order of magnitude, necessitating digital background subtraction for resolution.(Howell et al., 1986) Further, the measurements then become dependent on the background stability, resulting in a number of issues. First, even in stable

environments, the background signal tends to drift with time, likely due to largely unavoidable changes at the electrode related to surface fouling and evolution driven by the applied waveform.(Hermans et al., 2008; Takmakov et al., 2010a; Wiedemann et al., 1990) This limits measurements to the time windows over which the background signal remains stable, restricting the information gained from the technique to that concerning phasic dopamine release as compared to long-term shifts in neurotransmitter

concentrations. Second, FSCV measurements are open to interference by chemical species that can

modulate the background current, either its non-faradaic or faradaic component. The non-faradaic current

arising from charging of the electrical double layer is determined by the impedance characteristics of the

electrochemical system. Thus, any species that alters this, such as ions that alter the effective double-

layer capacitance, result in artifacts in the background-subtracted measurements.(Jones et al., 1994;

(20)

Takmakov, et al., 2010a) Additionally, for moderately oxidized carbon fibers, a voltammetric wave attributable to the two-electron, two-proton redox reaction of a surface quinone-like species appears in the background current.(Dengler et al., 2015; Karweik et al., 1985; Kawagoe et al., 1993a; Runnels et al., 1999; Takmakov, et al., 2010a) As the process is dependent on protons, this functionality is pH-sensitive.

As dopamine terminal activity results in local pH shifts attributable to metabolic activity, this results in common contributions to FSCV measurements relating to this phenomena.(Venton et al., 2003) These, however, are preferable interferences, as their voltammetric behavior is drastically different from dopamine under species like DOPAC and ascorbic acid and readily dealt with through appropriate data analysis methods (as will be discussed below).

No method for increasing specificity is fool-proof. For instance, differentiation of dopamine from another catecholamine not discussed, norepinephrine, is not currently practically possible.(Heien, et al., 2003; Park et al., 2009) As such, criteria for appropriate signal attribution have been laid out in the literature, either in traditional use of FSCV or in the establishment of alterations to these procedures, and have been used with success in establishing the technique as a reliable method through which to monitor electroactive neurotransmitters.(Kawagoe et al., 1993b; Wightman, et al., 1987) Here, these criteria will be briefly reiterated. First, thorough in vitro characterization of the voltammetric behavior of the species of interest at the specific type of electrode used in a media containing all expected extracellular fluid

components is needed to verify that the in vivo signal exhibits similar behavior. Second, the use of independent methods of analysis (e.g. dialysis techniques coupled to offline analytical techniques or post- mortem liquid chromatography) is recommended to corroborate the general electrochemical

findings.(Buda et al., 1981; Church et al., 1987; Justice & Neill, 1986; Justice et al., 1983; Park, et al.,

2009) Third, the electrochemical measurements should match up with the known chemical composition

and physiology of the neural structure studied. This also requires confirmation of the positioning of the

electrode, which is most often done through electrolytic lesioning of the carbon fiber electrode post-

(21)

CALIBRATION METHODOLOGIES

As highlighted, the selectivity imparted by experimental modifications alone often proves

insufficient for complete isolation of the voltammetric dopamine signal. Thus, the use of robust calibration methodologies is needed to extract the pure dopamine signal from the data. Most commonly, the current at the dopamine oxidation potential is used as the indicator of the dopamine concentration, as it has maximal sensitivity to the dopamine concentration. Thus, the goal of calibration has largely been estimation of the ‘true’ value of this parameter for use in quantitation.

Early methods focused on identifying and analyzing only voltammograms that had only

contributions from dopamine and using traditional univariate analysis of the measured peak current. To reduce the subjective nature of this identification, a template method was introduced, where the correlation of an obtained in vivo signal was determined against a series of in vitro signals of expected components.(Phillips & Wightman, 2003; Rodeberg et al., 2017; Troyer et al., 2002; Venton & Wightman, 2003) Alternatively, the in vivo signal was compared to another in vivo signal evoked by a known method of eliciting the specific neurotransmitter response (e.g. electrical stimulation).(Phillips et al., 2003) There are, however, two issues with this approach. First, selection of a correlation threshold for selecting measurements with sufficiently pure dopamine signals was an arbitrary user-defined value rather than a statistically robust parameter. Second, this introduces an inherent bias into the pool of analyzed

data.(Rodeberg, et al., 2017) Despite these drawbacks, this approach was a hint of things to come, as it utilized the power of the voltammogram, namely that there are multiple current measurements that relate to the dopamine concentration that can be used for identification of the underlying analyte. Indeed, in an extension of this approach, a bivariate analysis method was used, where current measurements at potentials dominated by known interferents were used to predict and subtract their contributions at the dopamine oxidation potential.(Cheer et al., 2004; Venton, et al., 2003)

However, full utilization of the power of the voltammogram was not realized until the introduction

of chemometric multivariate analysis methods, which use the entire set of current measurements in the

voltammogram. Heien and colleagues first reported the use of a technique called principal component

analysis-inverse least squares regression (PCA-ILS), also referred to as principal component regression

(PCR) for short, for the analysis of FSCV data.(Heien et al., 2004) This approach consists of two steps.

(22)

First, principal component analysis, a dimensionality reduction factor analysis technique, is used to produce noise-free estimates of the pure spectra of all expected components. These components are defined by the user by providing the model a set of training voltammograms (i.e. training set) measured at the electrode. The spectral estimates are provided by analyzing the training set data to determine the signal shapes (i.e. factors or principal components) that define the majority of the variance of the training set data, which are assumed to describe only the analytically relevant variance. These principal

components are used to then estimate the noise-free spectra, which are then used to analyze the data using inverse least-squares regression to determine the linear combination of spectra that best fits it.

From this, the oxidative peak current of the fitted spectra is then converted into an estimate of

concentration using either average calibration factors for similar electrodes or ex vivo calibration. This final step is discussed more in the following section.

Since its introduction, the technique has been further refined to provide tools to help in model construction and validation. Techniques such as PCA-ILS can realize what is referred to in the

chemometrics literature as the first-order advantage.(Booksh & Kowalski, 1994; Olivieri, 2008) Univariate

methods (i.e. zero-order methods) have no means of detecting the presence of interferents contributing to

the single measurement used for calibration. However, first-order methods like PCA-ILS can detect their

presence through a validation technique called residual analysis.(Jackson & Mudholkar, 1979; Keithley et

al., 2009; Lavine & Workman, 2013) This procedure relies on the unattributed current left in the data after

spectral fitting, which has the advantage of having well-defined statistical properties that can be used for

robust detection of the presence of interferents. This is important, as the presence of considerable

residual current indicates that the model is poorly suited for analysis of the data and that the model

predictions likely have error. Adaptation and rigorous implementation of a residual analysis procedure for

FSCV was introduced by Keithley and colleagues.(Keithley, et al., 2009) Further, tools for the evaluation

of model quality (i.e. Cook’s distance plots for the detection of outliers and k vectors for visual inspection

(23)

has been successfully demonstrated.(Heien et al., 2005; Hermans, et al., 2008) However, the

implementation of PCA-ILS has not been without controversy. The main point of contention has been the proper construction of training sets, which adds experimental complexity due to the need for additional data collection. This issue was first reported by Rodeberg et al. and is expanded on in Chapter 2.

(Johnson et al., 2016a; Rodeberg et al., 2015)

It is worth noting that other analysis methods have been explored. First, a method called partial least squares regression (PLS) has been reported for FSCV analysis.(Yorgason et al., 2011) The method is highly similar to PCA-ILS, differing solely in how the pure spectra are determined from the training set prior to regression.(Kramer, 1998) For this step, PCA focuses solely on the major variance present in the voltammograms, while PLS considers both the voltammograms and corresponding concentration values to attempt to define factors that best explain the variance in both. The advantage of this approach

typically relies on the independence of errors in the concentration values and the obtained spectra, which, if not accounted for, can reduce the effectiveness of noise removal.(Kramer, 1998) However,

concentration values are typically estimated from the peak oxidative current of the training set

voltammograms, as a method for independent verification of the corresponding concentrations has not been established, so it is unclear how much of an advantage this approach would provide. Additionally, no direct comparison of PLS and PCA-ILS has been reported in the literature to evaluate this. A second method recently reported is the use of a penalized linear regression approach called elastic net.(Kishida et al., 2016) The main reasons for use of factor analysis techniques, like PLS and PCA, prior to

regression are to avoid 1) ill-defined regression equations and 2) issues that arise when a number of the predictive variables (e.g. the individual current measurements in the voltammograms) are highly

correlated.(Haaland & Thomas, 1988; Kramer, 1998) This latter condition is called multicollinearity and is

certainly present in the current measurements in a voltammetric wave. If these issues are not considered

during model building, the resulting solutions can be non-unique and bias towards the disproportionate

use of a subset of the current measurements for concentration measurement. Penalized linear regression

techniques address this issue in an alternative manner by modifying the regression equations themselves

with additional terms that ‘penalize’ solutions that bias towards unreasonably large weightings of a subset

of measurements, providing boundaries to define the regression equation such that it provides unique

(24)

solutions.(Meloun et al., 1994) In the report by Kishida et al., this approach was used for analysis of the derivatives of the non-background-subtracted FSCV voltammograms, and it was claimed that the

technique performed more reliably than PCA-ILS on the data analyzed and could be used to monitor tonic dopamine concentrations. However, a thorough characterization of this technique is needed to validate the results, as well as the development of tools like residual analysis for verification of the model results.

PRESENT LIMITATIONS IN QUANTITATING FSCV MEASUREMENTS

To close out this discussion, the final issue of converting the isolated dopamine signal into an estimate of concentration will be briefly discussed, particularly the limitations placed by in vivo

measurements and the currently employed methodologies. As noted above, the true output of the calibration models is an estimate of the oxidative peak current expected for dopamine in the absence of interferents. Estimates of concentration are produced by use of a conversion, or calibration, factor. The source of this calibration factor is ex vivo analysis at the specific electrode after the experiment or an average ex vivo calibration factor from similarly treated electrodes. The latter is typically used, because, as noted before, the electrode is more often lesioned to provide a marking for histological verification of electrode placement.

These approaches open up the estimates to a certain degree of quantitation error. First, it is not guaranteed that the calibration factor obtained ex vivo, even at the same electrode, will be the effective calibration factor in vivo. Indeed, comparison of the results from FSCV and microdialysis studying the levels of acetyl-p-aminophenol after injection revealed that both precalibration and ex vivo postcalibration differed significantly from the microdialysis result and from each other.(Logman et al., 2000) While part of this discrepancy may lie in the different sampling properties of the techniques, there has been no

definitive establishment of the accuracy of these approaches. Several factors could drive the introduction

(25)

Figure 1.2. Concentration error estimation for PCA-ILS analysis of a representative FSCV recording. (A)

Color plot showing two dopamine transients elicited by electrical stimulation during an intracranial self-

stimulation session. (B) Chemometric concentration estimates and corresponding 95% confidence

interval when considering calibration factor error. (C) Chemometric current concentration and

corresponding 95% confidence interval when the calibration factor is ignored.

(26)

with time, while use of waveforms with extended anodic limits also drive surface evolution with

time.(Johnson et al., 2016b; Singh et al., 2011; Takmakov, et al., 2010b) Changes driven by these factors over the time between a given experimental measurement and calibration, either during the rest of the experiment, during the removal procedure, or during equilibration with the calibration solution, would then introduce error into the calibration factor estimate. However, the experimental difficulty in determining the extent of this error has prevented any real understanding of its importance.

Additionally, even ignoring this error, the use of an average calibration factor introduces a deterministic error into the concentration estimates produced for a specific electrode based on the discrepancy between the actual calibration factor and this average calibration factor. This error can be treated more directly through theoretical considerations. The methodology for obtaining error estimates when using first-order methodologies like PCR has been the subject of research in the chemometrics literature. Here, an attempt is made to use the formulas provided by this work to illustrate the uncertainty in the estimation of the true concentrations measured during in vivo FSCV. The fundamental equation used for the calculation of the variance in the predicted concentration values for multivariate models is:

V(y pred ) = SEN −2 ∗ σ x 2 + h ∗ SEN −2 ∗ σ x 2 + 𝐱 u T 𝐕 𝟎 (β)𝐱 u (Eq. 1-1)

where V(y

pred

) is the variance in the predicted y (concentration) values, h is the leverage, SEN is the multivariate sensitivity (defined as the inverse of the length of the vector of calibration coefficients), σ

x2

is

the variance in the x values, x

u

is the unknown cyclic voltammogram, and V

0

() is the zeroth-order

approximation of the covariance matrix associated with the calibration coefficients. It can be seen that

there are three independent additive terms in this equation, which represent three main contributions to

the uncertainty in the concentration estimate – the uncertainty in the experimental current measurements,

the current measurements of the training data, and the concentration estimates for the training data,

respectively.

(27)

(Figure 1.2). PCA-ILS was first used to generate concentration estimates through use of the calibration factor (mean and standard deviation: 11.8 ± 2.1, n = 6), and the error (shown as a 95% confidence interval) was determined through the error analysis procedure described (Figure 1.2B). Additionally, an analysis was done where no attempt was made to convert the signal into concentration values, but rather just produce chemometric estimates of the current at the dopamine oxidation potential, to show the degree to which the calibration uncertainty plays a role in decreasing confidence in the concentration estimates (Figure 1.2C). It can easily be seen that the concentration estimates have a relatively large uncertainty. For instance, at the peak of the first dopamine transient, the concentration estimate is 240 ± 110 nM. For this reason, current measurements are sometimes report in lieu of concentrations, as this can be estimated with greater confidence. However, it is important to note a few points. First, relative measurements at the same electrode have lower uncertainty given sensitivity stability. Second, this error can theoretically be averaged out through multiple measurements.

CONCLUSION

The search for selectivity has been one of the primary driving forces behind the evolution of the field of in vivo electrochemistry. The advances in this arena made in the past four decades have

facilitated the maturation of the field to the point where it can be used to robustly track neurotransmitters in awake, freely moving animals and produced profound insights into the roles of release of these neurotransmitters in encoding information. Looking forward, many exciting new technologies have begun successful translation for in vivo use, including new electrode materials (e.g. carbon-nanotube coated electrodes), experimental configurations (e.g. microelectrode arrays and coupling of FSCV to

iontophoresis and electrophysiology), and novel electrode coatings (e.g. PEDOT). Certainly, the issue of

selectivity will continue to be a central concern for researchers as they explore the possibilities afforded

by these breakthroughs and expand the uses of FSCV to the study of new neural phenomena and

systems.

(28)

DISSERTATION OVERVIEW

In this vein, the focus of this dissertation is the critical analysis, development, and refinement of methods for isolation of neurotransmitter signals using FSCV. The first half of the dissertation (Chapters 2-3) deals with the use of multivariate calibration methods for FSCV data analysis. Chapter 2 addresses with a criticism of a widely used approach for training principal component regression models for FSCV data analysis. Chapter 3 presents an alternative multivariate analysis method, multivariate curve resolution, aimed at mitigating the demands placed on the researcher in collecting data for model

development. The latter half of the dissertation (Chapters 4-5) focuses on a novel method for dealing with the background current at carbon-fiber microelectrodes to minimize its interference with analytical signals.

Chapter 4 introduces this convolution-based method and characterizes its use with the standard FSCV

waveform. Chapter 5 extends on this work by introducing a measurement protocol tailored to this method

and explores the possibilities opened by largely removing the electrode background current.

(29)

REFERENCES

Bard, A. J., & Faulkner, L. R. (2001). Electrochemical Methods: Fundamentals and Applications (2nd ed.).

New York, NY: John Wiley & Sons, Inc.

Bath, B. D., Michael, D. J., Trafton, B. J., Joseph, J. D., Runnels, P. L., & Wightman, R. M. (2000).

Subsecond adsorption and desorption of dopamine at carbon-fiber microelectrodes. Analytical Chemistry, 72(24), 5994-6002.

Baur, J. E., Kristensen, E. W., May, L. J., Wiedemann, D. J., & Wightman, R. M. (1988). Fast-Scan Voltammetry of Biogenic-Amines. Anal Chem, 60(13), 1268-1272.

Booksh, K. S., & Kowalski, B. R. (1994). Theory of Analytical-Chemistry. Anal Chem, 66(15), A782-A791.

Bucher, E. S., Brooks, K., Verber, M. D., Keithley, R. B., Owesson-White, C., Carroll, S., et al. (2013).

Flexible Software Platform for Fast-Scan Cyclic Voltammetry Data Acquisition and Analysis. Anal Chem, 85(21), 10344-10353.

Bucher, E. S., & Wightman, R. M. (2015). Electrochemical Analysis of Neurotransmitters. Annu Rev Anal Chem, 8, 239-261.

Buda, M., Gonon, F., Cespuglio, R., Jouvet, M., & Pujol, J. F. (1981). Invivo Electrochemical Detection of Catechols in Several Dopaminergic Brain-Regions of Anesthetized Rats. Eur J Pharmacol, 73(1), 61-68.

Cheer, J. F., Wassum, K. M., Heien, M. L. A. V., Phillips, P. E. M., & Wightman, R. M. (2004). Cannabinoids enhance subsecond dopamine release in the nucleus accumbens of awake rats. J Neurosci, 24(18), 4393-4400.

Church, W. H., Justice, J. B., & Byrd, L. D. (1987). Extracellular Dopamine in Rat Striatum Following Uptake Inhibition by Cocaine, Nomifensine and Benztropine. Eur J Pharmacol, 139(3), 345-348.

Dengler, A. K., Wightman, R. M., & McCarty, G. S. (2015). Microfabricated Collector-Generator Electrode Sensor for Measuring Absolute pH and Oxygen Concentrations. Analytical Chemistry, 87(20), 10556-10564.

Engstrom, R. C., Wightman, R. M., & Kristensen, E. W. (1988). Diffusional Distortion in the Monitoring of Dynamic Events. Anal Chem, 60(7), 652-656.

Feng, J. X., Brazell, M., Renner, K., Kasser, R., & Adams, R. N. (1987). Electrochemical Pretreatment of Carbon-Fibers for Invivo Electrochemistry - Effects on Sensitivity and Response-Time. Anal Chem, 59(14), 1863-1867.

Gerhardt, G. A., Oke, A. F., Nagy, G., Moghaddam, B., & Adams, R. N. (1984). Nafion-Coated Electrodes with High Selectivity for Cns Electrochemistry. Brain Res, 290(2), 390-395.

Gonon, F., Buda, M., Cespuglio, R., Jouvet, M., & Pujol, J. F. (1980). Invivo Electrochemical Detection of

Catechols in the Neostriatum of Anesthetized Rats - Dopamine or Dopac. Nature, 286(5776),

902-904.

(30)

Gonon, F. G., Fombarlet, C. M., Buda, M. J., & Pujol, J. F. (1981). Electrochemical Treatment of Pyrolytic Carbon-Fiber Electrodes. Anal Chem, 53(9), 1386-1389.

Haaland, D. M., & Thomas, E. V. (1988). Partial Least-Squares Methods for Spectral Analyses .1. Relation to Other Quantitative Calibration Methods and the Extraction of Qualitative Information. Anal Chem, 60(11), 1193-1202.

Hafizi, S., Kruk, Z. L., & Stamford, J. A. (1990). Fast Cyclic Voltammetry - Improved Sensitivity to Dopamine with Extended Oxidation Scan Limits. J Neurosci Meth, 33(1), 41-49.

Heien, M. L. A. V., Johnson, M. A., & Wightman, R. M. (2004). Resolving neurotransmitters detected by fast-scan cyclic voltammetry. Anal Chem, 76(19), 5697-5704.

Heien, M. L. A. V., Khan, A. S., Ariansen, J. L., Cheer, J. F., Phillips, P. E. M., Wassum, K. M., et al. (2005).

Real-time measurement of dopamine fluctuations after cocaine in the brain of behaving rats. P Natl Acad Sci USA, 102(29), 10023-10028.

Heien, M. L. A. V., Phillips, P. E. M., Stuber, G. D., Seipel, A. T., & Wightman, R. M. (2003). Overoxidation of carbon-fiber microelectrodes enhances dopamine adsorption and increases sensitivity.

Analyst, 128(12), 1413-1419.

Hermans, A., Keithley, R. B., Kita, J. M., Sombers, L. A., & Wightman, R. M. (2008). Dopamine detection with fast-scan cyclic voltammetry used with analog background subtraction. Anal Chem, 80(11), 4040-4048.

Hodgkin, A. L., & Huxley, A. F. (1952a). Movement of Sodium and Potassium Ions during Nervous Activity. Cold Spring Harb Sym, 17, 43-52.

Hodgkin, A. L., & Huxley, A. F. (1952b). Propagation of Electrical Signals Along Giant Nerve Fibres. Proc R Soc Ser B-Bio, 140(899), 177-183.

Hodgkin, A. L., & Huxley, A. F. (1952c). A Quantitative Description of Membrane Current and Its Application to Conduction and Excitation in Nerve. J Physiol-London, 117(4), 500-544.

Howell, J. O., Kuhr, W. G., Ensman, R. E., & Wightman, R. M. (1986). Background Subtraction for Rapid Scan Voltammetry. J Electroanal Chem, 209(1), 77-90.

Jackson, J. E., & Mudholkar, G. S. (1979). Control Procedures for Residuals Associated with Principal Component Analysis. Technometrics, 21(3), 341-349.

Johnson, J. A., Rodeberg, N. T., & Wightman, R. M. (2016a). Failure of Standard Training Sets in the

Analysis of Fast-Scan Cyclic Voltammetry Data. Acs Chem Neurosci, 7(3), 349-359.

(31)

Justice, J. B., & Neill, D. B. (1986). Interpretations of Voltammetry Invivo Using Dialyzed Perfusion. Ann Ny Acad Sci, 473, 170-187.

Justice, J. B., Wages, S. A., Michael, A. C., Blakely, R. D., & Neill, D. B. (1983). Interpretations of

Voltammetry in the Striatum Based on Chromatography of Striatal Dialysate. J Liq Chromatogr, 6(10), 1873-1896.

Karweik, D. H., Hu, I. F., Weng, S., & Kuwana, T. (1985). Carbonaceous Surfaces - Modification, Characterization, and Uses for Electrocatalysis. Acs Sym Ser, 288, 582-595.

Kawagoe, K. T., Garris, P. A., & Wightman, R. M. (1993a). Ph-Dependent Processes at Nafion(R)-Coated Carbon-Fiber Microelectrodes. J Electroanal Chem, 359(1-2), 193-207.

Kawagoe, K. T., & Wightman, R. M. (1994). Characterization of Amperometry for in-Vivo Measurement of Dopamine Dynamics in the Rat-Brain. Talanta, 41(6), 865-874.

Kawagoe, K. T., Zimmerman, J. B., & Wightman, R. M. (1993b). Principles of Voltammetry and Microelectrode Surface-States. J Neurosci Meth, 48(3), 225-240.

Keithley, R. B., Heien, M. L., & Wightman, R. M. (2009). Multivariate concentration determination using principal component regression with residual analysis. Trac-Trend Anal Chem, 28(9), 1127-1136.

Keithley, R. B., & Wightman, R. M. (2011). Assessing Principal Component Regression Prediction of Neurochemicals Detected with Fast-Scan Cyclic Voltammetry. Acs Chem Neurosci, 2(9), 514-525.

Kile, B. M., Walsh, P. L., McElligott, Z. A., Bucher, E. S., Guillot, T. S., Salahpour, A., et al. (2012).

Optimizing the Temporal Resolution of Fast-Scan Cyclic Voltammetry. Acs Chem Neurosci, 3(4), 285-292.

Kishida, K. T., Saez, I., Lohrenz, T., Witcher, M. R., Laxton, A. W., Tatter, S. B., et al. (2016). Subsecond dopamine fluctuations in human striatum encode superposed error signals about actual and counterfactual reward. P Natl Acad Sci USA, 113(1), 200-205.

Kissinger, P. T., Hart, J. B., & Adams, R. N. (1973). Voltammetry in Brain-Tissue - New Neurophysiological Measurement. Brain Res, 55(1), 209-213.

Kovach, P. M., Ewing, A. G., Wilson, R. L., & Wightman, R. M. (1984). Invitro Comparison of the Selectivity of Electrodes for Invivo Electrochemistry. J Neurosci Meth, 10(3), 215-227.

Kramer, R. (1998). Chemometric Techniques for Quantitative Analysis. New York, NY: Marcel Dekker, Inc.

Kume-Kick, J., & Rice, M. E. (1998). Dependence of dopamine calibration factors on media Ca2+ and Mg2+ at carbon-fiber microelectrodes used with fast-scan cyclic voltammetry. J Neurosci Meth, 84(1-2), 55-62.

Lavine, B. K., & Workman, J. (2013). Chemometrics. Anal Chem, 85(2), 705-714.

Logman, M. J., Budygin, E. A., Gainetdinov, R. R., & Wightman, R. M. (2000). Quantitation of in vivo

measurements with carbon fiber microelectrodes. J Neurosci Meth, 95(2), 95-102.

(32)

Meloun, M., Militky, J., & Forina, M. (1994). Chemometrics for Analytical Chemistry. New York, NY: Ellis Horwood.

Millar, J., Armstrongjames, M., & Kruk, Z. L. (1981). Polarographic Assay of Iontophoretically Applied Dopamine and Low-Noise Unit Recording Using a Multibarrel Carbon-Fiber Microelectrode.

Brain Res, 205(2), 419-424.

Millar, J., Stamford, J. A., Kruk, Z. L., & Wightman, R. M. (1985). Electrochemical, Pharmacological and Electrophysiological Evidence of Rapid Dopamine Release and Removal in the Rat Caudate- Nucleus Following Electrical-Stimulation of the Median Forebrain-Bundle. Eur J Pharmacol, 109(3), 341-348.

Nagy, G., Gerhardt, G. A., Oke, A. F., Rice, M. E., Adams, R. N., Moore, R. B., et al. (1985). Ion-Exchange and Transport of Neurotransmitters in Nafion Films on Conventional and Microelectrode Surfaces. J Electroanal Chem, 188(1-2), 85-94.

Olivieri, A. C. (2008). Analytical advantages of multivariate data processing. One, two, three, infinity?

Anal Chem, 80(15), 5713-5720.

Park, J., Kile, B. M., & Wightman, R. M. (2009). In vivo voltammetric monitoring of norepinephrine release in the rat ventral bed nucleus of the stria terminalis and anteroventral thalamic nucleus.

Eur J Neurosci, 30(11), 2121-2133.

Phillips, P. E. M., Stuber, G. D., Heien, M. L. A. V., Wightman, R. M., & Carelli, R. M. (2003). Subsecond dopamine release promotes cocaine seeking. Nature, 422(6932), 614-618.

Phillips, P. E. M., & Wightman, R. M. (2003). Critical guidelines for validation of the selectivity of in-vivo chemical microsensors. Trac-Trend Anal Chem, 22(9), 509-514.

Roberts, J. G., Lugo-Morales, L. Z., Loziuk, P. L., & Sombers, L. A. (2013). Real-time chemical measurements of dopamine release in the brain. Methods Mol Biol, 964, 275-294.

Rodeberg, N. T., Johnson, J. A., Cameron, C. M., Saddoris, M. P., Carelli, R. M., & Wightman, R. M. (2015).

Construction of Training Sets for Valid Calibration of in Vivo Cyclic Voltammetric Data by Principal Component Analysis. Anal Chem, 87(22), 11484-11491.

Rodeberg, N. T., Sandberg, S. G., Johnson, J. A., Phillips, P. E. M., & Wightman, R. M. (2017). Hitchhiker's Guide to Voltammetry: Acute and Chronic Electrodes for in Vivo Fast-Scan Cyclic Voltammetry.

Acs Chem Neurosci, 8(2), 221-234.

Runnels, P. L., Joseph, J. D., Logman, M. J., & Wightman, R. M. (1999). Effect of pH and surface

functionalities on the cyclic voltammetric responses of carbon-fiber microelectrodes. Anal

Chem, 71(14), 2782-2789.

(33)

Singh, Y. S., Sawarynski, L. E., Dabiri, P. D., Choi, W. R., & Andrews, A. M. (2011). Head-to-Head Comparisons of Carbon Fiber Microelectrode Coatings for Sensitive and Selective Neurotransmitter Detection by Voltammetry. Anal Chem, 83(17), 6658-6666.

Takmakov, P., Zachek, M. K., Keithley, R. B., Bucher, E. S., McCarty, G. S., & Wightman, R. M. (2010a).

Characterization of Local pH Changes in Brain Using Fast-Scan Cyclic Voltammetry with Carbon Microelectrodes. Anal Chem, 82(23), 9892-9900.

Takmakov, P., Zachek, M. K., Keithley, R. B., Walsh, P. L., Donley, C., McCarty, G. S., et al. (2010b).

Carbon Microelectrodes with a Renewable Surface. Anal Chem, 82(5), 2020-2028.

Troyer, K. P., Heien, M. L. A. V., Venton, B. J., & Wightman, R. M. (2002). Neurochemistry and electroanalytical probes. Curr Opin Chem Biol, 6(5), 696-703.

Venton, B. J., Michael, D. J., & Wightman, R. M. (2003). Correlation of local changes in extracellular oxygen and pH that accompany dopaminergic terminal activity in the rat caudate-putamen. J Neurochem, 84(2), 373-381.

Venton, B. J., & Wightman, R. M. (2003). Psychoanalytical electrochemistry: Dopamine and behavior.

Anal Chem, 75(19), 414a-421a.

Wiedemann, D. J., Bassetomusk, A., Wilson, R. L., Rebec, G. V., & Wightman, R. M. (1990). Interference by Dopac and Ascorbate during Attempts to Measure Drug-Induced Changes in Neostriatal Dopamine with Nafion-Coated, Carbon-Fiber Electrodes. J Neurosci Meth, 35(1), 9-18.

Wightman, R. M., Amatore, C., Engstrom, R. C., Hale, P. D., Kristensen, E. W., Kuhr, W. G., et al. (1988a).

Real-Time Characterization of Dopamine Overflow and Uptake in the Rat Striatum.

Neuroscience, 25(2), 513-523.

Wightman, R. M., Brown, D. S., Kuhr, W. G., & Wilson, R. L. (1987). Molecular Specificity of In Vivo Electrochemical Measurements. In J. B. Justice (Ed.), Voltammetry in the Neurosciences (pp. 103- 138). Clifton, NJ: Humana Press.

Wightman, R. M., May, L. J., & Michael, A. C. (1988b). Detection of Dopamine Dynamics in the Brain.

Anal Chem, 60(13), 769-779A.

Yorgason, J. T., Espana, R. A., & Jones, S. R. (2011). Demon voltammetry and analysis software: analysis

of cocaine-induced alterations in dopamine signaling using multiple kinetic measures. J Neurosci

Methods, 202(2), 158-164.

(34)

CHAPTER 2: FAILURE OF STANDARD TRAINING SETS IN THE ANALYSIS OF FAST-SCAN CYCLIC VOLTAMMETRY DATA

1

INTRODUCTION

In the analysis of fast-scan cyclic voltammetry (FSCV) data, the use of standard training sets (i.e.

sets of cyclic voltammograms obtained from electrodes, recording sessions, and/or subjects other than those used for experimental data collection) for conditioning principal component regression (PCR) calibration models has increased in popularity.(Clark et al., 2013; Flagel et al., 2011; Goertz et al., 2015;

Hart et al., 2014; Hollon et al., 2014; Howe et al., 2013; Nasrallah et al., 2011; Parker et al., 2010; Wanat et al., 2013; Willuhn et al., 2012; Willuhn et al., 2014a; Willuhn et al., 2014b) However, theoreticians have long warned about the dangers associated with this approach, emphasizing the need for either

consistency between the conditions for obtaining model training and experimental data, or the use of transfer methods when such consistency cannot be obtained.(Booksh, 2006; Feudale et al., 2002; Wang

& Kowalski, 1992; Woody et al., 2004) Here, we aim to provide a clear theoretical explanation of PCR, with particular focus on using this discussion to evaluate the appropriateness of the use of standard training sets in analysis of FSCV data.

FSCV is an electroanalytical technique that allows for the real-time recording of the subsecond

dynamics of electroactive neurotransmitters.(Bucher & Wightman, 2015) Cyclic voltammograms (CVs)

obtained through its use can be used for analyte concentration change identification and subsequent

quantification, both of which are critical to proper calibration. In practice, however, CVs obtained in vivo

often have contributions from multiple analytes that require resolution before positive identification, much

less quantification, can be made. As a multivariate calibration technique, PCR is equipped to handle this

(35)

issue, as information across the scan-potential window can be used to separate these overlapping signals. As such, considerable work has gone into the development of PCR as a robust data analysis technique for FSCV.(Heien et al., 2004; Keithley et al., 2010; Keithley et al., 2009; Keithley & Wightman, 2011)

In using PCR, proper training set construction for model conditioning is a critical

consideration.(Rodeberg et al., 2015) The current-concentration relationships at each potential for a given analyte, which are essential information for accurate signal resolution, are directly estimated from the CVs in the training set. As these relationships are known to vary between experimental sessions, it has been advised that training set data be collected under conditions resembling those of the experimental data collection as closely as possible (e.g. in the same animal and anatomical region, with the same

equipment, and within the recording session).(Keithley, et al., 2009; Kramer, 1998; Lavine & Workman, 2013) However, procedural constraints have increased the use of standard training sets, which consist of data collected under circumstances significantly differing from those of experimental data collection. The questions then arise as to what degree these training sets can capture these experiment-specific

relationships and whether their use leads to a detrimental effect on the ability of derived models to resolve analyte contributions. To this end, recent work from our laboratory demonstrated undesirable practical consequences stemming from their use, including systematic misestimation of analyte concentration changes and failure of model validation procedures.(Rodeberg, et al., 2015) However, the specific origin of these issues within the framework of PCR was not investigated.

The goal of this paper is multifold. First, we seek to increase the interpretability of PCR models by

elucidating how principal component regression accomplishes the calibration goals of analyte resolution

and quantification, particularly in the analysis of FSCV data. While there are many excellent resources for

understanding the technique,(Keithley, et al., 2009; Kramer, 1998; Lavine & Workman, 2013) this

discussion aims to avoid the heavy reliance on the language of vector calculus or linear algebra often

found in these guides, instead substituting visual explanations where possible. Understanding of these

calculations can be used to help guide training set construction, enabling proper PCR use. Second, this

discussion is used to build on our previous work, focusing here on identification of the source of the

previously demonstrated shortcomings of models built with standard training sets.(Rodeberg, et al., 2015)

(36)

Particularly, it is shown that the use of standard training sets indeed leads to improper assignment of the current-concentration relationships that define multivariate analysis, leading to poor analyte resolution.

Ultimately, these results serve to highlight the need and practical utility of training set construction within a given experimental session.

THEORY

Calibration

Calibration Basics. The goal of analytical calibration is to determine the relationship between an instrumental response and the corresponding value of the sample property to be estimated (e.g.

concentration of an analyte) under a given set of conditions for future prediction of the latter.(Booksh, 2006) This is done in two steps: calibration method selection and model training. Selection of a method is driven by the expected characteristics of the data (e.g. presence of interference and dimensionality), assumptions made about relationship between the instrumental response and sample property (e.g.

linearity), and practical considerations (e.g. computation intensity and ease of use). Within that method’s framework, estimated model parameters are determined by training the calibration model using data for which both the response and sample property value are known (i.e., a training set). This relationship can then be used to convert experimental measurements into estimations of the unknown value of the sample property. The accuracy of this procedure is limited by the underlying assumptions of the calibration method, and the validity of the relationship found in the training data to the experimental data.

Univariate Linear Regression. The univariate linear regression calibration method uses a single

instrumental response value (e.g. a current measurement) and assumes a linear relationship between it

and the value of the sample property. In the analysis of FSCV data, the peak faradaic current, the most

Figure

Figure 1.1. Comparison of voltammetric measurements of ascorbic acid (AA), 3,4-dihydroxyphenylacetic  acid (DOPAC), and dopamine (DA) at carbon-fiber microelectrodes
Figure 1.2. Concentration error estimation for PCA-ILS analysis of a representative FSCV recording
Figure 2.1. Representative in vivo electrochemical recording showing dopamine and pH changes
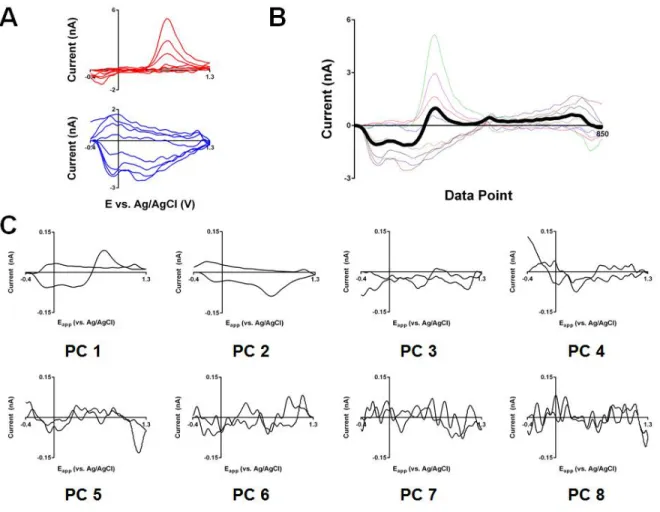
Figure 2.2. The generation of principal components. (A) Dopamine (top) and pH (bottom) training set  voltammograms shown in the traditional electrochemical format (left, as function of potential) and in the
+7

References

Related documents

• When there is a reasonable selection of information interpreted under an incorrect top level frame (e.g. air travel vs ground travel) it provides a correct top

equipped for real-time visualization of the results shows that the continuous infusion of insulin (between 0.02 U/ kg/h and 0.06 U/kg/h), guided by glucose levels, enabled us to

EURASIP Journal on Wireless Communications and Networking 2005 5, 645?660 c? 2005 Bosheng Zhou et al A Cross Layer Route Discovery Framework for Mobile Ad Hoc Networks Bosheng Zhou

7 [18] we compare the measurement of the nuclear modification factor for inclusive primary charged-particle ( h ± ) production in p–Pb collisions to that in central (0–5 %

The unsteady flow with head transfer of a dusty couple stress conducting fluid under the influence of an applied uniform magnetic field has been studied in the presence of

This article in particular explores professional communi- cation represented in modern-day popular science publica- tions on the topic of information technologies. The choice of

All measures soil properties in this study could explain higher significant variability of the response variables (SOC, TN, SMBC and SMBN contents), suggesting

Key points: 1) Clearly, a significant amount of fructose can be converted to lactate, but quantitative metabolic data of dietary fructose to lactate conversion is very lim- ited.