1
Understanding apprentice pay
Final Report
September 2016
Hilary Drew, Felix Ritchie and Michail Veliziotis University of the West of England, Bristol
Acknowledgements
All statistical results in the paper are generated from ONS or BIS data by the authors, unless otherwise stated. This research report was carried out under contract to the Low Pay Commission (LPC). Access to the ASHE data was given by the Office for National Statistics (ONS) under project no. 12016. Access to APS data was granted by the Department for Business Industry and Skills (BIS). Statistical results presented in this paper using ASHE data are Crown Copyright. The use of the ONS statistical data in this work does not imply the endorsement of the ONS in relation to the interpretation or analysis of the statistical data. This work uses research datasets which may not exactly reproduce National Statistics aggregates.
2
Table of contents
Executive summary ... 4
1. Introduction ... 7
1.1 Apprentice pay in the UK ... 7
1.2 The Apprentice Rate ... 7
1.3 Previous work on the AR ... 8
1.4 Aims of this study ... 10
1.5 Methods ... 10
2. Quantitative analysis ... 11
2.1 Understanding the Apprenticeship Pay Survey ... 11
2.2 Non-compliance ... 15
2.3 Awareness of NMW and non-compliance ... 20
2.4 Multiple regression analysis of non-compliance and awareness ... 22
2.5 ASHE analysis ... 30
3. Qualitative analysis ... 32
3.1 Data collection ... 32
3.2 Research findings ... 36
3.3 Discussion ... 48
3.4 ASHE vs APS accuracy revisited ... 50
4. Conclusion and recommendations ... 52
References ... 54
Appendix 1: Tables of full results ... 56
3
List of tables
Table 1 National Minimum Wage rates 2010-2013 ... 8
Table 2 Characteristics of the APS 2011, 2012 and 2014 ... 12
Table 3 Number and size of analysis subsets ... 13
Table 4 Overall non-compliance rates for apprentices ... 15
Table 5 Extent of non-compliance for apprentices, by APS source ... 16
Table 6 Non-compliance rates for apprentices in ASHE ... 16
Table 7 Sampling rates in ASHE ... 17
Table 8 Non-compliance, by relevant MW (APS 2014), various samples ... 18
Table 9 Non-compliance by relevant MW (APS 2014), allowing for ±1p error... 20
Table 10 NMW awareness (APS 2014) ... 20
Table 11 Extent of non-compliance, by NMW awareness (APS 2014) ... 21
Table 12 Extent of non-compliance, by framework and survey year ... 28
Table 13 Non-compliance differences between hairdressing and other frameworks ... 29
Table 14 Simple non-compliance rates in ASHE, by relevant wage rate ... 30
Table 15 Non-compliance by relevant MW (ASHE and APS) ... 31
Table 16 Effect of rounding in ASHE ... 32
Table 17 Qualitative study numbers ... 35
4
Executive summary
This study consisted of two parts, a quantitative and qualitative element. The quantitative study aimed to:
review the improved Apprenticeship Pay Survey (APS) for internal quality and coherence with previous findings
reconcile ASHE and APS estimates of non-compliance The key findings of this section in respect to apprentice pay are that:
APS 2014 significantly improves data collection of apprentices’ pay and hours relative to past APS surveys, enabling a more accurate and detailed analysis
The analysis of APS 2014 confirms and strengthens some of our previous findings concerning non-compliance. Non-compliance is significantly related to the age of apprentice/year of course and appears lower in better quality jobs
Non-compliance decreases with age when the Apprentice Rate (AR) is the relevant minimum (first-year apprentices); in contrast, it increases with age when a higher minimum needs to be paid (i.e. for second-year apprentices over 18 years old)
The measurement of hourly pay is again found to affect non-compliance estimates; more accurate responses (e.g. if both pay and hours are reported from a payslip) are related to less non-compliance
Large differences between frameworks exist and can only partly be explained by observable characteristics.
The new questions on awareness of the NMW legislation are a significant improvement over APS 2012; importantly, a more detailed knowledge of the NMW legislation appears negatively related to non-compliance, in general
Future APS surveys may consider asking each apprentice about his/her knowledge of the NMW rate that applies to him/her (currently, only awareness of the AR is recorded)
In respect of the coherence between APS and ASHE we find that:
APS information from payslips is a very welcome addition; it should be maintained and greater efforts made to ensure that respondents use this information
ASHE data gives similar numbers to APS 2014 data when the latter is fully documented through the use of a payslip
ASHE data appears to have a much lower number of apprentices than expected. Given the way ASHE is collected, this strengthens the idea that ASHE is a lower bound estimate of non-compliance as missing observations are more likely to be in non-compliant firms
Concern over accuracy of self-reported pay (as shown in the qualitative part) suggests that the APS non-compliance rate is an upper bound estimate (as inaccuracy, per se, leads to over-estimation at the yes/no boundary)
5 The qualitative study aimed to explore the findings suggested by the previous quantitative analysis and confirmed by more recent work. To keep the project manageable within the very short reporting period, only apprenticeships in childcare and hairdressing were considered, as these have some of the highest non-compliance rates. The team interviewed college trainers, apprentices individually and in focus groups, and employers.
The key findings from the qualitative analysis are:
Knowledge of what is being paid was very poor indeed; some apprentices still felt their employer did not understand how salaries would change after the second year etc. Apprentices relied upon friends, colleagues and classmates for information, and did not think of government information sources such as the LPC website
Knowledge of training hours was also vague. Most apprentices needed to confer to check how many hours of training they had at college, despite being at college when the interviews/focus groups took place
Apprentices saw low pay as a normal feature of being an apprentice at the bottom of the workplace hierarchy. They disliked the low take-home pay, but did not worry overmuch about the specific hourly rate
Apprentices had a very high level of trust in their employers to ‘do the right thing’
Colleges had a role to play. They had strategies in place, and apprentices felt confident discussing pay with them; however, college staff clearly did not know apprentices as well as they thought, as the staff claimed no non-compliance whereas a questionnaire showed significant levels
Some power issues arose between employer and employee – not necessarily intentional, but if employers made mistakes in pay there were few mechanisms for employees to find and report such mistakes
One employer noted the conflict between government plans to encourage school-leavers to extend their education, and the need for low-cost (and young) apprentices
Recommendations
The documented (with the use of a payslip) APS non-compliance rate is our preferred estimate, with the baseline APS sample giving the upper bound estimate, and ASHE figures providing a lower bound, but more accurate, estimate
Future APS should try to include as many as possible fully documented cases where both pay and hours are reported from a payslip
Apprentices have very little idea of what their wage rate is, or should be, and do not explore the internet to look for more information. Instead they rely on friends and colleagues; a downloadable mobile phone application (the “app app”) allowing simple calculations might reach this group
6 There is some evidence that apprentices feel concerned to raise low pay with their employers. Hence there may be a role for LPC in helping employees to overcome their fears by, for example, suggesting positive arguments or ways to raise the topic
7
1. Introduction
1.1
Apprentice pay in the UK
Apprenticeships combine practical paid work experience and on- and off-the-job training which culminates in a nationally recognised qualification. As employees, apprentices earn as they learn and gain practical skills in the workplace (SFA, 2015). Apprenticeships should include a minimum of 280 ‘guided learning hours’ (GLHs) per year of which 100 must be delivered away from the workplace (Higton, 2013); this equates to roughly six hours per week training, including two hours off-site. Apprenticeships are organised around industry-specific ‘frameworks’ which specify the length and content of the apprenticeship for that industry. Variations between the content and delivery of apprenticeships, frameworks, employer input and apprentice figures may be partly explained by differences in the institutional characteristics of educational systems and labour markets (see, for example, Ashton et al, 2000; Hall and Soskice, 2001; Rainbird, 1993; Steedman, 2010; Toner, 2008). The face of apprenticeships has changed in recent years, shifting from skilled manual labour to service and managerial roles.
Responsibility for public funding of apprenticeships is currently shared between the Department for Business, Innovation and Skills (BIS) and the Department for Education (DfE) in England, and the devolved administrations elsewhere. Funds are provided directly to the training providers. In the 2015 Summer Budget and Autumn Statement (HMG, 2015, pp.45-46), the Government announced plans to make the apprenticeship scheme self-funding through a levy on larger businesses by 2020, to create a new body for training standards, and to give employers more control over the choice of training provider.
The number of apprenticeships in the UK has increased steadily since 2008, with 865,000 funded apprentices registered in each of the last three academic years (SFA, 2015); the current target is for three million by 2020 (HMG, 2015). Sectors tend to be gender-dominated, with females choosing apprenticeships in service sectors, and males taking up apprenticeships in industrial sectors. This has led to a marked gap in pay for male and female apprentices (Fuller et al, 2005). Similarly, there are differences across sectors in the age of apprentices: child-care has limited opportunities for younger apprentices as employers are reluctant to take on under-18s, while hairdressing tends to be youth-dominated. Drew et al (2015, p.2) estimate that 70% of apprentices worked at the organisation before beginning their apprenticeship, suggesting that the majority of apprentices would be older than the school-leaving age; LPC estimates that around 70% are aged 19 or over.
1.2
The Apprentice Rate
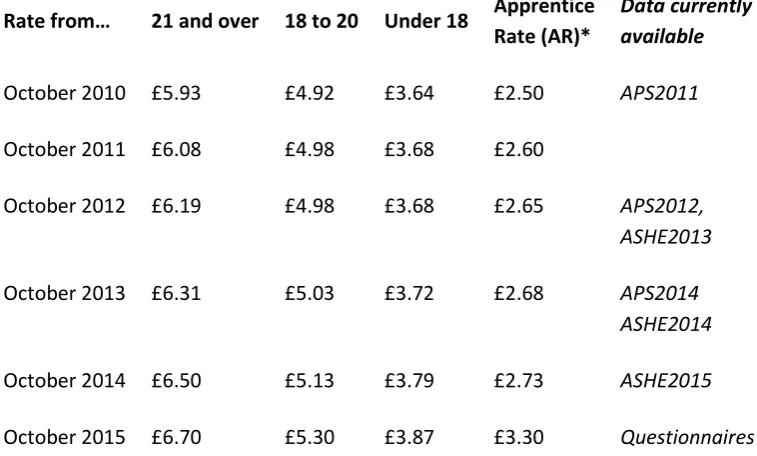
8 The AR applies to those aged 18 or under, or those 19 and over and in their first year of apprenticeship. Table 1 shows the NMW rates since the introduction of the AR. The final column of Table 1 also shows the datasets which contain data allowing apprentice pay to be analysed for each minimum wage period, namely the Apprenticeship Pay Survey (APS) and the Annual Survey of Hours and Earnings (ASHE).
Table 1 National Minimum Wage rates 2010-2013
Rate from… 21 and over 18 to 20 Under 18 Apprentice Rate (AR)*
Data currently available
October 2010 £5.93 £4.92 £3.64 £2.50 APS2011
October 2011 £6.08 £4.98 £3.68 £2.60
October 2012 £6.19 £4.98 £3.68 £2.65 APS2012,
ASHE2013
October 2013 £6.31 £5.03 £3.72 £2.68 APS2014
ASHE2014
October 2014 £6.50 £5.13 £3.79 £2.73 ASHE2015
October 2015 £6.70 £5.30 £3.87 £3.30 Questionnaires** *applies to those under 19 or in year 1 of the apprenticeship; otherwise NMW applies
**data collected as part of this study
Broadly the AR has grown at a similar rate to other MWs, but in 2015 the Government took the unusual step of rejecting the LPC’s recommended AR of £2.80. Both the Government and the LPC noted the fall in apprenticeship starts in 2014, but appear to draw opposite conclusions. The LPC (LPC, 2015, p.269) took the view that a high rate was stopping employers taking on apprenticeships and that a substantial increase in the AR may increase non-compliance, which was already exceptionally high among apprentices. While the Government’s specific rationale for choosing a higher rate was not stated in the press releases, the implication is that the AR was too low to attract candidates.
1.3
Previous work on the AR
Drew, Ritchie and Veliziotis (2015, henceforward DRV) reviewed previous work on apprentice pay, noting that there were significant differences between frameworks, and that analyses of the 2011 and 2012 APS carried out by the APS survey team showed extremely high levels of non-compliance1. DRV also analysed the 2011/2012 APS and 2013/2014 ASHE microdata, and had access to summary results from the 2014 APS. They concluded that, while there were problems with the APS data, non-compliance appears to be significantly higher for apprentices than for other workers. It could be argued that this is just the ‘bedding down’ of the Apprentice Rate (AR) introduced in 2010. However,
1 For a more detailed analysis of the problems with the old APS, see Drew, Ritchie and Veliziotis (2014). DRV
9 there does not seem to be much empirical support for this. All surveys (APS 2011, 2012 and 2014, and ASHE 2013 and 2014) show continuing high rates of non-compliance compared with other groups. Non-compliance is not limited to those on the AR, but also includes apprentices who are eligible for the age-applicable minimum wage; in fact, non-compliance is significantly higher for the latter group.
Hence, the higher rate of non-compliance for apprentices appears real and persistent. DRV used descriptive and multivariate analyses, but concluded that there was little which seemed systematically related to the probability of non-compliance. There were suggestions that being in the public sector, working for a large organisation, and greater job protection are indicators of compliant wages, but these results were not robust. Similarly, there were weak, but only weak, indications of sectoral differences. The exception to this was that apprentices who were eligible for the age-applicable minimum wage (aged 19 or over, and not in the first year of training) were more likely to receive wages below that minimum. This result was manifest across all data sources and all periods.
This raises the possibility that apprentices and/or employers do not understand the rules. A second possibility is that some or all understand the rules, but choose to ignore them – perhaps an apprentice is afraid of being fired, or has been told that a very low wage keeps the business going, or is just wanting to ‘help’. Statistical analyses cannot distinguish between these effects.
DRV noted the surprising lack of correlation between ‘awareness’ of the AR and the probability of non-compliance. This may be due to the ambiguity of the question. The 2014 APS clarified the question and found that while around 62% of apprentices in Great Britain are aware of the existence of the AR, only 26% of them claimed to know the actual rate for apprentices (IFF Research, 2014; see also our own analysis below). This relative lack of knowledge of the exact AR means that, potentially, there is substantial scope for non-compliance. At the same time, it also begs the question of whether power relationships override statutory duties – one may be aware that one is paid below the rate, but be unable to address the problem.
Finally, training hours are problematic. Hourly wage calculations should take account of both off- and on-the-job training, as well as regular work, and there is a concern that not all of it is (and so the hourly wage is being overstated). DRV noted that only limited inferences could be made about the training from the APS 2011 and 2012, despite the detailed questions. In response to this ambiguity, the working hours and training questions were substantially modified in APS 2014.2 ASHE has no data on training hours; DRV investigated whether training could be inferred from variation in paid hours between apprentices and others in ASHE, but could come to no robust conclusions.
In summary, there is agreement that non-compliance is significantly higher for apprentices than other groups; that non-compliance appears to be largely random (few robustly significant influences), apart from becoming eligible for the higher age-applicable minimum wage; and that data difficulties have limited the scope of the analysis.
2 The APS 2014 respondents are now given the opportunity to record their total hours of work as an
10
1.4
Aims of this study
The previous statistical analyses identified where problems were occurring, but are of limited value in distinguishing between hypotheses. For example, on observing a non-compliant wage, there is no information allowing us to ascribe this to lack of knowledge on the part of the employer or employee, power relations, or economic conditions which might have led to this outcome.
DRV also highlighted the large difference between compliance estimates from sources; ASHE is consistently lower than APS. This is consistent with findings comparing general wage distributions from the Labour Force Survey (LFS) and ASHE, but the distribution of LFS and ASHE is similar, whereas the APS seems more attenuated at specific values.
DRV’s analysis was limited by the availability of data. APS 2011 data were felt to be reliable, the APS 2012 data were not, and the APS 2014 microdata were not available; the latter are now available but the survey has been substantially revised to address methodological shortcomings making it difficult to compare estimates from the 2012 and 2014 surveys. ASHE 2013 was made available in 2014 after long negotiations with ONS, but the limited sample size meant only simple analyses could be carried out. ASHE 2014 was made available in late November 2014, and preliminary analyses could be done; but much of the richness in ASHE (particularly the use of longitudinal elements) was not used. DRV noted these limitations and proposed extending analysis on all five datasets.
Accordingly, this project has two aims: to provide evidence for competing hypotheses of why wages are being paid below the minimum; and to exploit the increased microdata. These lead to the research questions for this report, outlined below:
On understanding the previous analyses through qualitative research:
Do apprentices/and or employers understand the laws on training hours?
Are apprentices unaware of their rights, or are they aware but unable to enforce them? Are employers aware of the AR?
If they are aware, do they know how it works/how to calculate it? On extending the previous analysis through the use of more and better data:
Why is there a gap between ASHE and APS estimates?
Can a more detailed analysis of the data (especially the revised questions in the APS 2014) shed light on DRV’s conclusion that non-compliance is largely random?
1.5
Methods
1.5.1 Qualitative analysis
11 focused on two sectors which appear to have the most compliance problems (and which are also of interest to the LPC): child care and hairdressing.
In line with Silverman (2013), the qualitative stage aimed to produce a deeper understanding of the data generated by the statistical analysis. The interviews provide rich data on explanations for non-compliance, awareness of apprentice rates in both apprentices and employer populations and the impact of training hours. In addition, in the case of children's care and hairdressing apprentices, this research aimed to analyse the experiences of vulnerable and marginalised groups of low-paid workers, and hence support policy interventions to address wage discrepancies for these strata of the labour market.
1.5.2 Quantitative analysis
The interviewing process collected anonymous data from apprentices via questionnaires, post-focus group. This provided some additional quantitative information, albeit without the quality control of a formal survey.
The main quantitative analyses in this report focus on the 2014 APS. As described below, we are confident that the methodology of the APS 2014 is a substantial improvement on that of the previous APS. A positive note is that many findings from the 2014 APS are similar to those of the previous studies, but they appear to be much more robust. Unfortunately, the opportunity to combine all APS datasets is limited by the lack of overlapping variables, and hence this report mainly focuses on the 2014 APS. However, some framework-level analysis, based on pooling the data from the three APS datasets, is also presented below.
The report also uses both the 2013 and 2014 ASHE data. Analyses showed very little qualitative difference between the two surveys, and hence they were analysed jointly, improving the sample size. ASHE 2015 data was made available to the research team in December 2015, and showed similar results. Hence, all three ASHE datasets are analysed jointly, mostly without distinction between years.
2. Quantitative analysis
2.1
Understanding the Apprenticeship Pay Survey
This section discusses the characteristics of the 2014 APS. Because the construction of hours and earnings variables is complex, Appendix A2 gives a detailed breakdown of the steps needed to create the data and of potential problem areas.
2.1.1 General aspects of the APS series
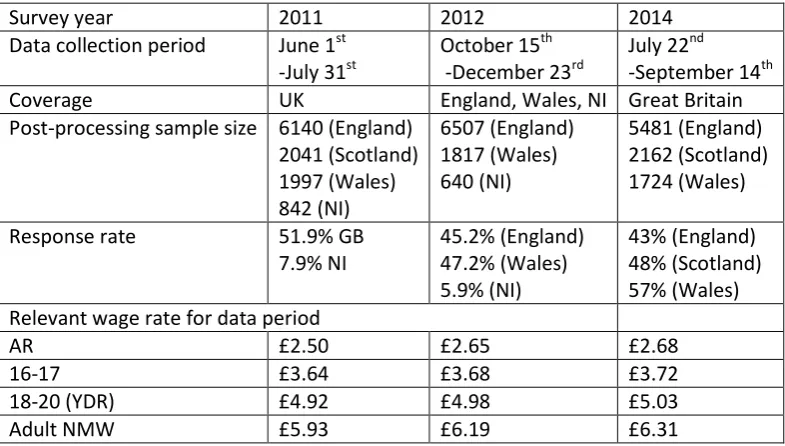
Table 2 describes the three APS, conducted in 2011, 2012, and 20143. DRV analysed the first two of these in great detail, while this report is mainly based on the analysis of APS 2014. Important changes in the APS were undertaken for the 2014 round (following also recommendations made
3 There were also apprentice pay surveys carried out in 2005 and 2007; these predate the NMAR and have a
12 from the preliminary work of DRV); these are outlined in IFF Research (2014, pp.33-34) and are pointed out in the text that follows when it is deemed necessary.
Table 2 Characteristics of the APS 2011, 2012 and 2014
Survey year 2011 2012 2014
Data collection period June 1st -July 31st
October 15th -December 23rd
July 22nd -September 14th
Coverage UK England, Wales, NI Great Britain
Post-processing sample size 6140 (England) 2041 (Scotland) 1997 (Wales) 842 (NI) 6507 (England) 1817 (Wales) 640 (NI) 5481 (England) 2162 (Scotland) 1724 (Wales)
Response rate 51.9% GB
7.9% NI 45.2% (England) 47.2% (Wales) 5.9% (NI) 43% (England) 48% (Scotland) 57% (Wales) Relevant wage rate for data period
AR £2.50 £2.65 £2.68
16-17 £3.64 £3.68 £3.72
18-20 (YDR) £4.92 £4.98 £5.03
Adult NMW £5.93 £6.19 £6.31
Source: Drew et al. (2015) and IFF Research (2014).
Note that the data collection periods of the 2011 and 2014 surveys are better timed than the 2012 one. The 2012 survey took place just after the introduction of the new minimum rates in October 2012. This could be an important factor behind the substantially higher non-compliance rates observed in that year (see below and DRV): the pay cited by respondents may have referred to the previous pay period, so appearing non-compliant at the time of interview. No such concerns can be raised for the 2011 and 2014 surveys, since both took place close to the end of the respective minimum wage periods.
2.1.2 Sample selection for analysis
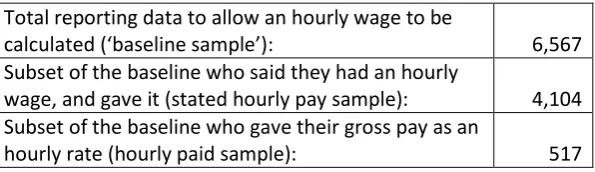
In the following analysis we focus on the APS 2014 sample of Level 2 and Level 3 apprentices for Great Britain as a whole. We drop observations with missing values for any of the variables that appear in the multivariate analysis of non-compliance that will be reported below, in order to keep a consistent sample of apprentices across all descriptive and regression analyses in this report. We also drop all cases for which hourly pay could not be calculated (see IFF Research, 2014). After these choices, we end up with a sample of 6,567 apprentices. This is the baseline sample in the analyses that follow. Due to the above restrictions, our estimates and reported results are slightly different from those appearing in the published APS 2014 report (IFF Research, 2014).
13 who stated their gross pay as an hourly rate, of which there are 517 respondents. Table 3 summarises the subsets:
Table 3 Number and size of analysis subsets Total reporting data to allow an hourly wage to be
calculated (‘baseline sample’): 6,567
Subset of the baseline who said they had an hourly
wage, and gave it (stated hourly pay sample): 4,104 Subset of the baseline who gave their gross pay as an
hourly rate (hourly paid sample): 517
In all tables and graphs that follow we note whether the sampling weights available in the published survey dataset have been used or not for the calculations, tabulations, and estimates reported. As a rule, all calculations of sample means and descriptive statistics that are presented in order to draw inferences for the whole population of apprentices are based on weighted data. All the rest of the presented results, including multiple regression analyses, are based on unweighted observations. 2.1.3 Description of the pay distribution among apprentices
There are two main variables of pay calculated by IFF Research (2014) and used in their analysis. The first is a measure of the ‘basic gross hourly pay’. This excludes all extra/overtime pay and hours and does not take account of any accommodation offsets, bonuses, tips etc. The second is a measure of the ‘NMW gross hourly pay’, which is calculated in order to accurately estimate non-compliance with the NMW legislation. To achieve that, all unpaid overtime hours and paid overtime hours remunerated at the standard rate are taken into account, while adjustments are also made for accommodation provision and charges (see IFF Research, 2014, pp. 34-35). Overtime paid at a higher rate, tips, bonuses and other such extra payments are not taken into account. We use this latter measure of hourly pay when we examine non-compliance in more detail below. For this section, we briefly focus on the basic gross hourly pay (using the restricted ‘stated hourly pay’ sample described above).
The measurement of gross hourly pay in the APS 2014 is a complex issue and depends on the way earnings and hours of work data are reported in the survey (see Appendix A2). Since it involves a series of calculations (e.g. conversions from net to gross pay, from monthly to weekly pay etc.), the resulting gross hourly pay may be calculated with considerable measurement error. DRV, Ritchie et al. (2014) and Fry and Ritchie (2013) discuss the details of such issues in great depth, based on the analysis of both the past APS surveys and other official data sources (ASHE, LFS etc.).
14 that apply to apprentices (£2.68, £5.03, and £6.31), as well as some ‘sensible’ or ‘focal’ rates (Fry and Ritchie, 2013; DRV), such as £4, £5 etc.
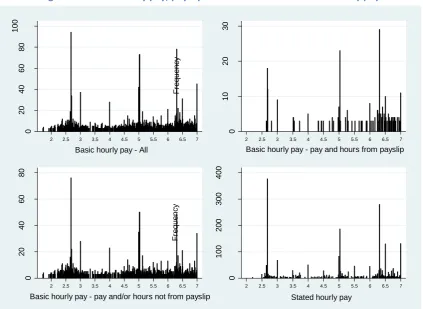
Figure 1 Derived hourly pay, payslip information and the stated hourly pay
Source: Authors’ calculations; APS 2014, unweighted data, stated hourly pay sample
An intuitive way to judge the accuracy of hourly rate calculations is to compare apprentices that report both pay and hours from their payslips with those that do not. This is similar to what DRV did by comparing hourly to non-hourly pay respondents in APS 2011 and 2012. The upper right and lower left panels in Figure 1 present this comparison. A much less dispersed and (seemingly) more accurate picture can be observed for those reporting both pay and hours from their payslips. It should be noted that all these rates are derived ones, since payslip respondents could not directly report a gross hourly rate. Nevertheless, a larger proportion of apprentices that use their payslip for providing both pay and hours of work information seem to earn an hourly rate that is either equal to one of the legal minima or to a ‘sensible’ number (see upper right panel in Figure 1).
As a further comparison, we also checked the distribution of responses in the additional question that asked apprentices to report directly their hourly pay (stated hourly pay – see above), if they knew it. Since we use the same sample of apprentices throughout in this section (based on those that do indeed provide a stated hourly pay), the comparison between the derived hourly pay and the stated hourly pay is a direct one and based on the same persons. By looking at the upper left and the lower right panels of Figure 1, the difference seems a startling one (note the different scaling on the y-axis): the stated hourly pay distribution shows a much smaller variation, with greater frequencies and proportions of numbers on the various legal minima and on some ‘sensible’ rates. This is
0 20 40 60 80 100 Fr e q u e n c y
2 2.5 3 3.5 4 4.5 5 5.5 6 6.5 7
Basic hourly pay - All
0 10 20 30 Fr e q u e n c y
2 2.5 3 3.5 4 4.5 5 5.5 6 6.5 7
Basic hourly pay - pay and hours from payslip
0 20 40 60 80 Fr e q u e n c y
2 2.5 3 3.5 4 4.5 5 5.5 6 6.5 7
Basic hourly pay - pay and/or hours not from payslip
0 100 200 300 400 Fr e q u e n c y
2 2.5 3 3.5 4 4.5 5 5.5 6 6.5 7
15 something to be expected and replicates the findings in DRV concerning their comparison between the hourly and non-hourly paid in APS 2011 and 2012.
2.2
Non-compliance
2.2.1 Overall non-compliance
Non-compliance with the relevant NMW rate in APS 2014 can be estimated through a more complex, but also more accurate, procedure relative to APS 2011 and 2012 (IFF Research, 2014). Questions about working and training hours have been improved and should be considered much more accurate, since it is now made clear to respondents what working and training is and how to arrive at a final answer concerning all relevant hours that should be remunerated. Also, unpaid overtime is now taken into account and included in the denominator of the formula that derives the gross hourly pay to be used for identifying non-compliance. Finally, if accommodation is provided by the employer, this is taken into account in the earnings measure. After all these adjustments, an ‘NMW gross hourly pay’ is derived for apprentices in the sample.
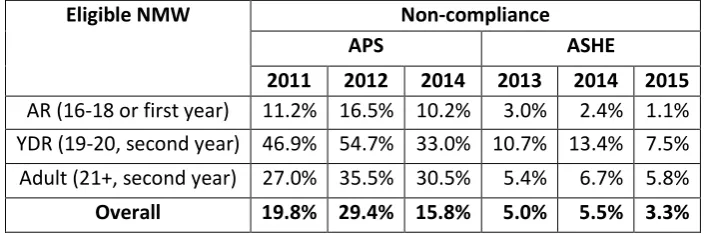
[image:15.595.121.474.411.528.2]We start our analysis by presenting basic tabulations of non-compliance incidence. Table 4 shows all estimates of non-compliance from all available sources (APS and ASHE) since 20114. Note that the ASHE estimates are lower than the official LPC ones. This seems to be because the LPC data is weighted; we have concerns about the ASHE weights (see below) and hence we use unweighted data.
Table 4 Overall non-compliance rates for apprentices
Eligible NMW Non-compliance
APS ASHE
2011 2012 2014 2013 2014 2015
AR (16-18 or first year) 11.2% 16.5% 10.2% 3.0% 2.4% 1.1% YDR (19-20, second year) 46.9% 54.7% 33.0% 10.7% 13.4% 7.5% Adult (21+, second year) 27.0% 35.5% 30.5% 5.4% 6.7% 5.8%
Overall 19.8% 29.4% 15.8% 5.0% 5.5% 3.3%
Source: Authors’ calculations; APS 2011, 2012 and 2014, weighted; ASHE 2013-15, unweighted. Non-compliance rates in ASHE reported as a proportion of the sample of identified apprentices.
In our final selected sample from APS 2014, non-compliance is estimated at around 16%. The pattern of much higher non-compliance among second year apprentices noted by DRV for the APS 2011 and 2012 data is also apparent in the 2014 data; this is something also observed in ASHE. The APS 2014 survey also reveals a reduction in compliance relative to 2011 (the unusually high non-compliance estimated in the 2012 data is an unreliable estimate due to issues with the timing of the survey; see DRV for more details). However, it is difficult to conclude whether this represents an actual fall in non-compliance or just a difference due to the different survey structure and pay and hours questions in 2014. What is more certain is that the improvements in the 2014 survey provide some reassurance that the 2014 estimate is a more reliable one.
4
16 Looking at differences in non-compliance based on the way pay and hours data were reported and collected in APS 2014 reveals some interesting findings. These indicate the importance of understanding measurement issues behind any estimate of non-compliance, particularly when that estimate is based on data reported by employees. Table 5 reports the estimates split by data source.
Table 5 Extent of non-compliance for apprentices, by APS source
% of apprentices earning below their legal minimum
Baseline sample (N=6,567) 15.8%
Payslip respondents (N=2,698) 12.0%
Non-payslip respondents (N=3,869) 20.7%
Both pay and hours from payslip (N=1,074) 5.7% Reporting hourly paid only (N=517) 3.8% Notes: Source APS 2014, authors’ calculations; weighted data
Importantly, factors that should improve reporting accuracy in pay and hours seem to lead to a reduction in non-compliance: respondents that used a payslip to answer their earnings questions are less likely to be non-compliant than respondents that did not use a payslip (12% versus 21%, respectively).
Moreover, non-compliance incidence is even lower if both pay and hours are reported directly from the apprentice’s payslip: an incidence of around 6% is estimated among such apprentices. This may indicate that actual non-compliance is lower than the 15-16% headline rate found for the whole sample and reported in the first line of Table 4 and also in IFF Research (2014). In line with the findings in DRV, much lower non-compliance is also observed for apprentices that report an hourly pay. This should be expected from a measurement error perspective given that no extra calculations based on reported working and training hours need to be made in order to arrive at a gross hourly pay rate. As noted above, though, there are relatively few (517) people that provide hourly pay in the core earnings questions in APS. The small sample size means that we should be somewhat cautious in interpreting this result.
2.2.2 Reconciling ASHE and APS
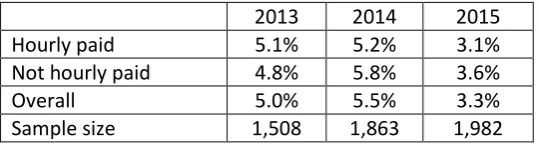
The payslip-based APS figures are much closer to the ASHE data; see Table 6. Table 6 Non-compliance rates for apprentices in ASHE
2013 2014 2015
Hourly paid 5.1% 5.2% 3.1%
Not hourly paid 4.8% 5.8% 3.6%
Overall 5.0% 5.5% 3.3%
Sample size 1,508 1,863 1,982
Source: ASHE 2013-2015, authors’ calculations, unweighted.
[image:16.595.164.434.629.702.2]17 One concern of the LPC is that there is a substantial difference between APS and ASHE compliance rates. It is clear from Tables 5 and 6 that when information is taken directly from payslips (a subset in APS, and – in theory – all data in ASHE) the difference narrows or even disappears.
Hence, one reason for the difference between the two surveys may be measurement error caused by the lack of documentation. This would imply that ASHE is the more accurate measure of non-compliance, as all data collection is supposed to come from the pay records of the employer.
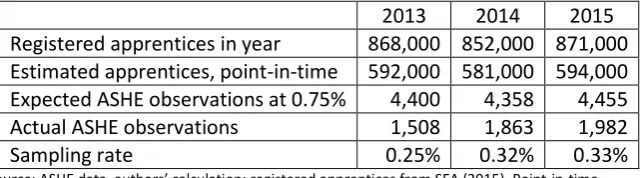
[image:17.595.138.460.264.353.2]However, ASHE only appears to be identifying an unexpectedly small proportion of apprentices. ASHE is intended to pick up 1% of the working population; actual response rates are around 0.75%. In the case of apprentices, sampling rates are much lower:
Table 7 Sampling rates in ASHE
2013 2014 2015
Registered apprentices in year 868,000 852,000 871,000 Estimated apprentices, point-in-time 592,000 581,000 594,000 Expected ASHE observations at 0.75% 4,400 4,358 4,455
Actual ASHE observations 1,508 1,863 1,982
Sampling rate 0.25% 0.32% 0.33%
Source: ASHE data, authors’ calculation; registered apprentices from SFA (2015). Point-in-time apprentices estimated by adjusting to weighted APS estimate (581,000 in 2014)
In other words, the ASHE sampling rate appears to be less than half the expected rate if apprentices were sampled at the same rate as other employees. This is not a problem if ASHE is representative of the apprentice population, but this might not be true for four reasons.
First, the missing apprentices in ASHE are disproportionately likely to be low earners changing jobs frequently (see Knight, 2010). It seems reasonable that the observed ASHE sample is made up of individuals in more stable employment with well-established employers.
Second, APS respondents not using documentation to complete the survey may be the result of poor administrative practices on the part of the employer. This lowers the likelihood that, for example, the tax authorities will be made aware of an employee in a timely manner if at all, and so may not include them in ASHE. The lack of documentation may reflect cash-in-hand payment rather than traceable earnings.
Third, ASHE and APS data agree when payslips are being referenced, but employees in APS may not want to reference payslips if they are aware of being very low paid. This relates back to concerns about power relationships, where employees may accept unlawful wages as they believe this is necessary to retain their job. It could also be argued that employees in this position would simply lie about their wages, but this would imply higher compliance among those without payslips, which is not observed.
18 In summary, while the APS and ASHE broadly agree on the non-compliance rates for fully documented earnings, the low sampling rates for ASHE are likely to be biased towards compliant observations; hence, the ASHE compliance data can be taken as a ‘lower bound’ for non-compliance.
This perspective is supported by the qualitative analysis, reported below, which found that apprentices change employers much more frequently than they change courses. As the sampling frame for the APS is the Individual Learner Record (and hence the course), this suggests the APS is more likely to be representative of the apprentice population. This does also suggest that the sampling rate for the APS may fall when employer-managed training is brought in in 2017.
2.2.3 Non-compliance by relevant minimum
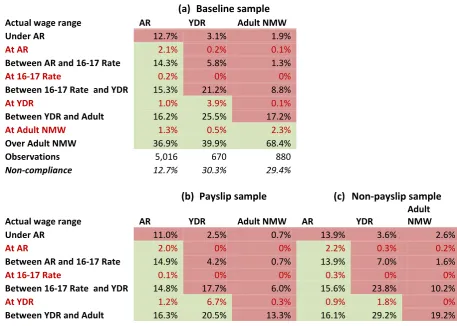
[image:18.595.67.525.438.764.2]Table 8 gives a more detailed breakdown of the exact distribution of hourly pay responses for each subgroup presented in Table 5. We now tabulate the extent of non-compliance for each relevant minimum wage rate, looking also at percentages paid at or between the different rates. For example 2.1% of those in the whole sample which are eligible for the AR are paid it, whereas 14.3% of apprentices eligible for the AR are paid between the AR and the 16-17 year-old rate. Cells which indicate non-compliance are marked in dark red; cells which indicate compliance are marked in light green, while total non-compliance for each MW group is indicated in italics below the number of observations. The 16-17 year-old rate is not represented in the columns as 16-17 year-old apprentices are covered by the AR. However, this is included in the rows as apprentices may be (lawfully) paid this rate.
Table 8 Non-compliance, by relevant MW (APS 2014), various samples
(a) Baseline sample
Actual wage range AR YDR Adult NMW
Under AR 12.7% 3.1% 1.9%
At AR 2.1% 0.2% 0.1%
Between AR and 16-17 Rate 14.3% 5.8% 1.3%
At 16-17 Rate 0.2% 0% 0%
Between 16-17 Rate and YDR 15.3% 21.2% 8.8%
At YDR 1.0% 3.9% 0.1%
Between YDR and Adult 16.2% 25.5% 17.2%
At Adult NMW 1.3% 0.5% 2.3%
Over Adult NMW 36.9% 39.9% 68.4%
Observations 5,016 670 880
Non-compliance 12.7% 30.3% 29.4%
(b) Payslip sample (c) Non-payslip sample
Actual wage range AR YDR Adult NMW AR YDR
Adult NMW
Under AR 11.0% 2.5% 0.7% 13.9% 3.6% 2.6%
At AR 2.0% 0% 0% 2.2% 0.3% 0.2%
Between AR and 16-17 Rate 14.9% 4.2% 0.7% 13.9% 7.0% 1.6%
At 16-17 Rate 0.1% 0% 0% 0.3% 0% 0%
Between 16-17 Rate and YDR 14.8% 17.7% 6.0% 15.6% 23.8% 10.2%
At YDR 1.2% 6.7% 0.3% 0.9% 1.8% 0%
19
At Adult NMW 1.4% 0.4% 3.3% 1.3% 0.5% 1.7%
Over Adult NMW 38.3% 48.1% 75.8% 35.9% 33.9% 64.5%
Observations 2,112 283 302 2,904 387 578
Non-compliance 11.0% 24.4% 21.0% 13.9% 34.7% 33.8%
(d) Pay & hours from payslip (e) Hourly paid sample
Actual wage range AR YDR Adult NMW AR YDR
Adult NMW
Under AR 3.6% 0% 0.7% 3.0% 2.0% 0%
At AR 2.3% 0% 0% 10.8% 0% 0%
Between AR and 16-17 Rate 10.3% 4.8% 0% 6.8% 4.0% 0%
At 16-17 Rate 0.4% 0% 0% 0.5% 0% 0%
Between 16-17 Rate and YDR 13.3% 8.7% 1.5% 9.8% 16.0% 0%
At YDR 2.0% 6.4% 0% 4.8% 10.0% 0%
Between YDR and Adult 16.1% 24.6% 8.9% 11.2% 28.0% 3.0%
At Adult NMW 3.1% 0% 3.0% 7.0% 2.0% 11.9%
Over Adult NMW 49.0% 55.6% 85.9% 46.3% 38.0% 85.1%
Observations 813 126 135 400 50 67
Non-compliance 3.6% 13.5% 11.1% 3.0% 22.0% 3.0%
Notes: Source APS 2014, authors’ calculations; unweighted data.
Again, the pattern of lower overall non-compliance is apparent for apprentices reporting from a payslip (especially if they report both pay and hours from it) and for the hourly paid. What is also evident from this table is that these document-holding apprentices are more likely to have an hourly wage equal to some of the minimum rates (the AR, the 16-17 rate, the YDR, or the Adult NMW). For example, while only 1.8% of non-payslip apprentices eligible for the YDR are observed earning this rate (sub-table c), this percentage rises to 6.7% for payslip apprentices (sub-table b) and to 10% for hourly paid ones (sub-table e). Similar examples can be given for all relevant minimum rates. This reinforces our conclusion that responses using a payslip or reporting an hourly pay lead to a more accurate estimate of the hourly wage. A similar finding was reported for APS 2011 and 2012 by DRV, who compared responses between hourly and non-hourly paid apprentices.
20 Table 9 Non-compliance by relevant MW (APS 2014), allowing for ±1p error
Baseline sample, raw Allowing for +/- 1p
Actual wage range AR YDR Adult NMW AR YDR Adult NMW
Under AR 12.7% 3.1% 1.9% 12.4% 3.0% 1.9%
At AR 2.1% 0.2% 0.1% 3.2% 0.3% 0.1%
Between AR and 16-17 Rate 14.3% 5.8% 1.3% 13.4% 5.8% 1.1%
At 16-17 Rate 0.2% 0% 0% 0.5% 0.3% 0.1%
Between 16-17 rate and YDR 15.3% 21.2% 8.8% 15.0% 20.5% 8.5%
At YDR 1.0% 3.9% 0.1% 1.4% 4.3% 0.3%
Between YDR and Adult 16.2% 25.5% 17.2% 15.7% 25.4% 16.8%
At Adult NMW 1.3% 0.5% 2.3% 1.8% 0.6% 2.7%
Over Adult NMW 36.9% 39.9% 68.4% 36.8% 39.9% 68.3%
Observations 5,016 670 880 5,016 670 880
Non-compliance 12.7% 30.3% 29.4% 12.4% 29.9% 28.8%
Notes: Source APS 2014, authors’ calculations; unweighted data.
The changes are not very notable. One can now observe higher percentages clustered at each minimum rate, but the differences are not that large. In contrast to the ASHE 2013 and 2014 data (see DRV, p.23), allowing for rounding error in APS 2014 does not drastically change the distribution of hourly pay and, thus, the extent of non-compliance. A similar conclusion can be drawn for each subgroup in Table 7, if we allow for rounding error (results not reported).
Finally, it should be noted that only a small amount of underpayment occurs at one of the other minimum wages. This would suggest that the underpayment is not the result of payment at minimum wages being unchanged when the apprentices moves from one rate to another.
2.3
Awareness of NMW and non-compliance
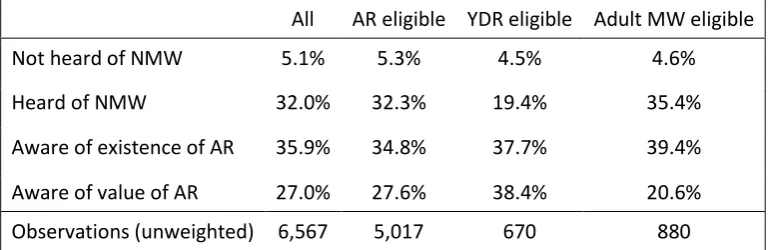
The new APS 2014 included a series of improved questions concerning the awareness of apprentices about the NMW legislation and the minimum wage rate for apprentices (the AR). Specifically, all respondents were first asked if they have heard of the NMW. If yes, they were then asked if they are aware that there is a NMW rate for apprentices. If they responded positively again, they were finally asked if they know what this hourly minimum for apprentices is. Based on these questions, we construct four mutually exclusive categories of apprentices based on their knowledge of the NMW legislation. Table 10 reports the percentages belonging to each category, for each group of apprentices according to their relevant minimum.
Table 10 NMW awareness (APS 2014)
All AR eligible YDR eligible Adult MW eligible
Not heard of NMW 5.1% 5.3% 4.5% 4.6%
Heard of NMW 32.0% 32.3% 19.4% 35.4%
Aware of existence of AR 35.9% 34.8% 37.7% 39.4%
Aware of value of AR 27.0% 27.6% 38.4% 20.6%
Observations (unweighted) 6,567 5,017 670 880
[image:20.595.106.493.614.739.2]21 It can be seen that most apprentices are at least aware of the NMW legislation in general. Only around 5% of apprentices (in all groups) have not heard of the NMW. However, only a minority of apprentices actually knows the specific value of the AR, with only around 28% of AR-eligible apprentices knowing its exact value. This surely seems a cause for policy concern, particularly if the aim is to effectively deal with non-compliance through increased awareness among apprentices in Great Britain. In contrast, the most knowledgeable group in this respect is that of the YDR-eligible apprentices (19-20 year olds, past their first year on the course), with about 38% of them knowing the specific rate (the AR might not apply to them, but they should have a rough idea having been paid a similar amount in previous years). Apprentices with the adult NMW as their relevant minimum appear to have the most limited knowledge of the AR value.
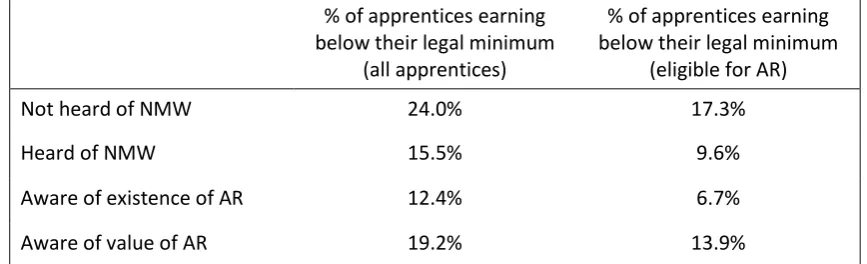
[image:21.595.80.514.334.466.2]Turning now to the link with non-compliance, Table 11 presents non-compliance incidence, for all apprentices and for those eligible for the AR, by NMW awareness; for example, amongst those who have not heard of the NMW, non-compliance is 24% amongst all apprentices, and 17.3% amongst those who are eligible for the AR.
Table 11 Extent of non-compliance, by NMW awareness (APS 2014)
% of apprentices earning below their legal minimum
(all apprentices)
% of apprentices earning below their legal minimum
(eligible for AR)
Not heard of NMW 24.0% 17.3%
Heard of NMW 15.5% 9.6%
Aware of existence of AR 12.4% 6.7%
Aware of value of AR 19.2% 13.9%
Notes: Source APS 2014, authors’ calculations; weighted data
22
2.4
Multiple regression analysis of non-compliance and awareness
In this section we describe the results of different multivariate analyses of the data, which aim to identify the direction and relative importance of multiple variables in determining compliance, awareness and wage levels. As the statistical results are many, the detailed tables are given in Appendix 1 and are summarised here.
2.4.1 Factors associated with non-compliance
In this subsection we proceed by examining non-compliance in a multiple regression framework. This way we can identify which factors that seem at first sight to be correlated with non-compliance remain so when one controls for a range of other factors. The analysis closely follows that presented in DRV, but differs in some ways due to the differences in APS 2014 compared with past APS data. A series of models of non-compliance were estimated, each one for a different group of apprentices. Specifically, we estimated a different model for each of the five groups shown in Table 5: for the baseline sample, the payslip sample, the non-payslip sample, the ‘both pay and hours from payslip’ sample, and the hourly paid sample. Since the dependent variable in all cases is a binary indicator of non-compliance, probit models are estimated via the maximum likelihood method for the first four samples. For the hourly paid sample, we estimate a linear probability model using OLS, since the sample size in this case is a relatively small one (N=517).
A series of personal, job, course and survey structure variables are entered in the model as the possible correlates of non-compliance (Table A1 in Appendix 1 presents the means of all variables for each of the five samples). Table A2 in Appendix 1 reports the whole range of regression results. Starting from the three specifications which we judge as more reliable since they are based on a larger sample size (whole, payslip, and non-payslip samples), we can summarize the main results as follows:
Gender and race do not seem to be significantly related to non-compliance incidence. A qualification can be made here for the male effect, since the male dummy acquires a large, statistically significant, and negative coefficient for the non-payslip specification. On the other hand, the ‘white’ coefficient is very small and insignificant throughout.
Non-compliance is around 3-4 percentage points (p.p.) lower in Scotland than in England or Wales. This is a strong finding, consistent in all first three specifications.
Another strong result is the higher non-compliance observed, ceteris paribus, for Level 2 apprentices relative to Level 3 ones. A difference though can be observed in this case between the payslip and the non-payslip sample: the effect is significantly larger in the second case.
Due to the small number of apprentices (71 in the whole sample) with disabilities or learning difficulties, the effect of this variable appears inconsistent across the different specifications. It would be unwise then to draw any definitive conclusion regarding this variable, given also the imprecise estimate we get for the whole sample.
23 hourly pay rate that is non-compliant. There is an almost linear relationship between age and non-compliance in this case. Second, apprentices aged 19 or over and in their second year of the course and, thus, eligible for a higher legal minimum than the AR, are more likely to experience non-compliance. The effect here is particularly strong: around 20 p.p. higher incidence of non-compliance is observed among apprentices aged 21 and over in Year 2 or above, compared with apprentices aged between 16-18 years and in their first year of the course. The pattern of these two results is similar in the first three specifications (1) to (3), where most information is not based on payslip data. Moreover, the consistency of this finding across all APS analyses points to important and policy-relevant conclusions: either a limited understanding by employers and/or employees of the rules governing the minimum wage for apprentices, or a conscious choice by employers to avoid the higher labour costs associated with older apprentices past their first year, are things that need to be addressed in order to achieve a reduction in overall non-compliance.
Consistent with previous findings, as well as the tabulations provided in IFF Research (2014), the apprenticeship framework seems to be strongly related to non-compliance, even when a range of other factors is controlled for in a multiple regression setting. In particular, significantly higher non-compliance is observed in hairdressing and in children’s care, while non-compliance is significantly lower in the more modern electrotechnical, engineering, business and management frameworks. These results are in general robust across the different specifications. They again point to the need for qualitative research to get a better understanding of the pay and hours practices in the more non-compliant frameworks like hairdressing, something that we contribute to in the second part of this report.
There is evidence that some indicators of job quality are significantly related to non-compliance. Having a contract, being in a permanent post and having a longer tenure with current employer, are all negatively related to the probability of receiving a wage below the eligible minimum.
Regularly receiving tips is not associated with non-compliance in our data. On the other hand, receiving bonuses seems to be negatively related to non-compliance. Since bonuses do not appear to be used (illegally) as a substitute for regular pay, this result may point to more profitable employers that offer higher quality and better remunerated jobs.
24 relative to the non-hourly paid. This should be mainly related to the fact that not many extra calculations need to be made to arrive at the rate which will be judged against the eligible minimum rate for the identification of non-compliance.
The results taken in the multiple regression framework concerning the relationship between awareness with the NMW legislation and non-compliance, differ a bit from the simple relationships we reported above. Specifically, having heard about the NMW does not cause a significant change in non-compliance relative to a situation where the apprentice has not heard of the NMW. What seems to matter more for non-compliance, and in the expected direction, is increased knowledge concerning the AR. Both apprentices that know the existence of an AR and those that know its value, are significantly less likely to earn a wage less than their legal minimum than those that just know about the NMW or have not even heard about the latter. A slightly bizarre finding (also mentioned in the previous section) has to do with the lower non-compliance observed among apprentices that are aware of the AR than those that additionally know the specific value of the AR. However, this difference is not as pronounced as in Table 11, and in the case of the non-payslip sample is not even statistically significant at a conventional level of confidence.
The above summarize the main results for the more robust specifications (1-3) reported in Table A2 in Appendix 1. As mentioned above, in addition to these specifications, we also estimated two models of non-compliance (see specifications 4 and 5) for two substantially smaller samples: one for those apprentices that report both their pay and hours from their payslip (N=991), and one for those that directly report an hourly pay in the core earnings questions of the survey (N=517). Although sample sizes are much smaller, this should be partly offset by the expected greater accuracy of the hourly wage. Perfect prediction and the possibility of obtaining inconsistent maximum likelihood estimates led us to estimate an OLS regression for the smaller hourly-paid sample, while perfect prediction meant that some observations and the relevant variables could not be used in the probit model of the hours-and-wages sample.
The above issues with estimation also mean that the results taken here should be treated with some caution. Nevertheless, what emerges from these specifications is a picture of more imprecision in estimates, with a lot more variables than in the first three specifications discussed above failing to achieve statistical significance at a conventional level of confidence. Some of the main results reported above are still observed though. For example, the importance of the age/year of course interaction can still be observed to a certain extent in the ‘both pay and hours from payslip’ sample, while the same is the case with the awareness variables in the hourly paid sample.
Some of the insignificant findings here may also mean that the importance of certain variables in explaining non-compliance no longer applies in these more specific samples. This is the case with some of the system/survey variables. For example, while basic hours and unpaid overtime hours are still negatively related to non-compliance incidence in the restricted payslip sample, this is not the case for the hourly paid sample. This is something to be expected: if there is some measurement error in non-compliance due to the way basic and overtime hours are reported, this fact should not affect the apprentices that directly report an hourly pay.
25 (DRV). In particular, the importance of age and year of course in explaining non-compliance is a recurrent finding and surely a matter of policy concern. We also confirm here that some non-compliance is, at least to a certain extent, related to the way the hourly pay is calculated from earnings and hours data. Finally, the improved questions regarding awareness of the NMW legislation were used and pointed to an important finding: increased levels of awareness, and in particular knowledge about the existence of an AR, are negatively correlated with non-compliance incidence. The policy implications of this finding are obvious. In the following section we examine awareness in more detail.
2.4.2 Awareness
How does awareness of the existence of an AR vary with the personal, course, and job characteristics of apprentices? Since awareness is related to a lower incidence of non-compliance, it seems worthwhile to have an understanding of what determines it in the first place. For this reason, we estimated a series of simple probit models of awareness for the whole sample of apprentices and those that are eligible for the AR. The latter group is the most relevant one in this case, since it is the one that the AR applies to. Table A3 in Appendix 1 reports the whole set of estimates. For each group, we are estimating a model of 1) simple knowledge of the existence of an AR, and 2) knowledge of the specific value of the AR.
The first thing to note is that the results appear in general consistent across the two samples. This is something that should be expected, since a large part of the whole sample consists of AR-eligible apprentices (5,017 out of a total of 6,567 apprentices). Demographic variables are much more important in the case of awareness than in the case of non-compliance. Men are more likely to be aware of the existence of an AR and the specific value of the AR than women, while the ‘white’ coefficient is positive and significant only in the case of awareness of the existence of an AR. On the other hand, apprentices in Scotland and Wales are far less likely than apprentices in England to be aware of the NMW legislation concerning the AR. As we saw above, however, this does not appear to affect their non-compliance differential with apprenticeships in England. It should still be a cause for concern though, if the aim of policy is to limit any differences across different demographic and regional groups in order to raise the overall level of awareness.
Another important result concerns the knowledge of Level 2 apprentices. They are less likely than Level 3 ones to know the AR part of the NMW. This appears as a worrying result, since Level 2 apprentices are also more likely to earn a wage that is below the legal minimum. The results about the age/year of course interactions are not so clear cut and, also, not as intuitive as in the case of non-compliance. Lower awareness is observed for Aged 16-18, second year, and Aged 21+, first year apprentices than Aged 16-18, first year ones; however, these apprentices are also less likely to experience non-compliance than the latter group.
26 2.4.3 Determinants of basic hourly pay
Up to now, we have mainly examined the hourly pay of apprentices only in relation to the eligible NMW rate and, hence, its compliance with legislation. In this section we look more generally at the determination of apprenticeship hourly pay. In particular, we use the log of the ‘basic gross hourly pay’ measure mentioned above as the dependent variable and estimate a standard log-linear regression model of the basic hourly pay on the usual range of characteristics available in the APS 2014 and used up to now in this report. Table A4 in Appendix 1 reports the full set of estimates. When we move beyond non-compliance, the estimated effects of different demographic, course, job and survey characteristics on the basic hourly pay provide some new findings and insights. Male apprentices receive around 6% higher hourly pay than similar female ones. Note, importantly, that this difference does not depend on the differential sorting of males and females on high- and low-paying industries and occupations, since we control for framework in the model. However, we cannot really claim that we have identified some sort of gender discrimination, since there are still many unobservable personal, job and workplace factors that we do not take account of. The same is the case with the nearly 13% lower pay for those apprentices with disabilities or learning difficulties. As we saw above, these pay differences do not lead to higher non-compliance among these groups: the average pay of females and for disabled apprentices may be lower, but this does not lead to an increased probability of them being paid below their eligible minimum rate.
Level 2 apprentices are paid less than Level 3 ones, as expected, consistent with their increased propensity to receive a non-compliant hourly pay. On the other hand, apprentices in Wales and, mainly, Scotland, are better paid than similar apprentices in England. The result for Scotland is in line with the lower incidence of non-compliance across the Scottish sample.
Age and year, of course, depict a positive relationship with average pay. This is a picture that is relatively simpler than the picture shown above concerning non-compliance. For Age 21+ apprentices in their first year of the course, average pay is around 43% higher than that of Age 16-18, Year 1 apprentices. This pattern confirms the lower non-compliance among the older Year 1 apprentices. Average pay also increases with age for Year 2+ apprentices, but this does not seem to be enough to accommodate the increases needed due to the higher legal minimum that needs to be paid, hence the higher non-compliance among the older groups of Year 2+ apprentices.
Differences in pay across frameworks reflect different industrial, occupational and workplace pay structures and practices. Higher pay is observed in apprenticeships such as management, business, electrotechnical, and engineering, with significant pay premiums in customer services as well. On the other hand, significant and large pay penalties are observed in hairdressing and children’s care. These average pay differences broadly correspond to non-compliance differences across frameworks.
27 employers. Receiving bonuses is correlated with higher pay; this reiterates the finding concerning non-compliance and may point to more profitable employers offering better remunerated jobs. Measurement and survey characteristics are also correlated with average hourly pay. As expected, basic hours are negatively related to hourly pay, being included in the denominator of the formula that calculates hourly pay; unpaid extra hours are not as, in contrast to the ‘non-compliant wage’ used earlier, the hourly pay variable here does not use unpaid overtime.
An interesting finding has to do with the significantly higher pay observed for people that use a payslip to provide their information to the survey. Remember that we interpreted lower non-compliance for payslip respondents as an indication of more accurately provided information. Under-reporting of pay and/or over-reporting of hours may be more prevalent among apprentices that do not use a payslip in their answers. This may indeed be the case and also explain our finding here. A different explanation may point to higher quality employers and/or employees: these should be more likely to be found among apprentices that have and use a payslip in their answers. This may also support the argument that ASHE (all fully documented wages; see section 2.2.2) should be interpreted as a lower bound for compliance estimates.
Finally, there is a pay premium for apprentices that are aware of the existence of the AR. On the other hand, no such premium is observed for persons that know the specific value of the AR. This is a pronounced difference, not as in the case of non-compliance, and it may have something to do with the unobserved characteristics of the most knowledgeable group of apprentices.
2.4.4 Framework-level analysis
The purpose of this section is to pool the data from APS 2011, 2012, and 2014 and compare the pay, non-compliance with the NMW, and the characteristics of apprentices across the different frameworks. A comparison between the lowest and the highest paid frameworks (hairdressing and children’s care versus management) also paves the way for the qualitative analysis that follows, which focuses on the hairdressing and child care sectors. We should note from the beginning that because of the need to harmonize the data across the different years and to keep as many observations as possible in each survey, the 2014 sample used in this section differs slightly from the one used up to now in this report.
In DRV’s work, framework-level analysis was constrained by the fact that not many observations were available for each apprenticeship framework. This is no longer the case, since we now have three rounds of APS surveys to utilize. Pooling the data is a fair response, as this analysis and previous ones suggest that, although non-compliance measures are not comparable across surveys, the determinants of wages do seem common to all years. However, the changes in the survey design and questionnaire over the years mean that our analysis is constrained to the common variables; it cannot be as detailed as single-year analyses like the preceding one on the 2014 APS and is more likely to suffer from omitted variable bias; hence the results should be interpreted with more caution.
28 differences (i.e. the different rankings) across frameworks and survey years, and not the absolute numbers. Such a comparison of relative rankings effectively controls for any differences arising from survey design and questionnaire changes across the three APS survey years.
Table 12 Extent of non-compliance, by framework and survey year
2011 2012 2014
1. Hairdressing 47.7% 1. Hairdressing 68.6% 1. Hairdressing 45.1% 2. Construction 31.1% 2. Children’s care 43.0% 2. Children’s care 28.4%
3. Other 27.5% 3. Other 42.4% 3. Other 22.2%
4. Children’s care 26.0% 4. Construction 41.9% 4. Construction 22.0% 5. Engineering 19.6% 5. Electrotechnical 31.0% 5. Electrotechnical 17.7% 6. Electrotechnical 19.1% 6. Business 30.5% 6. Engineering 16.2%
7. Business 14.6% 7. Health 21.0% 7. Business 13.9%
8. Hospitality 13.2% 8. Engineering 20.6% 8. Health 12.5%
9. Health 5.1% 9. Hospitality 19.0% 9. Retail 12.4%
10. Customer 4.7% 10. Customer 18.0% 10. Customer 11.4% 11. Management 4.4% 11. Retail 16.6% 11. Hospitality 9.7% 12. Retail 3.7% 12. Management 3.9% 12. Management 4.3%
Notes: Source APS 2011, 2012, and 2014, authors’ calculations; weighted data.
Although some differences between years in the ranking of the different frameworks according to their non-compliance incidence can be observed, the broad ranking pattern appears quite similar. Specifically, hairdressing is consistently the sector appearing as the most non-compliant one, with a relatively large difference from the sector that is ranked second each year (construction in 2011, children’s care in 2012 and 2014). The children’s care, ‘other’ and construction frameworks always occupy the second, third, and fourth highest places, with ‘other’ consistently appearing in third place. On the other hand, retail, customer services, hospitality/catering, and management are always observed at the bottom of the rank with respect to their non-compliance. Management appears as the most compliant sector in two of the survey years (2012 and 2014), with retail taking that position in 2011. Finally, in the middle of the rank we can always observe the engineering, electrotechnical and business frameworks.
A relevant question that arises here is the following: are these differences across frameworks expected, given the different characteristics of apprentices and apprenticeship jobs in each one of them? A first answer to this question can be given by comparing the structural differences of apprenticeships across the different frameworks. Table A5 in Appendix 1 reports these differences by focusing on a specific subset of the independent variables we have used up to now in this report. Looking only at these specific variables is a choice dictated by the fact that these are the only ones available consistently in all three APS surveys. Note also the large sample size for each framework that can be obtained by pooling the data across the three years: sample sizes as large as 2,675 (for the Engineering framework) are now available.