The effect of water-restriction on various physiological
variables in intensively reared Lacaune ewes
D. Casamassima, F. Vizzarri, M. Nardoia, M. Palazzo
University of Molise, Campobasso, Italy
ABSTRACT: The effects of water restriction on rectal temperature, respiratory rate and selected blood vari-ables in intensively reared Lacaune ewes were evaluated. The tests were carried out over the course of 28 days in spring on 30 lactating sheep divided into three groups of 10 animals each, matched by lactation status and body weight and allocated into individual boxes. The animal groups were as follows: control group W100 with drinking water for the whole day (24 h/24 h), while the two experimental groups each received 80% (W80 group) and 60% (W60 group) of the water ration of the control group, respectively. The feed, in according with physiological and production needs of the animals, was administered in three daily meals (08:00, 14:00 and 20:00 h). Water intake was recorded three times per day (at 08:00, 14:00 and 20:00 h) and the daily feed intake at 08:00 h, while the rectal temperature, respiratory rate were measured and blood samplings were carried out on Day 0, Day 14 and Day 28. In water-restriction groups (W80 and W60) a lower (P < 0.01) feed intake of meadow hay, and a lower ingestion of alfalfa hay pellet in the W60 group compared to W100 group were observed. In addition, the water restriction regimen resulted in a significant decrease of respiratory rate (P < 0.05) and an increase in serum total protein, urea, creatinine, sodium, chlorine, reactive oxygen metabolites, cortisol, haemoglobin and mean corpuscular haemoglobin concentration (P < 0.05), red blood cell counts, and haematocrit (P < 0.01). These results show the important role of water, as limiting factor for animal breeding in low-water availability environments. Where possible, the management of low-dairy breeds should be well adapted to support the productive performance.
Keywords: Ovis aries; water stress; blood metabolites; adaptation
Drinking water is an important requirement for livestock and the lack of a sufficient source of water can be a critically limiting factor in animal physiology and productivity (Alamer 2010). In fact, low water intake leads to a lower intake of feed in various animal species, with considerable differ-ences existing in the ability of water use among species in relation to the geographical areas of origin (Shoeman and Visser 1995). Animals living in deserts and arid regions have acquired various adaptation mechanisms and are able to maintain a high water economy by efficiently using their bodily reserves; therefore, the production perfor-mance of such animals are maintained within an acceptable range during periods of water scarcity (Silanikove 1994). Compared to other species, ru-minants are more resistant (for instance, compared to the rat), to the effects of dehydration, because
extracellular bodily fluids; it represents 90% of the blood plasma and is essential to maintain a high blood flow in lactating animals (Carter and Grovum 1990; Holter and Urban 1992; Andrew et al. 1995). Water scarcity can also have a negative impact on the endocrine and metabolic balance of animal, reducing adaptive capacity. Choshniak et al. (1995) observed a reduction in metabolic activity by about 20% and an increase of respiratory rate of 40–60% in dehydrated Bedouin goats, compared to sheep with free access to water. Water restriction also affects other physiological variables; we previously reported an increase in some blood metabolites in Comisana sheep (Casamassima et al. 2008). During the summer dehydration almost always results in a reduction in plasma volume caused by a recall of water from tissues (Schaefer et al. 1990). Although several authors (Laden et al. 1987; Dahlborn et al. 1988; Olsson and Dahlborn 1989; Abdelatif and Ahmed 1994; Ghanem 2005) agree that a reduction of corpuscular volume concentration and haemo-globin serve as good indicators of dehydration in plasma, other authors do not report these findings; in fact, the haematocrit concentration was higher in Awassi and Merinos sheep in conditions of water stress (Laden et al. 1987; Ghanem 2005; Ghanem et al. 2008). Moreover, under the same conditions other authors have failed to detect any significant variations in this as well as other breeds (Aganga et al. 1989; Igbokwe 1993; Li et al. 2000). These conflicting results may be dependent on the ability of the sheep to maintain their plasma volume and distribute bodily water when already adapted to water scarcity (Ashour and Benlemlih 2000). In our previous study (Casamassima et al. 2008) carried out on water-restricted Comisana sheep, we did not observe any effect of experimental treatment on the quantity or quality milk production and feed in-take, while our analysis revealed a progressive and significant increase of some blood metabolites like cholesterol, triglycerides, total proteins, albumin, sodium, creatinine, urea and potassium. The ovine breeds differ in their respective abilities to respond to water restriction, and experiments on different breeds have yielded conflicting results. Yankasa sheep survive five days without drinking but un-dergo severe physiological changes (Aganga et al. 1989; Igbokwe 1993); on the other hand, Awassi sheep can withstand more than a month without significant physiological changes while drinking every two days, while watering every five days
re-sults in important alterations (Jaber et al. 2004). Australian Merino sheep survive 10 days without water (MacFarlane 1964) and the two-horn desert sheep can survive for up to 15 days (Farid et al. 1979; Turner 1979); however, Egyptian Barki sheep do not survive for more than three days without water (Farid et al. 1979). On the basis of existing reports in the literature, this study was aimed at investigating selected physiological variables in intensively-reared Lacaune sheep in response to different levels of water restriction. This could lead to better assessment of the relationship between water availability, environmental temperature and the welfare of animals, and might be useful in pre-venting the deleterious effects of water stress, es-pecially in warm-arid regions where water is often a limiting factor in livestock breeding.
MATERIAL AND METHODS
Animal and diet. Ewes were healthy and their condition was judged as good at the beginning of the experiment. All experimental procedures were performed in accordance with European Community Guidelines (86/609/CEE) regarding the protection of animals used for scientific pur-poses.
The trial lasted 28 days and was carried out during the spring season on 30 lactating Lacaune sheep, divided into three homogeneous groups of 10 animals each, by stage of lactation (63 ± 14 days), body weight (54 ± 5 kg) and body condition score (2.10 ± 0.8). Animals were allocated into individual boxes of the same size (1.5 m2/animal).
In order to promote the animal’s adaptation to the experimental conditions without any water re-striction, a 7-day pre-experimental period followed the final formation of the groups. The feed, accord-ing to the physiological and production needs of animals, consisted of 1 kg of meadow hay, 400 g of alfalfa hay pellet and 700 g of concentrated feed, divided into three daily meals, at 08:00 h (200 g of concentrated feed, 200 g of alfalfa hay pellet, 500 g of meadow hay), at 14:00 h (200 g of concentrated feed and 200 g of alfalfa hay pellet) and at 20:00 h (300 g of concentrated feed and 500 g of meadow hay).
The experimental protocol. In control group W100, sheep received water daily ad libitum at three different times of the day, at 08:00, 14:00 and 20:00 h in order to determine the quantity of water for experimental groups, water intake was recorded at every administration.
In experimental group W80, sheep received drinking water daily at a level of 80% of the intake recorded in the W100 group, at three set times; this was achieved by restricting water intake by 20% compared to the intake of the control group.
In experimental group W60, sheep received drinking water daily at a level of 60% of the intake recorded in the W100 group, at three set times; this was achieved by restricting water intake by 40% compared to the intake of the control group.
Feed and water containers were placed outside and in front of each box to eliminate any leaks.
Experimental measurements. During the trial, the temperature and the ambient relative humid-ity was continuously recorded through the use of a thermograph positioned at the same level of the animal. The collected data were used to calculate the temperature humidity index (THI) to charac-terise the climatic and environmental conditions which the animals were exposed to. For the calcula-tion of the THI the following formula of from the National Council of Research (NCR 1971) was used:
THI (°C) = (1.8 × Ta + 32) – (0.55 × 0.55 – – RH/100) × [(1.8 × Ta + 32) – 58]
where:
Ta = ambient temperature inside the farm (°C) RH = relative humidity (%)
In addition, we carried out rectal temperature recording with a mercury thermometer at 06:00 h and determined respiratory rate by observing the movement of the body-side per minute, every 14 days (Day 0, Day 14 and Day 28). Individual water intake was recorded three times daily at 08:00, 14:00 and 20:00 h. Individual feed intake was recorded daily.
[image:3.595.62.535.113.270.2]Blood samples were taken from fasting animals at 07:00 h, immediately after the milking of the sheep, at the start of the trial (Day 0), in the mid-dle (Day 14) and at the end of the test (Day 28). The blood was taken using a vacutainer system (Venoject, Terumo Europe N.V., Louvain, Belgium) from the external jugular vein into two tubes, the first with gel separator for the isolation of serum and the second with EDTA for blood count. The blood was centrifuged for 15 min at 1800 g and from serum we determined the following param-eters: glucose, total cholesterol and high density lipoprotein (HDL) cholesterol, triglycerides, non-esterified fatty acids (NEFA), total protein, albu-min, urea, creatinine, calcium and chlorine using a semi-automated Analyser for clinical chemistry (ARCO Biotech Instruments, SpA, Italy); sodium and potassium were determined using a SEAC flame photometer (Radim model Company, Italy). The concentration of ROMs was read spectropho-tometrically using the colorimetric method pro-posed by Diacron (Diacron International, Italy) at a wavelength of 505 nm, using a specific com-mercial kit (Cesarone et al. 1999). The results were expressed in U Carr (1 Carratelli Unit corresponds to 0.024 mmol/l H2O2). The blood concentration of cortisol was measured with a specific kit (Radim, Table 1. Chemical composition of feeds and diet
Specification Feeds Diet
concentrate alfalfa hay pellet meadow hay
DM (%/FM) 87.45 88.52 86.47 87.19
Crude protein (%/DM) 19.20 18.11 10.12 14.61
Ether extract (%/DM) 58.06 38.69 37.99 44.81
Fat (%/DM) 3.25 3.10 2.65 2.94
Crude fiber (%/DM) 11.47 28.00 40.44 28.41
NDF (%/DM) 13.79 48.56 65.61 45.09
ADF (%/DM) 5.82 36.51 48.74 39.10
Lignin (%/DM) 3.82 9.49 14.97 10.21
Ash (%/DM) 8.20 12.10 8.80 9.23
Cortisolo EIA Well KS18EW, Italy) using a pho-tometric reader for immunometry on microplates (DV 990B/V4, Italy) at a wavelength of 450 nm with a sensitivity of 0.8 ng/ml of plasma.
Whole blood was tested for haematological pa-rameters, including red blood cells (RBC), hae-moglobin (HGB), haematocrit (HCT) and mean corpuscular haemoglobin concentration (MCHC) using the SEAC automatic blood cell counter (Radim Company, Italy).
Statistical analysis. After evaluation of normal frequency distributions, all variables were subject-ed to statistical analysis using the GLM procsubject-edure for repeated measures from the statistical package SPSS 19.0 (SPSS Inc., Chicago, IL). The fixed effect of water treatment (W100, W80, W60), the day of sampling and their interaction were included in the model. The relationships between blood parame-ters were assessed using Pearson correlation coeffi-cients. The individual ewe formed the experimental unit. The data were presented as mean values of each group and the differences were considered significant at P < 0.05.
RESULTS
Feed and water intake
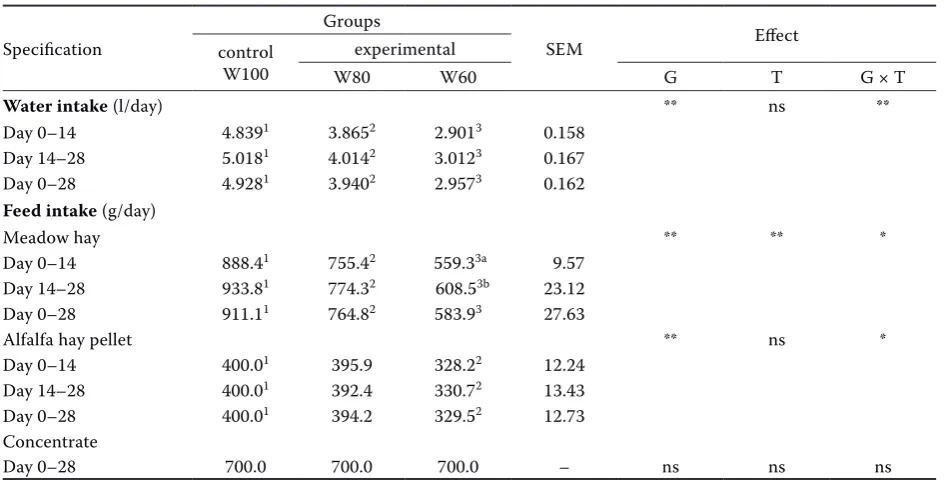
During the experiment, the mean daily water intake in the ad libitum W100 group was 4.93 l (Table 2). As expected, no residual water was de-tected in either W80 or W60 groups that consumed in the period 0–28 days, respectively, 3.94 l and 2.96 l. The lowest water intake found in the ex-perimental groups was observed in both the first (0–14 days) and the second experimental period (14–28 days), and resulted, from 0 to 28 days, in a progressive and significant (P < 0.01) reduced in-take of meadow hay (911.1 g W100 vs 764.8 g W80 vs 583.9 g W60) and alfalfa hay pellets, between the W100 (400.0 g) and W60 (329.5 g) groups. No effect on concentrate intake due to water restriction was found; all groups consumed it in its entirety over the course of the whole trial.
Rectal temperature and respiratory rate
The water restriction carried out on experimental groups, under rearing temperatures ranging between
16.6 °C and 25.8 °C and relative humidity of 71.3%, did not influenced the rectal temperature (Table 3).
Blood variables
The water restriction treatment did not influence blood glucose, total cholesterol, HDL cholesterol, NEFA, albumin and calcium; therefore, these val-ues are not reported in the table.
Water restriction significantly influenced the se-rum concentration of total protein, urea, creatinine, sodium, chlorine, ROMs and cortisol (Table 4).
Total proteins showed a progressive increase from the first (Day 0) to the third sampling (Day 28), reaching statistical significance only at Day 28 (P < 0.05), between the W100 group and the experimental W60 group (72.7 vs 82.0 g/l). Also, a time-dependent effect resulted in a significant increase (P < 0.05) in both experimental groups, culminating in an increase of values from Day 0 to Day 28 of 10.1% and 13.3%, respectively, in the W60 and W80 groups; no changes were recorded in the W100 group over the same time period.
Urea content markedly increased (P < 0.01) in the W60 compared to the W100 group (16.2%) and compared to the W80 group (9.7%). Also, the duration of the experiment influenced (P < 0.01) the blood concentration of urea, with an increase of values of 13.3% and 21.4%, respectively, in the W60 and W80 groups, while no significant differ-ences in the W100 group were observed.
Serum creatinine concentrations exhibited sig-nificantly increased (P < 0.05) values due to the water restriction effect, to an extent of 15% in both experimental groups compared to the W100 group. A time-dependent effect of the experimental treat-ment was observed, from Day 0 to Day 28, which resulted in an average increase of 14% for creatinine (P < 0.05) in the W60 and W80 groups, while values remained unchanged in the W100 group.
Water restriction resulted in a progressive in-crease in serum concentrations of sodium and chlo-rine in the W60 group, with values that statistically significant increases (P < 0.05) of 9.7% and 8.8% respectively, compared to the W100 group. Also, there was a significant time-dependent increase
(P < 0.05) in sodium and chlorine values in the W60 group, while no statistical differences were found in the W100 and W80 groups.
Blood ROM levels were significantly influenced (P < 0.01) by water restriction, and analysis revealed a progressive increase of the values in both experi-Table 2. Individual water and feed intakes of control and water-restricted Lacaune ewes
Specification
Groups
SEM Effect
control W100
experimental
W80 W60 G T G × T
Water intake (l/day) ** ns **
Day 0–14 4.8391 3.8652 2.9013 0.158
Day 14–28 5.0181 4.0142 3.0123 0.167
Day 0–28 4.9281 3.9402 2.9573 0.162
Feed intake (g/day)
Meadow hay ** ** *
Day 0–14 888.41 755.42 559.33a 9.57
Day 14–28 933.81 774.32 608.53b 23.12
Day 0–28 911.11 764.82 583.93 27.63
Alfalfa hay pellet ** ns *
Day 0–14 400.01 395.9 328.22 12.24
Day 14–28 400.01 392.4 330.72 13.43
Day 0–28 400.01 394.2 329.52 12.73
Concentrate
Day 0–28 700.0 700.0 700.0 – ns ns ns
G = water restriction effect, G × T = interaction of water restriction × time, T = time effect
1,2,3Values within a row with different superscripts differ significantly a,bValues within a column with different superscripts differ significantly
[image:5.595.62.536.111.352.2]*P < 0.05, **P < 0.01
Table 3. Rectal temperatures and respiratory rates of control and water-restricted Lacaune ewes
Specification
Group
SEM Effect
control
W100 W80experimentalW60 G T G × T
Rectal temperature (°C) ns ns ns
Day 0 38.55 38.63 38.41 0.052
Day 14 38.78 39.01 39.06 0.063
Day 28 38.85 38.88 38.94 0.058
Respiratory rate (n/min) * ** *
Day 0 26.60 29.20a 25.20a 0.778
Day 14 24.401 21.902b 18.603b 0.947
Day 28 26.201 22.602b 20.203b 1.076
G = water restriction effect, G × T = interaction of water restriction × time, ns = not significant, T = time effect
1,2,3Values within a row with different superscripts differ significantly a,bValues within a column with different superscripts differ significantly
[image:5.595.62.537.450.600.2]mental groups; by 56.8% (W80 group) and 73.9% (W60 group) compared to the control group. Also, the duration of the experiment significantly influ-enced (P < 0.01) this parameter, which increased its plasma concentration in both experimental groups.
Plasma concentrations of cortisol were also af-fected by water restriction (P < 0.01), leading to a progressive increase in values during the trial of 40.1% in the W80 group and 78.5% in the W60 group compared to the W100 group. The time-dependent effect of water restriction in both ex-perimental groups was also evident in an increase
(P < 0.01) of cortisol, from the first to the third sampling, of 49.3% in the W80 group and 91.1% in the W60 group; the W100 group exhibited an increase of 8.8%.
[image:6.595.65.527.114.534.2]Examination of blood counts (Table 5) shows that the number of RBC exhibited progressive and sig-nificantly increased values (P < 0.01) in response to water restriction; values rose by 12.9% and 27.9%, respectively, in the W80 and W60 groups com-pared to the W100 groups; whereas a difference of 13.3% was observed between the two experi-mental groups. The duration of water restriction Table 4. Blood parameters of control and water-restricted Lacaune ewes
Specification
Group
SEM Effect
control
W100 W80experimentalW60 G T G × T
Total protein (g/l) * * *
Day 0 72.9 72.5a 72.4a 0.443
Day 14 72.7 78.3 79.0 0.865
Day 28 72.71 79.8b 82.02b 0.849
Urea (mmol/l) ** ** **
Day 0 16.6 16.7a 17.0a 0.170
Day 14 16.81 17.41 19.22b 0.287
Day 28 17.81 18.91b 20.72c 0.331
Creatinine (mmol/l) * * *
Day 0 90.4 91.9a 93.7a 1.265
Day 14 90.7 97.8 95.5 1.248
Day 28 91.81 104.82b 105.72b 1.924
Sodium (mmol/l) * * *
Day 0 149.60 150.50 150.70a 0.786
Day 14 150.401 154.20 159.602b 1.124
Day 28 150.901 154.50 165.502b 0.661
Chlorine (mmol/l) * * *
Day 0 89.31 89.47 90.44a 0.363
Day 14 87.94 88.90 90.07a 0.262
Day 28 90.671 94.16 98.612b 0.433
ROMs (IU/Carr) ** ** **
Day 0 87.21 92.86a 89.06a 3.678
Day 14 92.831 102.452b 113.433b 4.953
Day 28 89.521 140.412c 155.723c 5.633
Cortisol (mmol/l) ** ** **
Day 0 47.94a 48.94a 48.74a 2.321
Day 14 50.301 63.313b 56.362b 3.475
Day 28 52.181b 73.082c 93.133c 3.298
G = water restriction effect, G × T = interaction of water restriction × time, T = time effect
1,2,3Values within a row with different superscripts differ significantly a,b,cValues within a column with different superscripts differ significantly
showed, in both experimental groups, a significant effect (P < 0.01) in the number of red blood cells; to an extent of 14.7% in the W80 group and 29.5% in the W60 group. No variation was observed in the control group.
The concentration of HGB was significantly high-er (P < 0.05) at the end of the test in the W60 group compared to the W100 group (119.3 vs 100.8 g/l). The duration of the trial showed a statistical effect (P < 0.05) on the W60 group whose haemoglobin values rose by 18.8%.
Water restriction elicited a significant increase (P < 0.01) in HCT values, by 19.7% in the W80 group and by 24.1% in the W60 group, compared to the W100 group. The duration of the experimental period influenced (P < 0.01) haematocrit values; these increased by 24.5% in the W80 group and by 25.8% in the W60 group. The control group showed no changes.
MCHC values were affected (P < 0.05) by water restriction; the values rose at the third sampling by 8.5% in both the W60 and W80 experimental
groups, compared to the W100 group. Over the course of the entire test a significant increase in values (P < 0.05) was observed; by 10.9% in the W80 group and by 11.7% in the W60 group. In contrast, the values in the control group were unchanged.
Blood count values, which were statistically af-fected by water restriction, were also shown to have a significant interaction (P < 0.05) between treat-ment groups in a time-dependent manner, high-lighting the progressive effects of water restriction during the period of the trial.
DISCUSSION
[image:7.595.59.536.113.383.2]In similar experiments on water restriction (Maloiy et al. 2008), carried out at an ambient tem-perature of 22 °C, a significant and progressively increasing reduction in feed intake from fat-tailed sheep (–48%), to Zebu (–50%) and Turkana goats (–58.3%) was reported; the same authors also noted a dietary depression in non-domestic species such Table 5. Haematological parameters of control and water-restricted Lacaune ewes
Specification
Group
SEM Effect
control W100
experimental
W80 W60 G T G × T
RBC (103/mm3) ** ** *
Day 0 8.63 8.57a 8.60a 0.184
Day 14 8.691 9.231 11.172b 0.240
Day 28 8.711 9.832b 11.143b 0.212
Hb (g/l) * * *
Day 0 99.1 100.5 100.4a 1.717
Day 14 100.61 106.0 116.52b 2.544
Day 28 100.81 106.5 119.32b 2.299
HCT (proportion of 1) ** ** *
Day 0 0.23 0.23a 0.24a 0.005
Day 14 0.241 0.25 0.282 0.006
Day 28 0.241 0.292b 0.302b 0.007
MCHC (g/l) * * ns
Day 0 378.4 379.3a 377.1a 2.298
Day 14 385.7 394.8 388.4 2.648
Day 28 387.81 420.82b 421.42b 5.992
G = water restriction effect, G × T = interaction of water restriction × time, Hb = haemoglobin, HCT = haematocrit, MCHC = mean corpuscular haemoglobin concentration, RBC = red blood cell, T = time effect
1,2Values within a row with different superscripts differ significantly a,bValues within a column with different superscripts differ significantly
as Grant’s gazelles (–34%; Nanger granti) and oryx (–40%; Oryx beisa). In comparable experiments conducted by other authors (Aganga et al. 1989; Ikhatua et al. 1992; Abdelatif and Ahmed 1994) in Yankasa sheep and native goats, marked effects of water deficiency on feed intake under various regimens of water restriction were detected.
The decrease in feed intake under water restric-tion is also linked to the type of feed that animals receive; in fact, in goats fed legume hay a feed in-take reduction of only 18.8% was observed, while this percentage rose to 21.2% when animals were fed meadow hay, which has lower protein content (Muna and Ammar 2001). In water restriction ex-periments carried out on sheep, goats and cattle, low feed intake has been described to be partially offset by reduced intestinal peristalsis, which leads to an increased time of exposure of feed to the intestinal microflora with beneficial effects on di-gestibility and feed utilisation (Musimba et al. 1987; Ajibola 2000; Hadjigeorgiou et al. 2000; Muna and Ammar 2001).
Results on rectal temperature and respiratory rate are in agreement with what Jaber et al. (2004) reported on Awassi sheep water restricted for two and four days, and with what other authors ob-served (Degen 1977; Hamadeh et al. 2006) in simi-lar research on sheep under different regimens of water restriction.
Alamer (2010) also reported no change in rec-tal temperatures in water-restricted Aardi goat. However, Alamer and Al-Hozab (2004) described a significant increase in rectal temperature under conditions of water restriction during the spring and summer season in Awassi and Najdi rams; other authors (Ghanem et al. 2008) made the same find-ings in Awassi sheep, which are due to the adaptive response of animals to the breeding environment that serve to reduce water loss through mechanisms of thermoregulation for the defence from heat.
Water restriction in the W80 and W60 experi-mental groups, both at Day 14 and Day 28 sam-plings, elicited a significant reduction (P < 0.05) in the number of respiratory acts per minute, reaching at the end of the test (Day 28) values of –13.7% in the W80 group and –22.9% in the W60 group compared with the W100 group (Table 3). A time-dependent effect (P < 0.05) was observed in the period from Day 0 to Day 14, while from Day 14 to Day 28 the respiratory rate remained stable. The reduction of respiratory acts under water
restric-tion is one of many defence mechanisms which the animal employs to prevent the loss of water and de-hydration through pulmonary evaporation. Alamer and Al-Hozab (2004) also observed a significant reduction in respiratory rate in Awassi and Najdi sheep, subjected to water deprivation for three days. Al-Ramamneh et al. (2012), in experiments carried out on water-restricted Boer goats and black-head sheep in an arid environment, reported a significant decrease in the respiratory rate only for sheep; Dmi’el (1986) observed a 50% increase in respiratory rate after water deprivation for 72 h during the summer, in experiments conducted on Bedouin desert goats. This increase in rate is primarily aimed at maintaining normal body tem-perature especially that of the brain (Robertshaw and Dmi’el 1983). Rahardja et al. (2011), in their experiments evaluating water restriction by 50% in fat-tailed sheep and Kacang goats in a hot and dry area, observed a significant increase of respiratory rate to prevent an increase in body temperature only in sheep.
Water restriction significantly changed the se-rum concentration of total protein, urea, creatinine, sodium, chlorine, ROMs and cortisol. A marked increase in the concentration of serum proteins was observed by Mengistu (2007) in Ethiopian-Somali goats water-restricted for four days, and by Jaber et al. (2004) in Awassi ewes subjected to two different regimens of water restriction. Hossaini-Hilali et al. (1994) reported the same findings from simi-lar experiments performed on goats in Morocco. According to Khan et al. (1978), the increased serum concentrations of proteins helps maintain blood colloidal osmotic pressure in water-stressed animals, as the loss of water results in an over-concentration in a smaller volume of blood (Schalm et al. 1975).
the two and four day-watering groups. Water defi-ciency leads to increased water reabsorption at the nephron level; consequently, increased urea reab-sorption is expected as it is a highly permeable mol-ecule. In other experiments conducted on Merino (MacFarlane et al. 1961) and Yankasa sheep (Aganga et al. 1989; Igbokwe 1993) similar results have been obtained. Laden et al. (1987) also reported a gradual increase in urea concentrations in response to two and five days of water restriction in Awassi sheep. Osbaldiston (1971) reported that hypovolaemia due to water insufficiency is expected to cause a decrease in renal blood flow, thus leading to a de-creased filtration rate; in fact, 95% of creatinine, the final metabolite of creatine, is of muscular origin and it is excreted by the kidneys in proportion to the muscle mass and to its rate of proteolysis. When kidney water stress leading to slower glomerular fil-tration and reabsorption of urea excretion affects kidney excretion function (Keenan and Allardyce 1986; Igbokwe 1993; Silanikove 2000; Marini et al. 2004; Kataria and Kataria 2007), the blood creatinine levels increase, as noted in similar experiments on sheep (Alamer 2005; Hamadeh et al. 2006). Laden et al. (1987) reported an increased creatinine value of 88% in five days water-restricted Awassi sheep, while Abd El-latif et al. (1997) reported an increase of 13% in blood levels of creatinine after three days of water restriction in Barki sheep. However, Jacob et al. (2006) did not observe any changes in creatinine after water restriction for two days in Poll Dorset × Merino lambs.
The increase of serum chlorine and sodium con-centrations is due to the reduction in plasma volume and increased serum levels of aldosterone and vaso-pressin. This promotes increased sodium retention and water adsorption at the kidney level, leading to a haemo-dilution in an attempt to restore the physi-ological values of sodium and chlorine. In similar previous studies on sheep, goats and cattle (Burgos et al. 2001; Mengistu et al. 2007; Casamassima et al. 2008; Ghanem et al. 2008) similar variations in so-dium and chlorine in response to increased restric-tions in water were reported. Other authors (Rawda 2003; Hanna 2006; Ghanem et al. 2008) reported a strong influence of water intake on sodium ion con-centrations in sheep plasma; the reduction of plasma volume in response to water restriction causes an increase in blood plasma osmolality, and leads to the concentration of electrolytes in plasma (Qinisa et al. 2011), in particular, an increase in sodium and
chlorine ions as has been reported by different au-thors for sheep and goats (Alamer 2005; Jacob et al. 2006; Karnib 2009).
High levels of ROMs in the blood are an indica-tion of oxidative stress, which stems from an im-balance between the production of reactive oxygen metabolites and the capacity of the endogenous antioxidant system to neutralise them (Sies 1991). In fact, when free radicals accumulate in the blood, this leads to damage to cellular membranes, altered metabolism, cellular aging, as well as potentially mutagenic damage to DNA. Zhou et al. (2012) re-ported an increase of 71% in the activity of mito-chondrial enzymes, which produce reactive oxygen species in the kidney medulla, and a decrease of 41% in the activity of NADPH oxidase in experi-ments on rats subjected to water restriction.
Cortisol plays an important role in maintaining the water balance and plasma electrolytes, although its mechanism of action is not yet clear (Parker et al. 2003). Kataria and Kataria (2007), in accord-ance with the results of our research, reported a significant increase in the concentration of cortisol in Marwari sheep, fed ad libitum and subjected to water deprivation for eight days; while Parker et al. (2003) found that such experimental conditions do not activate the HPA (hypothalamus-pituitary-adrenal) axis in Merino sheep undergoing water deprivation for three days, and suggested that an increase in plasma cortisol represents a response to a longer period of water restriction. Parrot et al. (1996) similarly observed a lack of cortisol release in sheep after feed and water restriction for 48 h.
The increase in the values of some blood count variables (RBC, HGB, HCT and MCHC), found in the present study, can be attributed to water restric-tion, which produced a reduction in plasma volume and in their haematic concentration.
Al-Toum and Al-Johany (2000) reported a pro-gressive increase in haemoglobin values from tri-als carried out in winter or during the summer in gazelles subjected to water stress. The same re-sults were reported by other authors (Li et al. 2000; Ghanem 2005; Hamadeh et al. 2006) in experiments conducted on sheep after water restriction.
This has also been reported by Hamadeh et al. (2006) in Awassi sheep. In particular, the progres-sive increase in RBC, in response to water restric-tion, leads to secondary polycythaemia due to a gradual reduction in circulating blood volume and not due to an increase in red blood cells. When this condition persists over time, it leads to a slowing of blood flow in animals that could in turn cause sev-eral pathological events. Other authors, however, in similar water deprivation experiments conducted on Yankasa (Aganga et al. 1989; Igbokwe 1993), Awassi (Jaber et al. 2004) and Australian Merino sheep (Li et al. 2000) failed to find any significant effects on blood count parameters.
In conclusion, this research shows that water re-striction by 20% (W80) and 40% (W60) results in a significant and progressive reduction of meadow hay and alfalfa hay pellet feed intake, a reduction of respiratory rate per minute and an increase in selected blood variables. These results show the important role of water, as a limiting factor for animal breeding in low-water availability environ-ments. Where possible, the management of low-dairy breeds should be well-designed to support production performance.
Acknowledgement
This research was supported by the departmental funds of the University of Molise, Department of Agricultural, Environmental and Food Sciences.
REFERENCES
Abd El-latif H, Ismail E, Salem M, Hassan GA (1997): Effect of dehydration on some biochemical constituents of blood in Barki, Suffolk and their crossbred sheep. Indian Jour-nal of Animal Science 67, 786–791.
Abdelatif AM, Ahmed MMM (1994): Water restriction, thermoregulation, blood constituents and endocrine re-sponses in Sudanese desert sheep. Journal of Arid Envi-ronments 26, 171–180.
Aganga AA, Umunna NN, Oyedipe EO, Okoh PN (1989): Influence of water restriction on some serum components in Yankasa sheep. Small Ruminant Research 2, 19–26. Ajibola A (2000): The effect of water deprivation and
at-ropine administration on gastro-intestinal function in goats. [MSc Thesis.] University of Pretoria, South Af-rica.
Al-Ramamneh D, Riek A, Gerken M (2012): Effect of water restriction on drinking behaviour and water intake of Ger-man black-head mutton sheep and Boer goats. Animal 6, 173–178.
Al-Toum MO, Al-Johany AM (2000): Water deprivation and its effect on some blood constituents in Idimi gazelle, Gazella gazella. Journal of Arid Environments 45, 253–262. Alamer M (2005): Effect of deprivation and season on some
biochemical constituents of blood in Awassi and Najdi sheep breeds in Saudi Arabia. Journal of Animal and Vet-erinary Advance 48, 15–20.
Alamer M (2010): Effect of water restriction on ther-moregulation and some biochemical constituents in lactating Aardi goats during got weather conditions. Journal of Basic and Applied Scientific Research 11, 189–205.
Alamer M, Al-Hozab A (2004): Effect of water deprivation and season on feed intake, body weight and thermoregu-lation in Awassi and Najdi sheep breeds in Saudi Arabia. Journal of Arid Environments 59, 71–84.
Andrew SM, Erdman RA, Waldo DR (1995): Prediction of body composition of dairy cows at three physiological stages from deuterium oxide and urea dilution. Journal of Dairy Science 78, 1083–1095.
Ashour G, Benlemlih S (2000): Adaptation of Mediterranean breeds to heat stress and water deprivation. In: Guessous F, Rihani N, Ilham A (eds): Livestock Production and Climatic Uncertainty in the Mediterranean. Proceedings of the Joint ANPA-EAAP-CIHEAM-FAO Symposium. Agadir, Mo-rocco. 63–74.
AOAC – Association of Official Analytical Chemists (2006): Official Methods of Analysis. 18th edn. AOAC Int.,
Ar-lington.
Brosh A, Shkolnik A, Choshniak I (1986): Metabolic effects of infrequent drinking and low-quality feed on Bedouin goats. Ecology 67, 1086–1090.
Brosh A, Shkolnik A, Choshniak I (1987): Effects of infre-quent drinking on the nitrogen metabolism of Beduin goats maintained on different diets. Journal of Agricul-tural Science 109, 165–169.
Burgos MS, Senn M, Sutter F, Kreuzer M, Langhans W (2001): Effect of water restriction on feeding and me-tabolism in dairy cows. Regulatory, Integrative and Com-parative Physiology 280, R418–R427.
Carter RR, Grovum WL (1990): A review of physiological significance of hypertonic body fluid on food intake and ruminal function: salivation, motility and microbes. Jour-nal of Animal Science 68, 2811–2832.
sheep reared under intensive condition. Small Ruminant Research 78, 169–175.
Cesarone MR, Belcaro G, Carratelli MA (1999): Simple test to monitor oxidative stress. International Journal of An-giology 18, 127–130.
Choshniak I, Ben-Kohav N, Taylor CR, Robertshaw D, Barnes RJ, Dobson A, Belkin V, Shkolnik A (1995): Met-abolic adaptations for desert survival in Bedouin goat. American Journal Physiology 268, 1101–1110.
Dahlborn K, Holtenius K, Olsson K (1988): Effects of in-traruminal loads of saline or water followed by voluntary drinking in the dehydrated lactating goat. Acta Physio-logica Scandinavica 132, 67–73.
Degen AA (1977): Responses to dehydration in native fat-tailed Awassi and imported German Mutton Merino sheep. Physiological Zoology 50, 284–293.
Dmi’el R (1986): Selective sweat secretion and panting modulation in dehydrated goats. Journal of Thermal Bi-ology 11, 157–159.
Farid MF, Shawket SM, Abdel-Rahman MHA (1979): Ob-servations on the nutrition of camels and sheep under stress. In: Camels. IFS Symposium, Sudan. 125–170. Ghanem AM (2005): The effect of vitamin C
supplementa-tion on some physiological an immunological indicators in water-deprived Awassi ewes. [MSc Thesis.] American University of Beirut, Lebanon.
Ghanem AM, Barbour EK, Hamadeh SK, Jaber LS, Abi Said M (2008): Physiological and chemical responses in water-deprived Awassi ewes treated with vitamin C. Journal of Arid Environments 72, 141–149.
Hadjigeorgiou I, Dardamani K, Goulas C, Zervas G (2000): The effect of water availability on feed intake and di-gestion in sheep. Small Ruminant Research 37, 147– 150.
Hamadeh SK, Rawda N, Jaber LS, Habre A, Abi Said M, Barbour EK (2006): Physiological responses to water re-striction in dry and lactating Awassi ewes. Livestock Sci-ence 101, 101–109.
Hanna N (2006): Physiological changes in water stressed Awassi ewes supplemented with vitamin C. [MSc Thesis.] American University of Beirut, Lebanon.
Holter JB, Urban WE (1992): Water partitioning and intake in dry and lactating Holstein cows. Journal of Dairy Sci-ence 75, 1472–1479.
Hossaini-Hilali J, Benlamlih S, Dahborn K (1994): Effects of dehydration, rehydration and hyperhydration in black Moroccan goat. Comparative Biochemistry and Physiol-ogy 109, 1017–1026.
Igbokwe IO (1993): Haemoconcentration in Yankase sheep exposed to prolonged water deprivation. Small Ruminant Research 12, 99–105.
Ikhatua UJ, Dede TI, Apumami AS (1992): Water and feed utilisation relationship in West African Dwarf (forest) goats of Southern Nigeria. Nigerian Journal of Animal Production 19, 120–124.
Jaber LS, Habre A, Rawda N, Abi Said M, Barbour EK, Hamadeh S (2004): The effect of water restriction on certain physiological parameters in Awassi sheep. Small Ruminant Research 54, 115–120.
Jacob RH, Pethick DW, Clark P, D’Souza DN, Hopkins DL, White J (2006): Quantifying the hydration status of lambs in relation to carcass characteristics. Australian Journal of Experimental Agriculture 46, 429–437.
Karnib M (2009): The effect of vitamin C administration on some physiological parameters in water and feed re-stricted dry Awassi ewes. [MSc Thesis.] American Uni-versity of Beirut, Lebanon.
Kataria N, Kataria AK (2007): Compartmental water man-agement of Marwari sheepduring dehydration and rehy-dration. Veterinary Archives 77, 551–559.
Keenan DM, Allardyce CJ (1986): Changes of plasma cre-atinine levels of sheep during sub maintenance feeding. Australian Veterinary Journal 63, 29–30.
Khan MS, Ghosh PK, Sasidharan TO (1978): Effect of acute water restriction on plasma proteins and on blood and urinary electrolytes in Barmer goats of the Rajasthan de-sert. Journal of Agricultural Science 2, 395–398. Laden S, Nehmadi L, Yagil R (1987): Dehydration tolerance
in Awassi fat-tailed sheep. Canadian Journal of Zoology 65, 363–367.
Li BT, Christopherson RJ, Cosgrove SJ (2000): Effect of wa-ter restriction and environmental temperatures on met-abolic rate and physiological parameters in sheep. Canadian Journal of Animal Science 80, 97–104. MacFarlane WV (1964): Terrestrial animals in dry heat:
ungulates. In: Dill DB, Adolph EFA, Wilberg CC (eds): Handbook of Physiology. American Physiology Society. 509–539.
MacFarlane WV, Morris RJH, Howard B, McDonald J, Budtz-Olsen OE (1961): Water and electrolyte changes in tropical Merino sheep exposed to dehydration during summer. Australian Journal of Agricultural Research 12, 889–912.
Maloiy GMO, Kanui TI, Towett PK, Wambugu SN, Miaron JO, Wanyoike MM (2008): Effects of dehydration and heat stress on food intake and dry matter digestibility in East African ruminants. Comparative Biochemistry and Phys-iology 151, 185–190.
Mengistu U (2007): Performance of the Ethiopian Somali goat during different watering regimes. [PhD Thesis.] Swedish University of Agricultural Sciences. Uppsala. Muna MMA, Ammar IES (2001): Effects of water and feed
restriction on body weight change and nitrogen balance in desert goats fed high and low quality forages. Small Ruminant Research 41, 19–27.
Musimba NKR, Pieper RD, Wallace JD, Galyean ML (1987): Influence of watering frequency on forage consumption and steer performance in South Eastern Kenya. Journal of Range Management 40, 412–415.
NCR – National Council of Research (1971): 8. Research under field condition. In: McDowell RE, Johnston JE (eds): A Guide to Environmental Research on Animals. 1st edn.
National Academy of Sciences, Washington. 306–359. Olsson K, Dahlborn K (1989): Fluid balance during heat
stress in lactating goats. Quarterly Journal of Experimen-tal Physiology 74, 645–659.
Osbaldiston GW (1971): The kidney: its function and eval-uation in health and disease. In: Kaneko JJ, Cornelius CE (eds): Clinical Biochemistry of Domestic Animals. 2nd
edn. Academic Press, New York. 2–28.
Parker AJ, Hamlin GP, Coleman CJ, Fitzpatrick LA (2003): Dehydration in stressed ruminants may be the results of a cortisol induced diuresis. Journal of Animal Science 81, 512–519.
Parrot RF, Lloyd DM, Goode JA (1996): Stress hormone response of sheep to food and water deprivation at high and low ambient temperatures. Animal Welfare 5, 45–56. Qinisa MM, Boomker EA, Mokoboki HK (2011): Physio-logical responses of water-restricted Tswana and Boer goats. Life Science Journal 8, 106–111.
Rahardja DP, Toleng AL, Lestari VS (2011): Thermoregula-tion and water balance in fat-tailed sheep and Kacang goat under sunlight exposure and water restriction in a hot and dry area. Animal 5, 1587–1593.
Rawda N (2003): The effect of water restriction on some physiological and immunological indicators in dry and
lactating Awassi ewes. [MSc Thesis.] American University of Beirut, Lebanon.
Robertshaw D, Dmi’el R (1983): The effect of dehydration on the control of panting and sweating in black Bedouin goat. Physiological Zoology 56, 412–418.
Schaefer AL, Jones SDM, Tong AKW, Lepage P, Murray NL (1990): The effects of withholding feed and water on se-lective blood metabolites in market-weight beef steers. Canadian Journal of Animal Science 70, 1151–1158. Schalm OW, Jain NC, Carroll EJ (eds) (1975): Veterinary
Hematology. 3rd edn. Lea & Febiger, Philadelphia. 807 pp.
Shoeman SJ, Visser JA (1995): Comparative water consump-tion and efficiency in three divergent sheep types. Jour-nal of Agricultural Science 124, 139–143.
Sies H (1991): Oxidative stress: introduction. In: Sies H (ed.): Oxidative Stress: Oxidants and Antioxidants. Aca-demic Press Ltd., Orlando. 15–23.
Silanikove N (1985): Effect of dehydration on feed intake and dry matter digestibility in desert (black Bedouin) and non-desert (Swiss Saanen) goats fed on lucerne hay. Com-parative Biochemistry and Physiology 80, 449–452. Silanikove N (1994): The struggle to maintain hydration
and osmoregulation in animals experiencing severe de-hydration and rapid rede-hydration: the story of ruminants. Experimental Physiology 79, 281–300.
Silanikove N (2000): The physiological basis of adaptation in goats to harsh environments. Small Ruminant Research 35, 181–193.
Turner JC (1979): Osmotic fragility of desert bighorn sheep red blood cells. Comparative Biochemistry and Physiol-ogy 64, 167–175.
Zhou X, Burg MB, Ferraris JD (2012): Water restriction increases renal inner medullary manganese superoxide dismutase (MnSOD). American Journal of Physiology. Renal Physiology 303, F674–F680.
Received: 2015–05–28 Accepted after corrections: 2016–09–17
Corresponding Author: