Fake News and Social Media
Dana Lange
University of Twente
1st Supervisor: Margot Kuttschreuter
Abstract
Fake News and Social Media
Introduction
Much media attention has been given to the concept of ‘fake news’. The increasing spread of fabricated information is undermining society's trust in the credibility of information (Lazer et al., 2018, Lilleker, 2017), especially, since its distribution on online social media platforms is misleading perceptions of what is fact or fiction. The focus of this study is the fact that many people cannot distinguish between honest and fabricated information which is causing severe ineffectiveness and uncertainty in seeking and processing information. However, in times of global crises effective risk communication, opinion-forming, and decision-making based on truthful information is vital to avoid harm and facilitate societal safety. Global crises rely on effective risk and crisis communication which needs ‘accurate’ information as a fundamental basis of sound opinion formation and active risk behaviour (Steelman & McCaffrey, 2012).
Climate change is one example of a global public policy issue where the future is decided upon by the public conversation about the topic (Weber & Stern, 2011; society influences policy change, see Geels & Schot, 2007). Misperceptions of the risk of climate change is a danger that may lead to unsafe behaviours and inadequate precautions. If not addressing ‘fake news’, distorted perceptions will continue to hinder people to engage in appropriate seeking and processing. This would be detrimental for encouraging people’s self-engagement in preventing harm in crisis situations necessary for protection and safety (Kievik & Gutteling, 2011; Grothmann & Reusswig, 2004). The key to more accurate risk perception and risk behaviour is the fulfillment of information acquisition based on truthful information instead of fabricated information. However, not only fabricated information itself but also the idea of its existence continues to complicate decision-making processes especially online due to a flawed opinion-forming and decision-making. Since ‘fake news’ and climate change are two interlinked global concerns, it is vital to understand their working dynamics especially when it comes to information assessment to prevent harm and design intelligent solutions for future information communication.
the research question: what are crucial characteristics of online information that determine perceived credibility?
Fake news
According to Lazer et al. (2018), ‘fake news’ is defined as “fabricated information that mimics news media content in form but not in organizational process or intent” (p. 1094). This means
that people actively distribute false information disguised as truthful information reporting. Also, ‘fake news’ are often politically charged or utilized to control the direction that internet traffic is taking, thereby, finding distribution through social media (Hunt, 2017) as well as traditional media (Lilleker, 2017, as cited by Gelfert, 2018). The term ‘fake news’ has become prominent worldwide only after October 2016 (Google Trends, 2019, see Appendix, Figure 1). Collins Dictionary states that the usage of the word ‘fake news’ has increased by 365 percent since 2016 (Flood, 2017). This is showing an extreme interest of the public into the concept. However, the idea of false information distribution for other purposes than truthful information providing has been prominent long before 2016 (using terms such as propaganda, hoax, conspiracy or misinformation, see Schifferes, Newman, Thurman, Corney, Göker, & Martin, 2014) and has spread far beyond the world of politics only.
The fact that attention is given to ‘fake news’ in this wide scope shows that the concern of misinformation is very prevalent in society. The digital news report by Reuters and the University of Oxford (Newman, Flecher, Kalogeropoulos, Levy & Klein Nielsen, 2018) examined perceived concerns of ‘fake news’ and their perceived prevalence in 37 countries. The countries Germany and the Netherlands are scoring lowest in this report. With a score of 30 percent (compared to a global 54 percent on average), the Netherlands show that the public is somewhat concerned about ‘fake news’. Only 10 percent of the people say that news cannot be trusted in their majority. Germany is scoring slightly higher with a score of 37 percent concern. Even though Germany and the Netherlands are scoring below average the digital news report, the above-presented percentages of concern about ‘fake news’ are remarkably and unacceptably high.
Social Media
process. Modern age’s exposure to excessive amounts of information online in an ever-growing pool of sources has made it difficult for users to assess them properly and often, a simplified mechanism to evaluate risks and to shape responses is used (heuristic processing, e.g. Kahneman, Slovic & Tversky, 1983). The spread of the idea of ‘fake news’ and the ‘fake news’ items themselves pose a challenge to decide whether online information is genuine or not. This is especially the case on social media platforms which support ‘citizen-journalism’ (Tilley & Cokley, 2008). The growing concern and widespread knowledge about the existence of ‘fake news’ have not helped in relieving people in their uncertainty about the information they encounter as there are only extensive ways to verifying online information (e.g. fact checking). Also in the Netherlands and in Germany, it is not trusted that online social media user truthfully provide objective, credible information; both countries state to be concerned about the trustworthiness of information on social media (Germany having 18 percent and the Netherlands having 22 percent trust in social media information; Nic, Fletcher, Kalogeropoulos, Levy, & Nielsen, 2018). Yet, online platforms are still fulfilling an important role since in Germany, an increasing trend with now about 31 percent of the people use social media as a news source while in the Netherlands, 43 percent of the population uses social media sources for news retrieval (Newman, Fletcher, Kalogeropoulos, Levy & Nielsen, 2018). The reliance on intermediary sources make it difficult to frame the problem of climate change correctly for users to grasp (Weber & Stern, 2011). Indirect exposure distorts the understanding of the risk characteristics, especially when the sources on social media are not always qualified to make certain claims and non-scientists have limited resources to evaluate these claims. The (dis)trust in social media information is of special concern due to its relatively high influence on people’s behaviour (Siegrist & Zingg, 2014) while not being controlled by an instance for its correctness. This is especially dangerous for people who rely on web-based information distribution but do not systematically verify the information. This is true for example for students who rely mostly on their own or friend’s expertise while not having had training or help to decide on which information to trust (Metzger, Flanagin, & Zwarun, 2003).
Information seeking and processing
how this ultimately affects behaviours likely to be adopted in the face of specific risks (Griffin, Dunwoody, & Neuwirth, 1999). The RISP model is thought to be an aid in understanding the complex process of information seeking and processing and can show how perceived credibility is linked to this process.
Online information items are stimuli that people encounter in their lives every day and, consciously or unconsciously, people decide whether to assign credibility, which is part of the information processing process. The RISP model assumes that there is a circular process involved; the outcome of any information processing ‘feeds back’ to alter individual’s perceptions and attitudes which then, anew, shape information processing. This means that information processing is naturally different for all individuals depending on their individual characteristics. However, for all individuals alike, for information processing to be efficient and effective, adequate information is vital to be ‘fed back’ into this circular process. Only truthful information can accurately inform people on their quest to seek and process information and form their beliefs. On the contrary, faulty information offers the illusion of being informed correctly and holding truthful beliefs, which result in behaviour based on wrongful information. This ultimately has negative consequences for the individual since the goal of effective risk communication is not likely to be reached (e.g. awareness, motivating actions, or education; Rowan, 1991 as cited by Steelman & McCaffrey, 2012).
Due to the affective response (such as information seeking behaviour), also physical responses become more likely. Taken together perceived credibility indirectly influences an individual’s information processing and motivation for further information seeking.
The second pathway toward an information sufficiency decision also starts with people’s individual characteristics. Individual characteristics influence one’s perceived pressure by social norms to have enough knowledge about a certain issue (see Figure 2). This pathway is also indirectly influenced by perceived credibility since, among others, individual attitudes decide on this perception. A higher perception of social pressure motivates higher information seeking and processing behaviour. Other people’s opinions are likely to be considered when deciding whether to seek information and how to process it.
The RISP model offers an understanding of how complex information seeking and processing is. It offers the insight that many internal and external cues can affect information processing, one of which could be perceived credibility. This strengthens the idea that the presentation of information in a certain way can either facilitate or hinder adequate decision-making dependent on an individual’s attitudes whether information can be thought of as truthful or not. Figure 2 provides an overview of the determinant and their relationship with each other.
Climate Change
misinformation on Facebook; see Nuccitelli, 2018). And even though there is a scientific consensus, many publications have been attacked on social media to be ‘false’ or a conspiracy theory (many groups with organized campaigns try to undermine the scientific view that climate change is real, Van der Linden, Leiserowitz, Rosenthal & Maibach, 2017, one example is the Global Warming Petition Project, Cook 2015).
Perceived Credibility and its Determinants
Without truthful information there will be a chain reaction of a) no adequate information seeking, leading to b) no adequate information processing, leading to c) impaired decision making, leading to d) impaired information behaviour that may cause stagnation or worsening of the current climate change situation. Ambiguous information about climate change is taking people’s chance to act appropriately and ultimately even endangering lives in future crisis situations. This is the reason why Lazer (2018) has called for more research and the reduction of ‘fake news’. Lazer (2018) animates the scientific community to redesign the “information ecosystem”. To do this we must understand the working and problems of the present information system to (re)form a future system, to which this study tries to contribute to. Some of the most important characteristics are thought to be, but not limited to, perceived expertise of the information source (source expertise), the perceived opinion of other user comments accompanying online information (comment sentiment), and the display of online advertisements accompanying online information (advertisement). These characteristics will be the focus of this study; however, it should not be disregarded that there may be other variables that can influence people.
Source Expertise. One well-known phenomenon is that people perceive a statement
procedural information is needed to decide. Based on the previously discussed research, the first hypothesis that this study will test is whether the presentation of an information item with positive source expertise will be perceived significantly more credible than with negative source expertise.
Comment Sentiment. As suggested by the RISP model, the idea that other people relevant to oneself think one should know something about a topic is important for information seeking and processing. And, based on the study of Winter and Krämer (2016), it seems that comments by other people indeed have a relevant influence on information assessment. The authors suggest that people tend to look at comments and ratings to infer the overall sentiment of other people’s opinions on a specific topic. In their research, a sample of students showed that they were susceptible to this influence of comments in the form of heuristic cues. Another study by Vendemia, Bond, and DeAndrea (2019) suggests readers trust comments as being a validation of the information content. The users are assumed to be unaffected by biases and are taken into account when validating information as long as they are perceived as trustworthy and uninfluenced by ulterior motives. Both studies above infer that opinion formation is influenced by one's heuristic credibility evaluation that rules one's opinion correct if other agree (“If others agree it’s correct, then it’s probably credible.”, Metzger, Flanagin, & Medders, 2010, p. 429). This means comments by other users influence the forming of beliefs about information. Therefore, the second hypothesis of this study is that the presentation of information accompanied by positive comment sentiment will be perceived significantly more credible than with negative comment sentiment.
Advertisements. People associate advertisements as a type of ‘fake news’ or associate
it with ‘fake news’ especially intrusive forms of advertisements (Nielsen & Graves, 2017). Research by Tudoran (2019) indicates that people increasingly make use of ‘ad-blockers’ to minimize the amount of commercial they are exposed to. As shown by Ha and McCann (2008, as cited by Tudoran, 2019), people find advertisements becoming more intrusive which triggers the feeling of being forced to their exposure. Also, it triggers the feeling of being interrupted since one has difficulties comprehending the information given. All this fosters frustration, physiological stress, and negative affect. Advertisement, therefore, increases resistance not only toward the advertisement itself but also toward the websites and their content to which the advertisements were attached. People find advertisements with animations, videos, and sounds most intrusive.
effects. These results yield the third hypothesis that will be investigated in this study, namely, that the presentation of information accompanied by no advertisements will be perceived significantly more credible than with intrusive and not topic-related advertisements.
Methods
Participants and Design
The assessment of the independent variables (source expertise, advertisements, and comment settings) was done by three experiments with each having a one factor manipulation of the independent variables. The experiments were compiled into an online experimental questionnaire1. The questionnaire was piloted with two participants and then distributed with convenience sampling and via the platform Qualtrics in the time from April 2019 to May 2019. A total of 253 participants took part in the study of which 144 participants were eligible for data analysis. Eligibility to participate in the study was determined by the criteria that the students were in an age range of 18 to 29 years, had given informed consent, had a good English language proficiency, and completed the questionnaire until the end. A total of 144 participants (27% female, 73% male2; 𝑀
𝑎𝑔𝑒= 21,98 years, SD = 2.193; 7.6% Dutch and 92.4% German; see Table 1) were included in the study. Consent was given in written form prior and posterior to the study, describing the general purpose of the study, confidentiality and privacy issues, potential risks, and contact information. The study was entirely in English. Participants were randomly assigned to a sequence through the study (see Figure 3). Overall, the information was presented in a specific environment based on the variable under consideration, i.e. source expertise, comment setting, or advertisements. The sequence of the study always consisted of three information items which will be either high or low for every variable tested. This means, the participants were randomized, first, into either the high or low condition of source expertise, secondly, randomized into either the positive or negative comment sentiment condition, and thirdly, randomized into either the advertisement or no-advertisement condition. Questions to each condition were asked after the information items. This study was reviewed and approved by the Ethics Committee of the University of Twente in Enschede, Overijssel.
1 This questionnaire was interlinked with a second study about the assessment of information in the social media context concerned with the
topic of vaccines.
2 missing values = 44
Table 1.
Demographics of N=144 participants
Factor Observed
Gender (N=100) Male
Female
27 (%) 73 (%)
Nationality (N=144) Dutch German
7.6 (%) 92.4 (%)
Age (N=125) 21.98 (years)
Figure 3. Overview of the procedure and where randomization sorted participants into conditions
Manipulation for Source Expertise
[image:13.595.80.519.300.480.2]academic occupations in fictional organizations (e.g. Dean of the Faculty of Geosciences in the fictional University of ‘MNL’, a Director of the eScience Center of the fictional organization NLeSC, a chairman in Climate Dynamics of another fictional organization, the Victoria University). Social media characteristics such as ‘Posts’, Amount of people ‘Following’, amount of people to be ‘Followers’, and ‘Likes’ were instated to look influential but not overly popular. To avoid any influence by the medium used, a social media platform was specifically created for this study.
As a non-expert source, this study utilizes the personality of the U.S President Donald Trump as an information distributor (see Appendix, Figure 5). In the Netherlands, level of trust in Donald Trump in 2017 was very low (only 4 percent agreed to him being trustworthy, according to a survey from I&O Research, & de Volkskrant, 2017). Also in Germany, trust in Trump is low with only 11 percent (McCarthy, 2017). The presentation of Donald Trump’s created social media platform was designed to resemble his main communication channel ‘Twitter’ almost to the last detail (at the stand of April 2019). Due to the renownedness of his account, major changes were not made.
Manipulation Check. Both the high and low source expertise items included the same information content to make sure measured differences are due to the manipulation. Participants were asked to complete a manipulation check question to assess whether the source was perceived to be an expert (‘I think the post is written by an expert in climate change’ with a scale of ‘yes’, ‘no’ or ‘maybe’). The results of a chi-square test show that there was a significant difference between high source expertise (N = 72) and low source expertise (N = 72); χ2(2, N = 144) = 70.38, p = .000). In the high source expertise condition, a medium number of participants (40,3 percent) thought that the source of the information was an expert (38.9 percent were unsure and 20.8% disagreed). The low source expertise condition shows that a very high number of participants (90.3 percent) did not think that the author of the information is an expert. The manipulation check is therefore successful.
Manipulations for Comment Sentiment
replies to the post and a negative sentiment was defined as non-supporting replies. Example of positive and negative comment sentiment can be seen in Table 7.
Manipulation Check. To ensure that the observed differences between the two conditions were due to participants perceiving the comments as either positive or negative, a manipulation check was given to be filled out (‘The comments were overall positive’). The positive sentiment group (N = 71) had a mean of 1.58 (SD = .69), indicating that participants in the positive sentiment group indeed showed a trend toward perceiving positive comments. In this group, half of the participants (53,5 percent) said they did find the comments positive; more than a fourth of the participants (35,2 percent) said they were unsure and only a small number of participants (11,3 percent) did not find the comments positive. Unfortunately, due to a question not being formulated correctly, the data for perceived positivity of the comments is not available for the negative sentiment condition.
Manipulation for Advertisement
Manipulation. To test the influence of advertisements on perceived credibility, an article from a fictitious online newspaper with either intrusive advertisement or no advertisement was used (see Appendix Figure 6 and 7). The fictitious content of the news item was aimed at to be neutral toward the topic (by comparing the advantages and disadvantages of a specific topic). The content encompassed that hysteria about false vaccine risks often overshadows the challenges of detecting the real ones. The article informed the reader that vaccines can be both potentially helpful as well as harmful. The advertisements were chosen to be intrusive to the reading process as they were in the form of banners and pop-ups where also a small part of the article was obstructed. As advertisements, a clothing line announcing ‘sale’, a pop-up advertising an online game, and a cookie banner were chosen.
Manipulation Check. A manipulation check question was included in the
Instrumentation
The questionnaire included a scale to measure perceived credibility using a shortened version of the measurement of credibility by Gaziano and McGrath (1986). Three main concepts were converted into items creating the scale for perceived credibility. These concepts were believability (the participants believed the information content), fairness (the participants believed the information was free from bias), and accuracy (the participants believed that the information was correct in all regards; see Appendix, Table 7). The response format was in the form of a Likert scale ranging from 1 = ‘strongly disagree’ to 7 = ‘strongly agree’. Analyses of Cronbach’s Alpha show that all ‘perceived credibility’ scales had an alpha ranging from alpha >.70 being ‘good’ to alpha >.90 being ‘best’ depending on the condition measured. The scale, therefore, demonstrated satisfactory reliability (see Table 2). A scale score was computed by calculating the mean scores of all three items with an equal score weight.
Additional questions were asked to gain deeper insight into the behaviour and possible reasoning of participants when assigning credibility (see Appendix, Table 7). In the source expertise condition, an item is asking participants about their reading behaviour regarding the profile description of the source of the information. This question was intended to be an inference whether people take it into account the profile description which was intended to be the main and most direct communication point of source expertise.
For deeper understanding within the condition of comment sentiment, additional questions were asked (see Appendix, Table 7). It was of additional interest whether participants not only noticed the comments (manipulation question) but also read through the presented comments. Also, it was of interest to know if participants overall found the comments and their source trustworthy since the pilot showed that the source was not perceived neutral as it was intended because it was not found trustworthy. Additional to this it was of interest to know the level of believability participants put in the source of the main information post to infer if the source has a confounding effect on the findings.
A brief demographics section asked participants about their age (18-29), gender (male, female, others), nationality (Dutch, German, other), and student status (yes, no) was added (see Appendix, Table 7).
[image:17.595.73.524.219.302.2]
Table 2.
Overview of Cronbach’s Alpha of each perceived credibility scale in the three manipulation
conditions of source expertise, comment sentiment and advertisement
Source Expertise (alpha = )
Comment Sentiment (alpha = )
Advertisement (alpha = )
High (credibility) .79 .84 .86
Low (credibility) .76 .82 .90
Procedure
Participants completed a self-administered questionnaire independently and self-determined in time and space. The participation in the research lasted approximately 15 minutes. The data collection procedure was the same for all groups. Participants were given introduction statements and explanation throughout the questionnaire for guidance (see Appendix, Table 7). First, participants were asked to consent to the research. Then, they were given the questionnaire (see Appendix, Table 7), where, first, demographic specifications are asked to assign eligibility for the study Then, participants were randomly allocated to three different information items, where at least one item assessed source expertise, one item assessed comment sentiment, and one item assessed advertisement influence. After every item, the participants filled in the perceived credibility scale. Also, manipulation checks and additional analysis questions were asked after every item. When having answered all questions, the participants were debriefed about the true nature of the study, including that manipulations were used. Participants were asked for consent to the usage of their data once more. Lastly, participants were thanked for their participation and the study ended.
Data Analysis
independent samples t-tests. Compared were the independent variables source expertise, comment sentiment, and advertisement, with the dependent variable perceived credibility. Chi-square tests were used to assess relationships between the independent variables and additional analyses questions. Crosstabs were used to infer overall frequencies of responses. The null hypotheses were rejected if p ≤ 0.05. To infer the power and effect size of this study, the software G*Power was used (Faul, Erdfelder Lang, & Buchner, 2007). The software Adobe Illustrator was used to create error bar graphs.
Results
Source Expertise.
Figure 8. Error bar chart showing the means of perceived credibility and the standard error in the low and high condition of source expertise
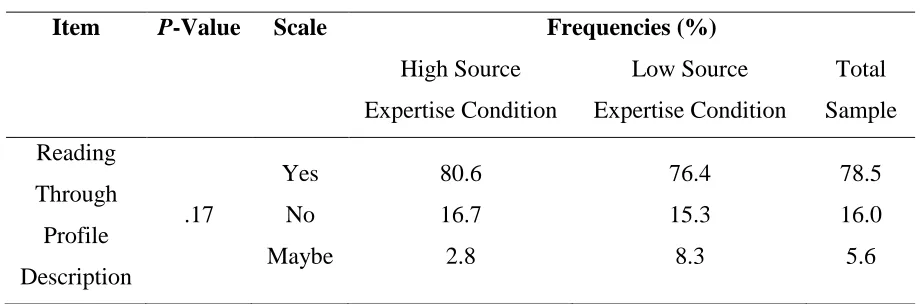
Additional Analyses. A chi-square test of independence was performed to examine the relation between reading through the profile description of the presented source and the perceived expertise of the presented source. The relation between these variables was not significant, χ2 (2, N =144) = 2.12, p = .17. Crosstabs show that, in total, a high amount of the participants (77.5 percent; 75.8 percent of the participants in the low expertise condition and 79.1 percent in the high expertise condition) did read through the profile description. This showed that most participants did consider the profile description of the sources online. Only a small number of participants (5.4 percent total) were unsure if they read it, and a relatively low amount (17.1 percent total) said they did not read through the profile description. Table 4 provides an overview of this additional finding, including p-value and frequencies of the item responses.
Table 4.
Overview of additional analysis of reading behaviour in the conducted experiment of
‘source expertise’ manipulation on information credibility, including p-values and
frequencies of the item responses of N=144 participants
Item P-Value Scale Frequencies (%)
High Source Expertise Condition
Low Source Expertise Condition
Total Sample Reading
Through Profile Description
.17
Yes No Maybe
80.6 16.7 2.8
76.4 15.3 8.3
78.5 16.0 5.6
Comment Sentiment
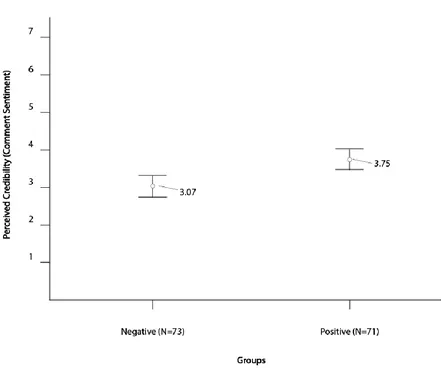
Figure 9. Error bar chart showing the means of perceived credibility and the standard error in the negative and positive condition of comment sentiment
Additional Analyses. A chi-square test of independence was performed to examine the relation between reading through the comments and the perceived comment sentiment. The relation between these variables was slightly significant, χ2 (2, N =144) = 6.249, p = .022. In total, a high percentage (81.9 percent) of the participants read through the comments under the information item. Only the small amount of the total participants (3.5 percent) were unsure and a low amount (14.6 percent) said that they did not. Table 5 provides a more detailed overview of these findings, including p-values and frequencies of the item responses.
percent) did not think the comments were trustworthy. Table 5 provides a more detailed overview of these findings, including p-values and frequencies of the item responses.
[image:22.595.73.529.359.613.2]A chi-square test of independence was performed to examine the relation between the believability of the author and the perceived comment sentiment. The relation between these variables was marginally significant, χ2 (2, N =144) = 4.030, p = .06. A small amount of the total participants (9.7 percent) say the author was believable, just about half of the total participants (52.1 percent) were unsure and the relatively high number of total participants (38.2 percent) said they did not find the author believable. Table 5 provides a more detailed overview of these findings, including p-values and frequencies of the item responses.
Table 5
Overview of additional analysis of reading behaviour in the conducted experiment of
‘comment sentiment’ manipulation on information credibility, including p-values and
frequencies of the item responses of N=144 participants
Item P-Value Scale Frequencies (%)
Negative Sentiment Condition Positive Sentiment Condition Total Sample Reading Through Comments .022 Yes No Maybe 87.7 12.3 0.0 76.1 16.9 7.0 81.9 14.6 3.5 Comment Trust- worthiness .046 Yes No Maybe 4.1 35.6 60.3 9.9 21.1 69.0 6.9 28.5 64.6 Author Believe- ability .06 Yes No Maybe 5.5 43.8 50.7 14.1 32.4 53.5 9.7 38.2 52.1 Advertisement
Main Findings. To test whether the presence of information without advertisements
difference between groups determining perceived credibility information with either absence or presence of advertisement; t(142) = .16, p = .44. We can be 95% confident that the true difference between these means is CI = [-.43, -.51]. Figure 10 provides a graphic representation of the means and standard error which show that there is no difference between groups. Hypothesis 3 is, therefore, not confirmed.
[image:23.595.77.515.192.553.2]
Figure 10. Error bar chart showing the means of perceived credibility and the standard error in the no advertisement and advertisement condition
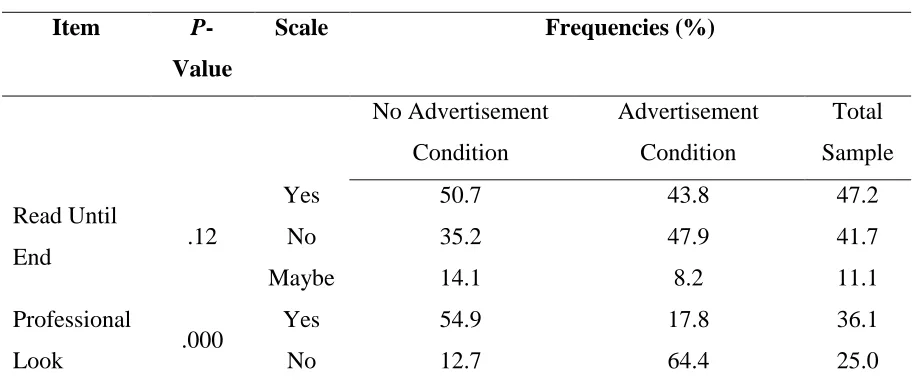
A chi-square test of independence was performed to examine the relation between perceived professionality of the outlook of the information newspaper and the presence of advertisement. The relation between these variables was significant, χ2 (2, N =144) = 41.54, p = .000. Crosstabs show that in the advertisement group, a few of the total participants (17.8 percent) thought the newspaper is looking professional. A few of the participants (17.8 percent) are unsure and most total participants (83.9 percent) though it was not professional looking. In comparison, the no advertisement group shows that roughly half of the participants (54.9 percent) thought it was professional looking, a moderate number of participants (32.4 percent) were unsure, and a few participants (12.7 percent) found the website was not professional looking.
[image:24.595.71.529.563.757.2]A chi-square test of independence was performed to examine the relation between perceived intrusiveness of the advertisement and the presence of advertisement. The relation between these variables was significant, χ2 (2, N =144) = 53.22, p=.000. Additionally, a chi-square test of independence was performed to examine the relation between perceived distraction due to the advertisement and the presence of advertisement. The relation between these variables was significant, χ2 (2, N =144) = 60.41, p=.000. For both intrusiveness and distraction, frequencies of the 5-point Likert scale confirm an indication that advertisements are both distracting and intrusive and that a web page without advertisements is seen less intrusive and distracting. Table 6 provides an overview of these additional findings, including p-values and frequencies of the item responses.
Table 6. Overview of additional analysis of reading behaviour in the conducted experiment
of ‘advertisement’ manipulation on information credibility, including p-values and
frequencies of the item responses of N=144 participants
Item
P-Value
Scale Frequencies (%)
No Advertisement Condition Advertisement Condition Total Sample Read Until
End .12
Yes No Maybe 50.7 35.2 14.1 43.8 47.9 8.2 47.2 41.7 11.1 Professional
Look .000
Maybe 32.4 17.8 38.0
Intrusiveness .000
1 2 3 4 5 0.0 20.0 52.9 10.0 17.1 47.9 20.5 16.4 11.0 4.1 24.5 20.3 34.3 10.5 10.5
Distraction .000
1 2 3 4 5 2.9 17.1 14.3 21.4 44.3 53.4 23.3 8.2 11.0 4.1 28.7 20.3 11.2 16.1 23.8 Discussion
This study aimed to contribute to the understanding of the increasingly influencing role of ‘fake news’ distribution by researching how people process information. A total of 144 participants filled out an online questionnaire to assess whether the information item characteristics of source expertise, comment sentiment, and advertisement affect perceived credibility toward the information itself. The characteristics were presented in either a high or a low expertise condition and then compared. Results show that groups did significantly differ regarding their perceived credibility when shown different conditions of source expertise, as well as comment sentiment. However, there was no significant difference between groups in the perceived credibility when presented different conditions of advertisement. Overall, this study found significant confirmation for the fact that people not only decide upon credibility by reading information but also consider the context in which this information appears. People decide upon how much trust to assign information using multiple contextual cues, of which two of them are source expertise and comment sentiment.
sentiment. This study confirmed that people find information more credible when presented with supporting comment sentiment than when presented with a non-supporting comment sentiment. This confirms the findings of other studies (e.g. Winter & Krämer 2016; Vendemia, Bond, and DeAndrea, 2019; Metzger, Flanagin, & Medders, 2010).
Hypothesis 3 was that the presentation of information accompanied by no advertisements will be perceived significantly more credible than with intrusive and not topic-related advertisements. This study did not find any indication that people considered advertisements when judging the perceived credibility associated with information. Hypothesis three is therefore not confirmed by this study. This result is rather surprising as it illustrates the opposite of what was expected and does therefore not confirms the findings of other studies (Nielsen & Graves, 2017; Tudoran, 2019). This mismatch with existing research will be further discussed in the limitations of the study.
Theoretical Implications
Strengths and Limitations
With the time and resources available, this study was able to demonstrate that contextual cues of information have a significant impact on information processing. However, with more time and resources available, more validity, reliability, and generalizability could be assigned to the results of this study (e.g. in terms of more extensive piloting, predictive power, or correcting for errors such as missing data). Especially, access to a more representative sample of students in the Netherlands could be improved as it seems that roughly 90 percent of the participants were German and only 10 percent Dutch. Also, a more time-consuming sampling method could improve the possibly limited viewpoint of voluntary response sampling.
Regarding the experiment of source credibility, the study was successful at manipulating expertise, among others, by using the profile description of the online personality where most of the participants read through. Regarding the experiment of comment sentiment, the study was only partly successful. For one, the manipulation check question was missing data to infer if people thought the comments were overall positive in one condition, this makes a manipulation check not possible. Also, many participants had high uncertainty knowing whether the comments could be trusted. Not trusting the comments likely was followed by not trusting the opinions and the overall sentiment of the comments. This means that many participants may not have adopted the overall positivity or negativity of the comments as expected. With more perceived trust in comments, it is likely to expect that people show a more polarized opinion due to a higher rate of validation rate. Also, this study achieved to present the source of the information item by a source which creates high uncertainty about its expertise. This was done to animate people in their uncertainty to attend to additional cues regarding credibility, as well as, to avoid an influence of source expertise in this experiment. Roughly half of the participants showed this uncertainty. In future research, it may be achievable to increase this uncertainty even further to minimize the possibility of a confounding effect of source expertise on perceived credibility.
(2019) had found that intrusive advertisements can bring negative attitudes (due to frustration, physiological stress, and negative affect) toward using the website with the advertising content. However, this study did not find that triggering negative attitudes (such as intrusiveness, distraction, unprofessional look) via advertisements has shown that people associate advertisements with fake news.
This begs the question of how to explain the diverging results. Since the manipulation check was successful it is being ruled out that the divergence in the results stem from the groups not realizing that there was an advertisement present or not. However, one may question if the study correctly presented the advertisement as intrusive enough due to missing animations, video or sound. This could mean that negative attitudes were not triggered, and people were not affected by it. Yet, additional analyses have shown that people did find the advertisement significantly intrusive and distracting from the text. Another possible explanation could be that people less likely discard the message if the source is rated highly credible (Gotlieb & Sarel, 1992). If participants decided that the webpage looks professional enough to disregard the message and the advertisement in their judgment process to only include the source expertise, then this would hold true and, as a result, participants would see the information as more credible. Yet, 64,4 percent of the advertisement group did not think that there was a professional outlook of the media website which leads me to disregard this explanation as well. The credibility of the web page likely did not likely influence the results.
Another possible explanation is that people did not entirely read the text until the end and did not acquire enough knowledge to meaningfully answer the questions asked. Due to the text being rather long and positioned at the end of the survey, it is likely that participants possibly did not have that much concentration anymore. This could have meant that participants did not pay attention to the information item and the following questions anymore. Indeed, less than half of the total participants stated to have read the text until the end (roughly 47 percent stated ‘yes’) and roughly 40 percent did openly state they did not read the text until the end (about 11 percent were not sure in their answer). This possible lack of concentration could have led to the neglect of reading the information given and created a random pattern of filling out the perceived credibility scale and additional analyses questions.
answer and instead it is advised to investigate the matter of the effect of intrusive advertisement on ‘fake news’ in further research.
Implications
The findings of this study yield some significant insights about people’s information processing on social media for many entities and organizations
It is especially important for all stakeholders to understand the evident fact that many people are affected by news media and that this influence can be misused but also utilized for good. It can be pointed out that climate change is an example of a topic which yields high stakes and that can be subject to people's subjective presentations of it as well as people’s heuristic processing of information. This study shows how climate change information is heavily influenced by the way it is presented and especially in which context (for example by its source or public reactions). This influence has much power over the course of the debate and the eventual decision making and course finding of climate change politics.
Specifically, this study indicates that to make communication on social media effective, stakeholders involved may want to present their message as written by an expert to increase their effectiveness. This is especially important for risk and safety issues as it is important to communicate the facts through an ‘expert’ channel to achieve greater impact. However, it must be remembered that presenting a source as being an expert to achieve this impact may be misused by other stakeholders maximizing the illusion of credibility when there is none (as it is happening already on social media widely). Another implication is that the public opinion has a significant effect on readers’ opinions (as suggested by Vendemia, Bond, and DeAndrea, 2019) which is why many readers also attend to comments by other readers. When information is presented as socially approved, it can be seen as more trustworthy by the readers, and vice versa. Overall, it is advised to use the results of this study in addition with more extensive research to communicate the fragile and vulnerable nature of human information processing and the possible facilitating but also detrimental effects this may have on the future.
Recommendations
makes it easy and tempting to manipulate these online. People do not know how to assess credibility without extensive checking which is why many people use heuristic processing and are easily mislead by information online.
This is a serious risk with many negative consequences. As a recommendation, this study, it is advised to start empowering individuals to evaluate information online more extensively before making up their beliefs and opinions. This empowerment is pointed out by Lazer et al. (2018), who suggests better education in source checking and replacing ‘fast checking’ of sources with more systematic and deeper source checking approaches.
Educating individuals about the fragile nature of information processing might help people to identify their cognitive biases and aid them to consciously change their information processing strategy into a more involved approach. It also might inform people that were not aware that their own communication may be hindered by the contextual channel that they are using or creating. They have the chance to be informed that they can make their communication more effective. This is not only true within the topic of climate change but within every topic communicated through social media.
Further research
References
Adobe (2019). Adobe Illustrator [Computer software].
Authority. (2019) The Free Dictionary. Retrieved from https://www.thefreedictionary.com/authority
Bennett, W. (2016). News: The politics of illusion. Chicago: The University of Chicago Press.
Cook, J. (2015). The 5 telltale techniques of climate change denial - CNN. Retrieved from
https://edition.cnn.com/2015/07/22/opinions/cook-techniques-climate-change-denial/index.html
Dessler, A., & Parson, E. A. (2010). The science and politics of global climate
change: A guide to the debate. Cambridge University Press.
Faul, F., Erdfelder, E., Buchner, A., & Lang, A.-G. (2009). Statistical power analyses using G*Power 3.1: Tests for correlation and regression analyses. Behavior Research
Methods, 41, 1149-1160.
Flood, A. (2017). Fake news is 'very real' word of the year for 2017. Retrieved from https://www.theguardian.com/books/2017/nov/02/fake-news-is-very-real-word-of-the-year-for-2017
Gaziano, C., & McGrath, K. (1986). Measuring the Concept of
Credibility. Journalism Quarterly, 63(3), 451-462. doi: 10.1177/107769908606300301
Geels, F. W., & Schot, J. (2007). Typology of sociotechnical transition
pathways. Research policy, 36(3), 399-417.
Google Trends. (2019). Retrieved from https://trends.google.com/trends/?geo=US
Gotlieb, J., & Sarel, D. (1992). The Influence of Type of Advertisement, Price, and Source Credibility on Perceived Quality. Journal Of The Academy Of Marketing
Science, 20(3), 253-260. doi: 10.1177/0092070392203006
Griffin, R. J., Dunwoody, S., & Neuwirth, K. (1999). Proposed model of the relationship of risk information seeking and processing to the development of preventive behaviors. Environmental research, 80(2), S230-S245.
Grothmann, T., & Reusswig, F. (2006). People at Risk of Flooding: Why Some Residents Take Precautionary Action While Others Do Not. Natural Hazards, 38(1-2), 101-120. doi: 10.1007/s11069-005-8604-6
Hirschman, E., Kahneman, D., Slovic, P., & Tversky, A. (1983). Judgement under Uncertainty: Heuristics and Biases. Journal Of Marketing Research, 20(2), 217. doi: 10.2307/3151689
Horst, M., Kuttschreuter, M., & Gutteling, J. (2007). Perceived usefulness, personal experiences, risk perception and trust as determinants of adoption of e-government services in The Netherlands. Computers In Human Behavior, 23(4), 1838-1852. doi:
10.1016/j.chb.2005.11.003
Hunt, E. (2017). 'Fake news' named word of the year by Macquarie Dictionary. Retrieved from https://www.theguardian.com/australia-news/2017/jan/25/fake-news-named-word-of-the-year-by-macquarie-dictionary
IBM Corp. (2016.) IBM SPSS Statistics for Windows, Version 24.0. Armonk, NY: IBM Corp.
I&O Research, & de Volkskrant. (2017). Trust in the capacities of American President Donald Trump in the Netherlands in 2017*. In Statista - The Statistics Portal. Retrieved May 29, 2019, from
Johnson, E., Shu, S., Dellaert, B., Fox, C., Goldstein, D., & Häubl, G. et al. (2012). Beyond nudges: Tools of a choice architecture. Marketing Letters, 23(2), 487-504. doi: 10.1007/s11002-012-9186-1
Kievik, M., & Gutteling, J. (2011). Yes, we can: motivate Dutch citizens to engage in self-protective behavior with regard to flood risks. Natural Hazards, 59(3), 1475-1490. doi: 10.1007/s11069-011-9845-1
Lazer, D., Baum, M., Benkler, Y., Berinsky, A., Greenhill, K., & Menczer, F. et al. (2018). The science of fake news. Science, 359(6380), 1094-1096. doi:
10.1126/science.aao2998
Lilleker, Darren G., 2017. Evidence to the Culture, Media and Sport Committee ‘Fake news’ inquiry presented by the Faculty for Media & Communication, Bournemouth
University. Documentation. Bournemouth University.
Metzger, M. J., Flanagin, A. J., & Zwarun, L. (2003). College student Web use, perceptions of information credibility, and verification behavior. Computers &
Education, 41(3), 271-290.
Metzger, M. J., Flanagin, A. J., & Medders, R. (2010). Social and Heuristic
Approaches to Credibility Evaluation Online. Journal Of Communication, 60(3), 413-439. doi: 10.1111/j.1460-2466.2010.01488.x
Milgram, S. (1963). Behavioral Study of obedience. The Journal Of Abnormal And Social Psychology, 67(4), 371-378. doi: 10.1037/h0040525
Nielsen, R. K., & Graves, L. (2017). News you don’t believe”: Audience perspectives on fake news. Reuters Institute for the Study of Journalism, Oxford, Oct, 2017-10.
Nuccitelli, D. (2019). Facebook video spreads climate denial misinformation to 5 million users | Dana Nuccitelli. Retrieved from
https://www.theguardian.com/environment/climate-consensus-97-per-cent/2018/jul/25/facebook-video-spreads-climate-denial-misinformation-to-5-million-users
Paton, D. (2013). Disaster Resilient Communities: Developing and testing an all-hazards theory. Journal Of Integrated Disaster Risk Management, 3(1), 1-17. doi: 10.5595/idrim.2013.0050
Schifferes, S., Newman, N., Thurman, N., Corney, D., Göker, A., & Martin, C. (2014). Identifying and Verifying News through Social Media. Digital Journalism, 2(3), 406-418. doi: 10.1080/21670811.2014.892747
Siegrist, M., & Zingg, A. (2014). The Role of Public Trust During
Pandemics. European Psychologist, 19(1), 23-32. doi: 10.1027/1016-9040/a000169
Steelman, T., & McCaffrey, S. (2012). Best practices in risk and crisis
communication: Implications for natural hazards management. Natural Hazards, 65(1), 683-705. doi: 10.1007/s11069-012-0386-z
Tilley, E., & Cokley, J. (2008). Deconstructing the discourse of citizen journalism: Who says what and why it matters. Pacific Journalism Review, 14(1), 94.
Tudoran, A. A. (2019). Why do internet consumers block ads? New evidence from consumer opinion mining and sentiment analysis. Internet Research, 29(1), 144-166. doi: 10.1108/intr-06-2017-0221
van der Linden, S., Leiserowitz, A., Rosenthal, S., & Maibach, E. (2017). Inoculating the Public against Misinformation about Climate Change. Global Challenges, 1(2), 1600008. doi: 10.1002/gch2.201600008
Vendemia, M., Bond, R., & DeAndrea, D. (2019). The strategic presentation of user comments affects how political messages are evaluated on social media sites: Evidence for robust effects across party lines. Computers In Human Behavior, 91, 279-289. doi:
10.1016/j.chb.2018.10.007
Weber, E. U., & Stern, P. C. (2011). Public understanding of climate change in the United States. American Psychologist, 66(4), 315.
Winter, S., & Krämer, N. (2016). Who’s right: The author or the audience? Effects of user comments and ratings on the perception of online science
Appendix
Figure 1.
R
esult
s of G
oog
le T
re
nds for
the te
rm ‘
fa
ke
ne
ws
’ w
orldw
ide
fr
om 2004 unt
il
the pr
ese
Figure 4. Stimuli for the high source expertise condition
[image:37.595.70.526.442.721.2]Figure 6. Stimuli for no advertisement condition
Figure 9. Stimuli for the negative comment sentiment condition
Overview of the questionnaire (presented in truthful sequence), informing about the nature
of the items used, their wording, and the attached action or scale
Type Item Action/ Scale
Consent ‘You are being invited to participate in a research study titled "Assessment of News Items". This study is being done by Lisa Boenke and Dana Lange from the Faculty of Behavioural,
Management and Social Sciences at the University of Twente. The purpose of this research study is to
understand how people read and assess news items in their credibility, concerning the topics
travel vaccines and climate change. It will take you about 10 minutes to complete. The data will be used for statistical analysis about how people process news items in daily life and on social media platforms. Your participation in this study is entirely voluntary and you can withdraw at any time. We believe there are no known risks associated with this research study; however, as with any online related activity the risk of a breach is always possible. To the best of our ability your answers in this study will remain confidential. We will minimise any risks by storing data in an encrypted and safe manner anonymously. Names will be omitted, and no information will be able to be traced back to you. Study contact details for further information: Lisa Boenke,
l.boenke@student.utwente.nl; Dana Lange, d.a.lange@student.utwente.nl. Under the supervision of: Margôt Kuttschreuter,
m.w.m.kuttschreuter@utwente.nl
If you agree to these conditions, please click
continue.’
Demographics ‘What is your age’ Slider with 18-29 years
‘What is your gender?’ Male, Female, Other
‘What is your nationality’ Dutch, German, Other
‘Are you a student?’ Yes/No
Instructions ‘Below, you are presented with a screenshot that shows you a post from the social media platform Rocket. Please read the post and answer the questions given below. You can zoom into the picture if needed.’
Stimuli High Source Expertise (Figure 4)
Instructions ‘Please rate the post by indicating how much you agree or disagree with the statements below’
Perceived
Credibility Scale
‘The post is believable' 7-Point Likert Scale (1 =
‘The post is accurate (correct)’ 7-Point Likert Scale (1 = strongly disagree, 7 = strongly agree)
‘The post is fair (free from bias)’ 7-Point Likert Scale (1 = strongly disagree, 7 = strongly agree)
Instruction ‘For further understanding, indicate how much you agree with the following statements.’
Manipulation Check
‘I think the post is written by an expert in climate change’
Yes/Maybe/No
Additional Analysis
‘I read through the profile description of the author.’
Yes/Maybe/No
Instruction ‘Below, you are presented with a screenshot that shows you a post from the social media platform Rocket. Please read the post and answer the
questions given below. You can zoom into the picture if needed.’
Stimuli Low Source Expertise (Figure 5)
Perceived
Credibility Scale
‘The post is believable' 7-Point Likert Scale (1 =
‘The post is accurate (correct)’ 7-Point Likert Scale (1 = strongly disagree, 7 = strongly agree)
‘The post is fair (free from bias)’ 7-Point Likert Scale (1 = strongly disagree, 7 = strongly agree)
Instruction ‘For further understanding, indicate how much you agree or disagree with the following statements’
Manipulation Check
‘I think the post is written by an expert in climate change’
Yes/Maybe/No
Additional Analysis
‘I read through the profile description of the author’
Yes/Maybe/No
Instruction ‘Below, you are presented with a screenshot that shows you a post from the social media platform
Rocket. Please read the post and answer the questions given below.’
Stimuli Positive comment sentiment (Figure 8)
Instruction ‘Please rate the post by indicating how much you agree or disagree with the statements below.’
Perceived
Credibility Scale
‘The post is believable' 7-Point Likert Scale (1 =
‘The post is accurate (correct)’ 7-Point Likert Scale (1 = strongly disagree, 7 = strongly agree)
‘The post is fair (free from bias)’ 7-Point Likert Scale (1 = strongly disagree, 7 = strongly agree)
Instruction ‘For further understanding, indicate how much you agree or disagree with the following statements.’
Additional Analysis
‘I have read the comments under the post’ Yes/Maybe/No
Additional Analysis
’The comments were trustworthy’ Yes/Maybe/No
Manipulation Check
’The comments were overall positive’ Yes/Maybe/No
Additional Analysis
’The author of the post is believable’ Yes/Maybe/No
Instruction ’Below, you are presented with a screenshot that shows you a post from the social media platform Rocket. Please read the post and answer the questions given below.’
Stimuli Negative comment sentiment (Figure 9)
Perceived
Credibility Scale
’The post is believable' 7-Point Likert Scale (1 =
strongly disagree, 7 = strongly agree)
’The post is accurate (correct)’ 7-Point Likert Scale (1 = strongly disagree, 7 = strongly agree)
’The post is fair (free from bias)’ 7-Point Likert Scale (1 = strongly disagree, 7 = strongly agree) Instruction ’For further understanding, indicate how much
you agree or disagree with the following statements.’
Additional Analysis
’I have read the comments under the post’ Yes/Maybe/No
Additional Analysis
’The comments were trustworthy’ Yes/Maybe/No
Additional Analysis
’The author of the post is believable’ Yes/Maybe/No
Instruction ’Below, you can see an excerpt from an online newspaper. Please read it and answer the questions below’
Stimuli No Advertisement (Figure 6)
Perceived
Credibility Scale
’The post is believable' 7-Point Likert Scale (1 =
strongly disagree, 7 = strongly agree)
’The post is accurate (correct)’ 7-Point Likert Scale (1 = strongly disagree, 7 = strongly agree)
’The post is fair (free from bias)’ 7-Point Likert Scale (1 = strongly disagree, 7 = strongly agree)
Instruction ’For further understanding, indicate how much you agree or disagree with the following statements.’
Additional Analysis
’I read the text until the end’ Yes/Maybe/No
Additional Analysis
’The newspaper has a professional look’ Yes/Maybe/No
Manipulation Check
’There was advertisement’ Yes/Maybe/No
Instruction ’Please indicate how much you agree or disagree with the following statements.’
Additional Analysis
Additional Analysis
’The advertisements distracted me from the text’ 5-Point Likert Scale (1 = 'Definitely yes', 5 = 'Definitely no')
Instruction ’Below, you can see an excerpt from an online newspaper. Please read it and answer the questions below.’
Stimuli Advertisement (Figure 7)
Instruction ‘Please rate the article by indicating how much you agree or disagree with the statements below.’
Perceived
Credibility Scale
‘The post is believable' 7-Point Likert Scale (1 =
strongly disagree, 7 = strongly agree)
‘The post is accurate (correct)’ 7-Point Likert Scale (1 = strongly disagree, 7 = strongly agree)
‘The post is fair (free from bias)’ 7-Point Likert Scale (1 = strongly disagree, 7 = strongly agree)
Instruction ‘For further understanding, indicate how much you agree or disagree with the following statements.’
Additional Analysis
‘I read the text until the end’ Yes/Maybe/No
Analysis
Manipulation Check
‘There was advertisement’ Yes/Maybe/No
Instruction ‘Please indicate how much you agree or disagree with the following statements.’
Additional Analysis
‘The advertisements were intrusive’ 5-Point Likert Scale (1 = 'Definitely yes', 5 = 'Definitely no')
Additional Analysis
‘The advertisements distracted me from the text’ 5-Point Likert Scale (1 = 'Definitely yes', 5 = 'Definitely no')
Debriefing ‘You have almost reached the end of the survey. This study was aimed at discovering how people assess news items, and especially the context in which news appear. Our focus is on the author of
a source, the medium itself, comments of a post, and surrounding advertisement as factors influencing the credibility of news items.
It is important to stress that in this study, we made use of artificial news and social media posts. All statements contain misinformation, and are wrong to some extent. Additionally, pictures used for the Twitter/Rocket accounts are not associated with the statements portrayed by us. They are fictional characters.
If you have any further questions about the content of the news items, please contact
d.a.lange@utwente.nl or
m.w.m.kuttschreuter@utwente.nl (supervisor)
Retrospectively, data cannot be withdrawn due to the anonymity.’
Consent ‘Manipulations were used in this study. Therefore, we would like to ask again for consent to use your data which will be confidential, anonymous and safely stored.’