RESEARCH ARTICLE
Subspecies differences in thermal acclimation of mitochondrial
function and the role of uncoupling proteins in killifish
Heather J. Bryant*, Dillon J. Chung and Patricia M. Schulte
ABSTRACT
Thermal effects on mitochondrial efficiency and ATP production can influence whole-animal thermal tolerance and performance. Thus, organisms may have the capacity to alter mitochondrial processes through acclimation or adaptation to mitigate these effects. One possible mechanism is through the action of uncoupling proteins (UCPs), which can decrease the proton-motive force independent of the production of ATP. To test this hypothesis, we examined the mRNA expression patterns of UCP isoforms and characterized the effects of thermal acclimation and putative local thermal adaptation on mitochondrial capacity, proton leak and P/O ratios in two subspecies of Atlantic killifish (Fundulus heteroclitus). Ucp1 was the dominant isoform in liver and was more highly expressed in northern killifish. We found that cold acclimation increased mitochondrial capacity (state III and maximum substrate oxidation capacity), state II membrane potential, proton leak and P/O ratios in northern, but not southern, killifish liver mitochondria. Palmitate-induced mitochondrial uncoupling was detected in northern, but not southern, killifish liver mitochondria, consistent with the differences in UcpmRNA expression between the subspecies. Taken together, our data suggest that mitochondrial function is more plastic in response to thermal acclimation in northern killifish than in southern killifish and that UCP1 may play a role in regulating the proton-motive force in northern, but not southern, killifish in response to thermal acclimation. These data demonstrate the potential for adaptive variation in mitochondrial plasticity in response to cold.
KEY WORDS:Fundulus heteroclitus, Temperature, Mitochondria, Fish, UCP, Adaptation
INTRODUCTION
Environmental temperature is an important factor that influences the geographic distribution of ectotherms owing to its effects on biochemical reaction rates which, in turn, affect whole-animal performance (Hochachka and Somero, 2002; Chung and Schulte, 2015; Fangue et al., 2009b; Iftikar and Hickey, 2013; Pörtner, 2001). Because of their key role in providing the majority of the ATP needed for cellular processes, mitochondria are suggested to be an important determinant of these responses of animals to changes in environmental temperature (Iftikar and Hickey, 2013; Pörtner, 2001). Many studies have examined the effects of thermal acclimation or adaptation on mitochondrial respiratory capacity
(e.g. Chung and Schulte, 2015; Chung et al., 2017, 2018; Fangue et al., 2009b; Abele et al., 2002; Dahlhoff and Somero, 1993; Guderley and Johnston, 1996; Strobel et al., 2013; Lannig et al., 2005; Kraffe et al., 2007), but mitochondrial efficiency and proton leak have also been suggested to be crucial parameters influencing organismal responses to temperature (e.g. Salin et al., 2015; Trzcionka et al., 2008).
Measures of non-ADP-phosphorylating (e.g. state IV) respiration rates or respiratory control ratios (RCRs; state III/state IV) are often utilized to estimate mitochondrial leak and efficiency, respectively. A variety of studies in fish suggest that state IV respiration increases with decreasing acclimation temperature, with little or no effect on RCR (dos Santos et al., 2013a; Chung and Schulte, 2015; Chung et al., 2018), representing partial or complete compensation for the effects of low temperature on enzyme activity and the physical state of the inner mitochondrial membrane (IMM) (e.g. Chung and Schulte, 2015; Guderley, 1990). However, other studies have detected increases in RCR with decreases in acclimation temperature (Lannig et al., 2005; van den Thillart and Modderkolk, 1978; Moyes et al., 1988; Guderley and Johnston, 1996). One possible reason for the variety of observed effects of temperature on mitochondrial proton leak and efficiency may be variation among species in the strategies pursued (e.g. cold compensation versus low temperature dormancy). Alternatively, the technical limitations associated with interpreting state IV measurements and coupling ratios as representing measures of mitochondrial proton leak and efficiency, respectively, may make it difficult to reach definitive conclusions based solely on these measures.
A more direct approach to estimate coupling efficiency is to measure the P/O ratio (the amount of ADP consumed per mole of oxygen consumed; Gnaiger et al., 2000). P/O ratios provide a more informative measure of mitochondrial efficiency compared with RCRs as oxygen consumption is not necessarily directly proportional to ATP production because of the role of proton leak (Salin et al., 2015; Brand, 2005). P/O ratios have been shown to either decrease with increasing acclimation temperatures (Lannig et al., 2005) or be unaffected or minimally affected by thermal acclimation (Guderley and Johnston, 1996; Strobel et al., 2013; van den Thillart and Modderkolk, 1978). Similarly, direct assessment of proton leak can also be made by measuring proton leak kinetics, in which membrane potential (ΔΨm) and respiratory rates are measured
under non-ADP-phosphorylating (leak) conditions following a titrated inhibition of the electron transport system (ETS). By comparing the resulting curves, proton leak can be compared at a common membrane potential (Divakaruni and Brand, 2011), which ensures that leak is measured at the same level of proton-motive force (PMF). Few studies have examined changes in mitochondrial proton leak kinetics with thermal acclimation. However, the available studies have found that proton leak decreases with cold acclimation (Jastroch et al., 2007; Trzcionka et al., 2008). Received 8 June 2018; Accepted 18 October 2018
Department of Zoology, University of British Columbia, 6270 University Blvd., Vancouver, British Columbia, Canada V6T 1Z4.
*Author for correspondence ([email protected])
H.J.B., 0002-8553-7792; D.J.C., 0002-0329-3828; P.M.S., 0000-0002-5237-8836
Journal
of
Experimental
Mitochondrial proton leak contributes to approximately 20% of standard metabolic rate in both endothermic and ectothermic vertebrates (Brand et al., 1991, 1994; Porter and Brand, 1993; Rolfe et al., 1999; Bishop and Brand, 2000). Although the mechanisms of this leak are not fully understood, it is thought to occur through a variety of pathways including protons moving directly across the membrane (although this contribution is small) or through proteins such as the adenine nucleotide translocase (ANT) and uncoupling proteins (UCPs) (Jastroch et al., 2010; Divakaruni and Brand, 2011). There is some evidence that UCPs may be differentially regulated in response to thermal acclimation in ectotherms and thus play a role in the modulation of mitochondrial function with temperature (Jastroch et al., 2005, 2007; Murakami et al., 2015; Wen et al., 2015; Tseng et al., 2011; dos Santos et al., 2013b; Mark et al., 2006). The function of UCPs is best understood in mammalian brown adipose tissue (BAT), where UCP1 acts to decrease the PMF, resulting in futile energy cycling and thermogenesis (Nicholls, 2001). But there are other isoforms of UCPs, including other members of the core UCP family (UCP2 and UCP3) and more distantly related UCPs (UCP4 and UCP5) (Esteves and Brand, 2005; Rousset et al., 2004). These isoforms have been proposed to play a role in attenuating reactive oxygen species (ROS) production, transporting fatty acids, and perhaps ROS signaling and insulin secretion (for a review, see Brand and Esteves, 2005). UCP isoforms have been identified in a variety of species and taxa, including plants and ectothermic organisms, but the functional roles of UCPs in non-endothermic taxa are still unclear (Woyda-Ploszczyca and Jarmuszkiewicz, 2017).
Here, we used Atlantic killifish,Fundulus heteroclitus(Linnaeus 1766), to investigate the influence of thermal acclimation and putative local adaptation on mitochondrialΔΨm, proton leak and P/
O ratios. We also explored the role of changes in UCPs in these processes by examiningUcpmRNA expression and the effects of palmitate, a known activator of mammalian UCP, on proton leak. Atlantic killifish are extremely eurythermal, and northern and southern populations of this species experience different local thermal conditions (Schulte, 2007). For example, mean monthly temperatures in Georgia, USA, exceed 25°C from June through September, and frequently reach this level in May, whereas temperatures seldom reach this level even in midsummer in
New Hampshire, USA (NOAA, National Estuarine Research Reserve System 2013–2017 station codes GRBLR and SAPLD; http://www.nerrsdata.org/). In contrast, in the winter, New Hampshire marshes are ice covered, whereas mean monthly winter temperatures in Georgia remain above 10°C. Consistent with these differences in environmental temperatures, northern and southern killifish have been shown to exhibit intraspecific variation in their thermal preferences, thermal tolerances and responses to thermal acclimation, suggestive of local adaptation (Chung and Schulte, 2015; Chung et al., 2017; Fangue et al., 2006, 2009a,b; Healy and Schulte, 2012; Healy et al., 2017; McBryan et al., 2016). The mitochondrial properties of F. heteroclitus have been previously shown to respond to thermal acclimation and differ between the northern and southern subspecies (Chung et al., 2017, 2018; Fangue et al., 2009b), making this an ideal model in which to investigate the role of changes in proton leak in thermal acclimation and adaptation. Northern killifish have been shown to have a greater liver mitochondrial maximal O2 consumption rate than southern
killifish following cold acclimation, and this increase in capacity in the northern subspecies following cold acclimation may be consistent with cold compensation of mitochondrial function (Chung and Schulte, 2015; Fangue et al., 2009b). Furthermore, ROS production in northern killifish has been shown to be influenced by acute changes in temperature, but not thermal acclimation (Chung and Schulte, 2015), suggesting that killifish may have mechanisms, such as UCPs, that respond to thermal acclimation in order to mitigate changes in the PMF and ROS production.
We hypothesized that adjustments toΔΨmand proton leak are
involved in thermal adaptation and acclimation and therefore predicted that Ucp mRNA expression and fatty-acid-induced uncoupling would differ between subspecies and in response to thermal acclimation. The specific objectives of this study were to: (1) characterize the mRNA expression patterns of Ucp isoforms across tissues and determine how these patterns differ between subspecies following acclimation to high and low temperatures; (2) determine the effects of both warm and cold acclimation on mitochondrial respiratory capacity, P/O ratios,ΔΨmand
fatty-acid-induced uncoupling in killifish liver mitochondria; and (3) determine whether changes inUcpmRNA expression in the liver correspond to changes in fatty-acid-induced uncoupling. This work demonstrates thatΔΨm and proton leak are altered in response to
thermal acclimation and these responses differ between subspecies that are putatively adapted to different thermal environments, and supports a role for UCPs as a potential mechanism for mitigating thermally induced changes to the PMF.
MATERIALS AND METHODS Identification ofUcpisoforms
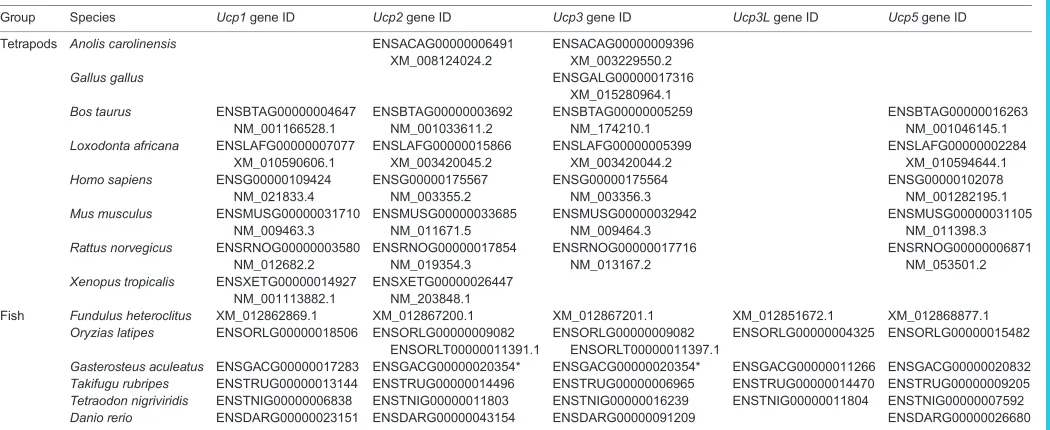
Nucleotide BLAST was used to identify gene sequences in the F. heteroclitus genome (Fundulus_heteroclitus-3.0.2, GCF_000826765.1, annotation release 101) that share significant sequence similarity withUcp1,Ucp2,Ucp3,Ucp3LandUcp5as characterized in other tetrapod and fish species (no sequence similar toUcp4was detected). Gene sequences for theUcpisoforms from an additional five fish species and eight tetrapod species were also gathered from the NCBI and Ensembl databases (see Table 1 for accession numbers). MUSCLE alignment (Edgar, 2004) and phylogenetic analysis were performed using MEGA (v. 6.06, https://www.megasoftware.net/) to identify which of the F. heteroclitus Ucpisoforms were homologous with each of theUcp family members identified in other species. A maximum likelihood (ML) tree (substitution type: nucleotide; model/method: Tamura– List of symbols and abbreviations
ADP adenosine diphosphate ANT adenine nucleotide translocase ATP adenosine triphosphate BAT brown adipose tissue BSA bovine serum albumin Cat carboxyatractyloside
Cq mean cycle number ETS electron transport system
FCCP carbonyl cyanidep-(trifluoromethoxy)phenyl-hydrazone FDR false discovery rate
GDP guanosine-5′-diphosphate GTP guanosine-5′-triphosphate IMM inner mitochondrial membrane PMF proton-motive force
P/O ratio of moles of ADP consumed per mole of oxygen RCR respiratory control ratio
ROS reactive oxygen species TPP+ tetraphenylphosphonium ion UCP uncoupling protein ΔΨm membrane potential
Journal
of
Experimental
Nei model; rates among sites: uniform rates; gaps/missing data treatment: complete deletion; all codon positions selected; ML heuristic method: nearest-neighbor interchange) was constructed, and the reliability of the tree was confirmed by bootstrapping with 1500 replicates.
As an additional method to confirm the identification of homologous relationships, the genes adjacent to the variousUcp isoforms were identified in multiple species using Genomicus (v. 89.02, http://www.genomicus.biologie.ens.fr/genomicus-89.02) with all Ensembl vertebrate genomes. The genes surrounding each Ucpwere also identified in the F. heteroclitusgenome, and these gene lists were compared with those identified in other species using Genomicus to confirm syntenic relationships.
Animals and temperature acclimations for mRNA expression All procedures and animal care were performed in accordance with the Canadian Council on Animal Care (CCAC) approved animal use protocol A11-0732. For mRNA expression data, adult southern killifish (Fundulus heteroclitus heteroclitus) were collected from Jekyll Island, GA, USA (31°02′N, 81°25′W; 69% male), and adult northern killifish (Fundulus heteroclitus macrolepidotus) were wild-caught by Aquatic Research Organisms (Hampton, NH, USA) from Taylor River, NH, USA (42°55′N, 70°51′W; 31% male), in the summer of 2014 and brought to holding facilities at The University of British Columbia in Vancouver, British Columbia, Canada. Based on their sizes, all animals were approximately 3–4 years of age (Kneib and Stiven, 1978). AllF. heteroclituswere then held under common conditions of 15°C (a temperature experienced by both populations in the wild; Schulte, 2007), 20 ppt salinity and a 12 h:12 h light:dark photoperiod in 190 liter recirculating fiberglass tanks with biological filtration. All fish were fed daily to satiation throughout holding and acclimations with Nutrafin Max®flake food (Hagen, Inc., Baie d’Urfé, QC, Canada).
After at least 4 weeks under these conditions, fish were transferred to experimental tanks at a density of approximately 1 fish per 6 liters. Different subspecies remained in separate tanks. Fish were then held in the experimental tanks under the conditions described above for at least 3 weeks before temperature acclimations began.
Temperature acclimations occurred at four different temperatures (5, 15, 25 and 33°C) with one tank for each subspecies acclimated to each temperature. These acclimation temperatures were chosen such that southern fish would be exposed to low temperatures that they would rarely experience in nature, and northern fish would be exposed to high temperatures that they would rarely experience in nature. For example, water temperature data from the coast of New Hampshire (station GRBLR, NOAA, NERRS January 2013–December 2017) recorded an average of only 25.6 days per year at 25°C or above, and mean monthly temperatures seldom reach this level. In contrast, data from the coast of Georgia (station SAPLD, NOAA, NERRS 2013–2017) indicate that fish experience an average of 143 days per year at 25°C or above, with mean monthly temperatures at this level or above throughout the summer. Note that even in Georgia, mean monthly temperatures never reach 33°C, only approaching this temperature on individual days. Similarly, at the low end of the temperature range, water data from the coast of Georgia only include four days at or below 5°C since 2013 (station SAPLD, NOAA, NERRS January 2013–June 2018), whereas water temperatures off the coast of New Hampshire are not measured from mid-December to mid-April, because the loggers are removed owing to the presence of ice (station GRBLR, NOAA, NERRS January 2013–June 2018). Tanks were brought to acclimation temperatures at a rate of change of approximately 2–3°C h–1 and were then held at that temperature for 3 weeks.
Following the acclimation period, fish were fasted for 24 h and then euthanized via cervical dislocation, and then sex, mass and length were assessed. Whole-animal data are presented in Fig. S1. Whole brain, whole gill basket, liver and a lateral skeletal muscle sample ventral to the dorsal fin were dissected and flash-frozen in liquid nitrogen. The whole process from the fish being removed to all tissues being flash-frozen took less than 5 min.
RNA isolations and cDNA synthesis
[image:3.612.48.573.71.286.2]Tissues were homogenized in TRIzol® Reagent using a Bullet Blender™ 24 (Next Advance, Inc., Averill Park, NY, USA) and isolated following the manufacturer’s instructions (Life Technologies, Grand Island, NY, USA). Isolated RNA was then
Table 1. Accession numbers for gene sequences used in phylogenetic analyses
Group Species Ucp1gene ID Ucp2gene ID Ucp3gene ID Ucp3Lgene ID Ucp5gene ID
Tetrapods Anolis carolinensis ENSACAG00000006491 XM_008124024.2
ENSACAG00000009396 XM_003229550.2
Gallus gallus ENSGALG00000017316
XM_015280964.1 Bos taurus ENSBTAG00000004647
NM_001166528.1
ENSBTAG00000003692 NM_001033611.2
ENSBTAG00000005259 NM_174210.1
ENSBTAG00000016263 NM_001046145.1 Loxodonta africana ENSLAFG00000007077
XM_010590606.1
ENSLAFG00000015866 XM_003420045.2
ENSLAFG00000005399 XM_003420044.2
ENSLAFG00000002284 XM_010594644.1 Homo sapiens ENSG00000109424
NM_021833.4
ENSG00000175567 NM_003355.2
ENSG00000175564 NM_003356.3
ENSG00000102078 NM_001282195.1 Mus musculus ENSMUSG00000031710
NM_009463.3
ENSMUSG00000033685 NM_011671.5
ENSMUSG00000032942 NM_009464.3
ENSMUSG00000031105 NM_011398.3 Rattus norvegicus ENSRNOG00000003580
NM_012682.2
ENSRNOG00000017854 NM_019354.3
ENSRNOG00000017716 NM_013167.2
ENSRNOG00000006871 NM_053501.2 Xenopus tropicalis ENSXETG00000014927
NM_001113882.1
ENSXETG00000026447 NM_203848.1
Fish Fundulus heteroclitus XM_012862869.1 XM_012867200.1 XM_012867201.1 XM_012851672.1 XM_012868877.1 Oryzias latipes ENSORLG00000018506 ENSORLG00000009082
ENSORLT00000011391.1
ENSORLG00000009082 ENSORLT00000011397.1
ENSORLG00000004325 ENSORLG00000015482
Gasterosteus aculeatus ENSGACG00000017283 ENSGACG00000020354* ENSGACG00000020354* ENSGACG00000011266 ENSGACG00000020832 Takifugu rubripes ENSTRUG00000013144 ENSTRUG00000014496 ENSTRUG00000006965 ENSTRUG00000014470 ENSTRUG00000009205 Tetraodon nigriviridis ENSTNIG00000006838 ENSTNIG00000011803 ENSTNIG00000016239 ENSTNIG00000011804 ENSTNIG00000007592 Danio rerio ENSDARG00000023151 ENSDARG00000043154 ENSDARG00000091209 ENSDARG00000026680
*Ucp2andUcp3in theG. aculeatusgenome are labeled as the same gene and transcript.Ucp2andUcp3are known to be adjacent to each other in animal genomes (Tine et al., 2012). However, phylogenetic analysis indicates they are separateUcp2andUcp3genes.
Journal
of
Experimental
checked for genomic contamination by running qRT-PCRs with 16 randomly selected non-reverse transcribed samples per tissue using the primers for the most highly expressed isoform in each respective tissue. If genomic contamination was present at a ratio greater than 1:16,000, RNA was put through a Qiagen on-column RNA clean-up using a Qiagen RNeasy Mini Kit and Qiagen RNase-free DNase. A total of 2 µg of RNA for liver and gill tissue and 1 µg of RNA for brain and muscle tissue was reverse transcribed into cDNA in a total volume of 20 µl using a High-Capacity cDNA Reverse Transcription Kit with random hexamers according to the manufacturer’s instructions (Life Technologies). cDNA for each tissue was diluted 5-fold and a five-point standard curve was made for each tissue from pooling all samples per tissue. For 18S rRNA expression, cDNA was diluted 300-fold.
Quantitative real-time PCR (qRT-PCR)
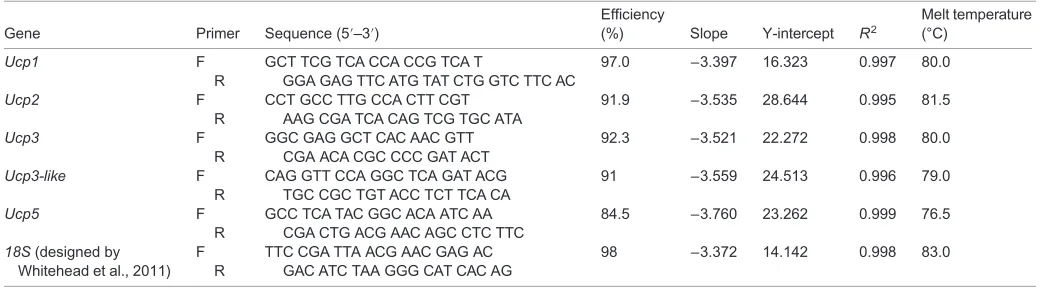
qRT-PCR was performed on Bio-Rad CFX96 Touch™Real-Time PCR Detection System (Bio-Rad Laboratories, Inc., Mississauga, ON, Canada). The qRT-PCR reaction protocol was as follows: 10 min at 95°C, and then 40 cycles of: 15 s at 95°C, 1 min at 60°C. A melt curve analysis from 65 to 95°C at an increment of 0.5°C was then conducted to ensure the presence of only one amplicon. Reactions of 20 µl total volume contained 5 µl of diluted cDNA, 0.4 µl of each primer, 10 µl of SYBR green master mix and 4.2 µl water. See Table 2 for qRT-PCR primer sequences. Primer pairs were designed using Primer Express (v. 3.0; ThermoFisher Scientific) in regions that were different between isoforms, but the same between any transcript variants. Specificity was confirmed via BLAST against theF. heteroclitusgenome in GenBank. Thresholds across primer pairs within a tissue were set to the same value and gene expression levels were calculated as per Eqn 1:
exp:¼ ð10ð1=slopeÞÞCq: ð1Þ The slope was calculated from the standard curve, and Cq
represents the mean cycle number for each sample (run in duplicate, σ<20%). No-template controls showed no signal across all plates, and other plate quality control parameters can be found in Table 2. All absolute gene expression values are normalized to 18S rRNA expression, calculated as described above.
Animals and temperature acclimations for isolated mitochondria
All procedures and animal care were performed in accordance with the Canadian Council on Animal Care approved animal use protocol A16-0028. Adult northern Atlantic killifish (F. h. macrolepidotus, 56% male) were wild-caught by Aquatic Research Organisms from
Taylor River, NH, USA (42°55′N, 70°51′W), and adult southern Atlantic killifish (F. h. heteroclitus, 44% male) were wild-caught from Jekyll Island, GA, USA (31°02′N, 81°25′W) in the autumn of 2016. Fish were then brought back to and housed at The University of British Columbia in 114 liter glass tanks at 15°C, 20 ppt salinity and a 12 h:12 h light:dark photoperiod for at least 4 months prior to acclimation. Fish were fed once daily to satiation with Nutrafin Max® flake food. Following this holding period, fish were
acclimated in the same tanks to 5, 15 or 25°C with no other change in water parameters or photoperiod. These temperatures were chosen for the reasons described above, but the 33°C acclimation was omitted because this is not environmentally relevant for either population. Tanks were brought to the acclimation temperatures at a rate of change of approximately 2–3°C h−1and then held at the acclimation temperature for 3 weeks
prior to sampling.
Mitochondrial isolations
Chemicals for mitochondrial isolations were obtained from Sigma-Aldrich (St Louis, MO, USA) with the exception of bovine serum albumin (BSA), which was obtained from Akron Biotech (Boca Raton, FL, USA). Livers from seven fish were pooled for each mitochondrial sample. Prior to euthanasia, fish sex, mass and length were recorded (Fig. S2). Fish were then euthanized via rapid cervical dislocation and liver tissue was taken. Livers were weighed and then placed in ice-cold homogenization buffer (250 mmol l−1 sucrose, 50 mmol l−1
KCl, 0.5 mmol l−1 EGTA, 25 mmol l−1 KH
2PO4, 10 mmol l−1
Hepes, 1.5% w/v BSA, pH 7.4 at 20°C). Liver tissue was minced in the ice-cold homogenization buffer until pieces were approximately 1 mm3 in size and then homogenized using
seven passes of a loose-fitting Teflon pestle. This crude homogenate was filtered through one-ply cheesecloth and centrifuged at 600g for 10 min at 4°C. The fat layer was aspirated from the supernatant and the supernatant was filtered through four-ply cheesecloth. The defatted supernatant was centrifuged at 6000g for 10 min at 4°C and the resulting pellet was washed two times with fresh ice-cold homogenization buffer at 6000g for 10 min at 4°C. Any remaining homogenization buffer was aspirated from the pellet and the pellet was suspended in 300 µl BSA-free ice-cold homogenization buffer. Liver mitochondria suspensions were kept on ice until respiration and ΔΨm measurements were completed, which was within 6 h of
[image:4.612.46.568.592.737.2]mitochondrial isolation. Protein concentrations in each sample were determined prior to measurements using a Bradford (1976) assay with BSA standards.
Table 2. Primer pairs and plate parameters for qRT-PCR
Gene Primer Sequence (5′–3′)
Efficiency
(%) Slope Y-intercept R2
Melt temperature (°C)
Ucp1 F
R
GCT TCG TCA CCA CCG TCA T
GGA GAG TTC ATG TAT CTG GTC TTC AC
97.0 −3.397 16.323 0.997 80.0
Ucp2 F
R
CCT GCC TTG CCA CTT CGT AAG CGA TCA CAG TCG TGC ATA
91.9 −3.535 28.644 0.995 81.5
Ucp3 F
R
GGC GAG GCT CAC AAC GTT CGA ACA CGC CCC GAT ACT
92.3 −3.521 22.272 0.998 80.0
Ucp3-like F R
CAG GTT CCA GGC TCA GAT ACG TGC CGC TGT ACC TCT TCA CA
91 −3.559 24.513 0.996 79.0
Ucp5 F
R
GCC TCA TAC GGC ACA ATC AA CGA CTG ACG AAC AGC CTC TTC
84.5 −3.760 23.262 0.999 76.5
18S(designed by Whitehead et al., 2011)
F R
TTC CGA TTA ACG AAC GAG AC GAC ATC TAA GGG CAT CAC AG
98 −3.372 14.142 0.998 83.0
Journal
of
Experimental
Mitochondrial respiration and membrane potential measurements
Chemicals for mitochondrial respiration and membrane potential measurements were obtained from Sigma-Aldrich except for carboxyatractyloside (Cat), which was obtained from EMD Millipore (Etobicoke, ON, Canada). All mitochondrial respiration and mitochondrial ΔΨm measurements were determined via
high-resolution respirometry using an Oxygraph O2k system and tetraphenylphosphonium (TPP+)-selective electrodes (Oroboros
Instruments, Innsbruck, Austria) at an assay temperature of 15°C. O2electrodes were calibrated with air-saturated and O2-depleted assay
buffer (MiRO5, 110 mmol l−1 sucrose, 0.5 mmol l−1 EGTA,
3 mmol l−1MgCl
2, 60 mmol l−1K-lactobionate, 20 mmol l−1taurine,
10 mmol l−1KH
2PO4, 20 mmol l−1Hepes, 0.1% w/v BSA, pH 7.1 at
30°C; Gnaiger and Kuznetsov, 2002) and were calibrated for background O2consumption at 15°C using published O2solubilities
(Forstner and Gnaiger, 1983). All values measured by TPP+-selective
electrodes were corrected for chemical background and dilution effects. ΔΨmwas calculated as described in Chung and Schulte (2015).
Liver mitochondrial protein (0.1–0.2 mg) was loaded into 2 ml MiRO5 followed by rotenone (0.5 µmol l−1dissolved in ethanol) to
inhibit complex I and succinate (10 mmol l−1, complex II substrate)
to measure state II respiration, and then ADP (125 µmol l−1) was
added to measure state III respiration. The ADP was then allowed to be completely consumed to determine the P/O ratio. P/O ratios were calculated according to Gnaiger et al. (2000). Saturating ADP (1.25 mmol l−1) was then added to reinitiate state III respiration
and then oligomycin (2.5 µmol l−1 dissolved in ethanol) was
added to induce state IV respiration. Finally, carbonyl cyanide p-(trifluoromethoxy) phenyl-hydrazone (FCCP; 1 µmol l−1
dissolved in ethanol) was added to achieve maximum electron transport flux by completely uncoupling the mitochondria. Only complex II respiration rates were measured in order to be consistent with the measurement of proton leak kinetics, where malonate is used to titrate inhibition through complex II (Affourtit et al., 2018). Furthermore, complex-I-mediated respiration rates have previously been measured in both northern and southern F. heteroclitus (Chung et al., 2017, 2018).
At the beginning of each proton leak kinetic curve assay, rotenone (0.5 µmol l−1 dissolved in ethanol), oligomycin (2.5 µmol l−1
dissolved in ethanol) and Cat (5 µmol l−1) were added to the
chamber containing 2 ml MiRO5. Nigericin was not included because it has an inhibitory effect on killifish liver mitochondrial respiration (Chung and Schulte, 2015). Cat was included to inhibit the activity of the ANT to specifically assess the potential role of UCPs in proton conductance. Preliminary data indicated the addition of the same volume of 50% ethanol did not influence ΔΨmor respiration rates. TPP+-selective electrodes were introduced
and calibrated through five additions of TPP+ (one 1 µmol l−1
addition followed by four 0.5 µmol l−1 additions for a total of
3 µmol l−1 TPP+). Liver mitochondrial protein (0.7–0.8 mg) was
then added, followed by succinate (10 mmol l−1) to achieve state II
respiration. State II respiration was then titrated using nine additions of malonate (0.5 mmol l−1each, for a total of 4.5 mmol l−1) and
then mitochondria were uncoupled through the addition of FCCP (1 µmol l−1 dissolved in ethanol). Each proton leak kinetic curve
was fit to a combined model equation (Eqn 2):
fðxÞ ¼axþbexpðcxÞ; ð2Þ where x is membrane potential (mV), using GraphPad Prism 7 software (La Jolla, CA, USA). This combined model accounts for
both the ohmic (linear) and non-ohmic (exponential) behavior that has been previously described for mitochondrial proton leak kinetics (Jastroch et al., 2012; Murphy, 1989; Nicholls, 1977).
A separate set of assays was performed with the inclusion of palmitate to stimulate UCP activity. For these treatments only, sodium palmitate (35 µmol l−1dissolved in 50% ethanol) was added
at the beginning of each run. This results in approximately 11.8 nmol l−1 free palmitate in the respiration medium (Richieri
et al., 1993). Guanosine-5′-triphosphate (GTP) and guanosine-5′ -diphosphate (GDP; known inhibitors of mammalian UCP1) were also tested at multiple concentrations (see Results for details).
Statistical analysis
All statistical analyses were conducted in R (v3.3.2; https://www. r-project.org/). All data are presented as means±s.e.m. andαwas set to 0.05. Assumptions of normality of residuals and homogeneity of variances were assessed using a Shapiro–Wilk test and a Bartlett test, respectively. Data were log transformed where necessary to meet parametric assumptions. For tissue-specific expression ofUcp isoform mRNAs, one-way ANOVAs followed by Tukey honest significant difference tests were used where parametric assumptions were met. Where parametric assumptions were not met, we utilized Kruskal–Wallis rank sum tests followed by Mann–Whitney U/Wilcoxon rank sum tests. For assessing changes in gene expression and mitochondrial respiration measurements across acclimation temperatures and between subspecies comparisons, we utilized two-way ANOVAs. Where parametric assumptions were met, post hoc analyses were performed using planned comparison t-tests followed by false discovery rate (FDR) correction. In cases where parametric assumptions were not met, post hocanalyses were completed via pair-wise comparisons using a Mann–WhitneyU/Wilcoxon rank sum test with FDR-corrected P-values. All mRNA expression values in figures have been multiplied by a factor of 105for ease of visual presentation. RCRs
were calculated as state III/state IV (Chance and Williams, 1955; Gnaiger, 2014). Identifying acclimation and subspecies effects on proton leak kinetic was achieved by comparing leak respiration at the highest commonΔΨm(150.6 mV) among proton leak kinetic
curves. Comparisons of the effect of thermal acclimation on the palmitate response were achieved usingt-tests comparing oxygen consumption rate under control and palmitate-treated conditions at the ΔΨm where the largest difference between the control and
palmitate curves was present (northern: 5°C at 164 mV, 15°C at 165 mV and 25°C at 158 mV; southern: 5°C at 151 mV, 15°C at 142 mV and 25°C at 145 mV).
RESULTS
Phylogenetic and syntenic analyses
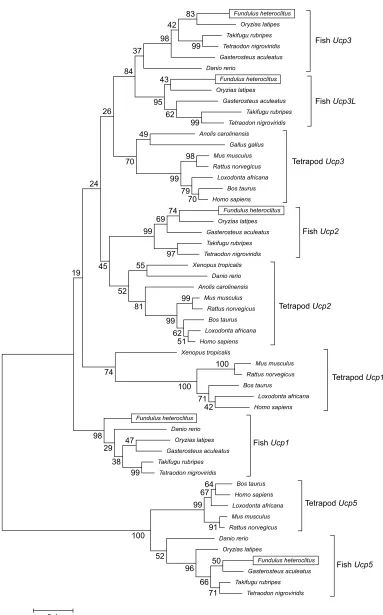
We identified five UCP homologues in F. heteroclitus using phylogenetic analysis (Fig. 1). The sequences for the different isoforms from fish were generally more similar to the same isoform from tetrapods than they were to the other fish isoforms. Therefore, the F. heteroclitus isoforms were given the name of their mammalian counterpart where possible. Syntenic analysis confirmed this naming, as the adjacent genes were generally conserved between fish and tetrapods. In the case of the apparent fish-specificUcp3L, the isoform was named based on the naming convention in other fish species, and syntenic analysis also confirmed orthology within the fishes. We did not detect an isoform homologous to mammalian Ucp4 in the F. heteroclitus genome. Note that the annotation ofUcpisoforms in the published fish genomes is poor. For example, some Ucp isoforms in fish
Journal
of
Experimental
Fundulus heteroclitus
Oryzias latipes
Fish Ucp3
Fish Ucp3L
Fish Ucp2
Fish Ucp5
Fish Ucp1
Tetrapod Ucp3
Tetrapod Ucp2
Tetrapod Ucp1
Tetrapod Ucp5 Takifugu rubripes
Tetraodon nigroviridis
Gasterosteus aculeatus
Danio rerio
Fundulus heteroclitus
Oryzias latipes
Gasterosteus aculeatus
Takifugu rubripes
Tetraodon nigroviridis
Anolis carolinensis
Gallus gallus
Mus musculus
Rattus norvegicus
Loxodonta africana
Bos taurus
Homo sapiens
Fundulus heteroclitus
Oryzias latipes
Gasterosteus aculeatus
Takifugu rubripes
Tetraodon nigroviridis
Xenopus tropicalis
Danio rerio
Anolis carolinensis
Mus musculus
Rattus norvegicus
Bos taurus
Loxodonta africana
Homo sapiens
Xenopus tropicalis
Mus musculus
Rattus norvegicus
Bos taurus
Loxodonta africana
Homo sapiens
Fundulus heteroclitus
Danio rerio
Oryzias latipes
Gasterosteus aculeatus
Takifugu rubripes
Tetraodon nigroviridis
Bos taurus
Homo sapiens
Loxodonta africana
Mus musculus
Rattus norvegicus
Danio rerio
Oryzias latipes
Fundulus heteroclitus
Gasterosteus aculeatus
Takifugu rubripes
Tetraodon nigroviridis 91
64 67
99
71 66
50 96 52 100
100
42 71 100
98
79 70
99
51
99
99
62 99
99
97 99
47
38 98
69 74
29
99
83
43
62 95
42
98
81 55
74 52
49
70
45
37
84
19 26
24
[image:6.612.113.496.68.683.2]0.1
Fig. 1. Phylogenetic relationships among selected teleost and tetrapodUcpgene sequences.This tree was constructed using maximum likelihood analysis of nucleotide sequences, rooted to theUcp5gene sequences. Bootstrap values (from 1500 replicates) are shown at the nodes. Gene IDs for all sequences are listed in Table 1.
Journal
of
Experimental
genomes (both in Ensembl and GenBank) were labeled similarly to each other or as unknown proteins. In these cases, the genes were given the names of their mammalian counterparts based on the phylogenetic and syntenic relationships identified here.
Tissue-specific mRNA expression
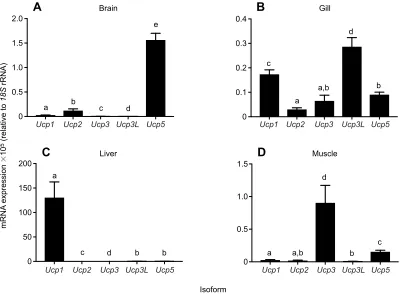
The expression profiles of the fiveUcpisoforms investigated here differed among tissues. In brain, there was high expression ofUcp5 mRNA relative to the other isoforms (Pisoform<0.001; Fig. 2A).
In gill tissue, the fish-specific isoformUcp3Lwas the most highly expressed, with Ucp1 and Ucp5 mRNAs being expressed at an intermediate level (Pisoform<0.001; Fig. 2B). In liver tissue,Ucp1
was the most highly expressed isoform (Pisoform<0.001; Fig. 2C).
In muscle, Ucp3 was the most highly expressed isoform (Pisoform<0.001; Fig. 2D).
Thermal acclimation and subspecies effects onUcpisoform mRNA expression
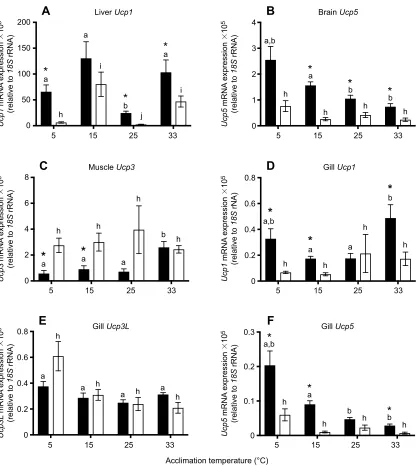
The expression ofUcp1, the most highly expressedUcpisoform in F. heteroclitusliver tissue, was significantly affected by acclimation (Pacclimation<0.001; Fig. 3A) such that expression was lowest
following acclimation to 25°C in both subspecies. Ucp1 mRNA expression in the liver was higher in the northern subspecies than in the southern subspecies (Psubspecies<0.001; Fig. 3A). There was
an interaction between acclimation temperature and subspecies such that Ucp1 decreased in mRNA expression following acclimation to 5°C in southern killifish, but not northern killifish, and the subspecies differed inUcp1mRNA expression following acclimation to all temperatures except 15°C (Pacclimation×subspecies<0.001; Fig. 3A).
Similar toUcp1in the liver,Ucp5in the brain (Psubspecies<0.001;
Fig. 3B) and Ucp1 (Psubspecies<0.001; Fig. 3D) and Ucp5
(Psubspecies<0.001; Fig. 3F) in the gill were expressed at higher
levels in northern killifish than in southern killifish. Contrastingly, Ucp3L in gill tissue showed no difference between subspecies (Psubspecies=0.494; Fig. 3E) andUcp3in muscle tissue was generally
expressed more highly in southern killifish than in northern killifish (Psubspecies<0.001; Fig. 3C).
The most highly expressed isoforms in each tissue displayed different patterns of expression with thermal acclimation. Ucp5 in both brain (Pacclimation<0.001; Fig. 3B) and gill tissue
(Pacclimation<0.001, Pacclimation×subspecies=0.265; Fig. 3F) showed an
increase in expression with decreasing acclimation temperature, although this was not seen in southern killifish brain tissue (Pacclimation×subspecies=0.015; Fig. 3B). Similarly, Ucp3L
mRNA expression was higher following cold acclimation in the northern, but not southern, subspecies (Pacclimation=0.001, Pacclimation×subspecies=0.039; Fig. 3E). In gill tissue, Ucp1 mRNA
expression increased with acclimation to extreme temperatures (5 and 33°C) (Pacclimation=0.014,Pacclimation×subspecies=0.704; Fig. 3D).Ucp3
in muscle tissue was affected by acclimation temperature (Pacclimation=0.005; Fig. 3C), but this effect was only detected in
northern killifish (Pacclimation×subspecies=0.013), which showed an
increase inUcp3mRNA expression following acclimation to 33°C.
Mitochondrial respiration
Liver mitochondrial state III respiration was greatest in 5°C-acclimated northern killifish when compared with 15°C-and 25°C-acclimated fish, 15°C-and no thermal acclimation effects were observed in southern killifish (Pacclimation=0.025, Ucp1 Ucp2 Ucp3 Ucp3L Ucp5
0 0.5 1.0 1.5 2.0
a b c d
A
e Brain
0 50 100 150 200
mRNA
expression
⫻
10
5 (relative to
18S
rRNA)
a
b b c
C
d Liver
Ucp1 Ucp2 Ucp3 Ucp3L Ucp5 0
0.1 0.2 0.3 0.4
c
a a,b
d
b
B
Gill0 0.5 1.0 1.5
Isoform
a a,b
d
b
D
c Muscle
[image:7.612.111.514.58.352.2]Ucp1 Ucp2 Ucp3 Ucp3L Ucp5 Ucp1 Ucp2 Ucp3 Ucp3L Ucp5
Fig. 2. mRNA expression ofUcpisoforms in tissue from northernFundulus heteroclitusacclimated to 15°C.(A) Brain, (B) gill, (C) liver and
(D) muscle. Data are means±s.e.m. expressed relative to18SrRNA and multiplied by 105for clarity (n=9 for all groups). Different letters indicate a significant difference among isoforms within a tissue using Mann–WhitneyUrank sum tests for A, B and D and a Tukey honest significant difference test for C.
Journal
of
Experimental
Pacclimation×subspecies=0.012; Fig. 4A). Although there was no main
effect of subspecies on state III respiration (Psubspecies=0.055), we
detected greater mitochondrial respiration in northernF. heteroclitus following low temperature acclimation when compared with southern fish inpost hocanalyses.
State IV (oligomycin) respiration in the liver did not differ significantly between northern and southern killifish, or with thermal acclimation (Pacclimation=0.147,Psubspecies=0.067; Fig. 4B).
However, there was a significant interaction between these factors (Pacclimation×subspecies=0.032) driven by a trend for state IV
respiration to decrease with warm acclimation in northern killifish, but not southern, killifish, and for state IV respiration to decrease with cold acclimation in southern, but not northern, killifish (Fig. 4B).
RCRs in liver mitochondria, an estimate of mitochondrial coupling, were above 6 for both subspecies across acclimation temperatures, and were highest in northern killifish following acclimation to 5°C (Pacclimation=0.011,Psubspecies=0.327,Pacclimation×subspecies=0.258;
Fig. 4C).
FCCP-stimulated O2 consumption rate differed between
subspecies and with acclimation temperature, such that there was a large increase in FCCP-stimulated O2consumption rate in liver
mitochondria from northern killifish, but not southern killifish, following acclimation to 5°C (Pacclimation=0.006,Psubspecies=0.040, Pacclimation×subspecies<0.001; Fig. 4D).
P/O ratios differed between subspecies and with thermal acclimation (Pacclimation<0.001,Psubspecies=0.015; Fig. 5), although
there was also a significant interaction between these two factors
5 15 25 33
0 50 100 150 200
Ucp1
mRNA
expression
⫻
10
5
(relative to
18S
rRNA)
a
*
a*
ai
i
*
b
h j
A
Liver Ucp15 15 25 33
0 2 4 6 8
Ucp3
mRNA
expression
⫻
10
5
(relative to
18S
rRNA)
*
a*
a a
b
h h
h
h
C
Muscle Ucp35 15 25 33
0 0.2 0.4 0.6 0.8
Ucp3L
mRNA
expression
⫻
10
5
(relative to
18S
rRNA)
h
a
a h
a h a h
E
Gill Ucp3LF
Gill Ucp55 15 25 33
0 1 2 3 4
Acclimation temperature (°C)
Ucp5
mRNA
expression
⫻
10
5
(relative to
18S
rRNA)
a,b
*
a*
b*
b hh h h
B
Brain Ucp55 15 25 33
0 0.2 0.4 0.6 0.8
Ucp1
mRNA
expression
⫻
10
5
(relative to
18S
rNA)
*
a,b
*
a a
*
bh h
h
h
D
Gill Ucp15 15 25 33
0 0.1 0.2 0.3
Ucp5
mRNA
expression
⫻
10
5
(relative to
18S
rRNA)
*
a,b*
ab
*
b h
[image:8.612.101.521.54.520.2]h h h
Fig. 3. mRNA of the most highly expressedUcpisoforms within tissue from northern (black bars) and southern (white bars)F. heteroclitus acclimated to 5, 15, 25, and 33°C.(A) Liver (Ucp1), (B) brain (Ucp5), (C) muscle (Ucp3) and (D–F) gill (Ucp1, D;Ucp3L, E;Ucp5, F). Data are means±s.e.m. expressed relative to18SrRNA expression and multiplied by 105for clarity (n=7–9 for each group). Different letters indicate a significant difference within a population and an asterisk indicates a significant difference between populations at a given acclimation temperature.
Journal
of
Experimental
(Pacclimation×subspecies=0.022). In northern killifish, P/O ratios
increased with acclimation to 5°C, but there was no effect of thermal acclimation on P/O ratios in southern killifish. Following acclimation to 25°C, southern killifish had greater P/O ratios than northern killifish (Fig. 5).
Thermal acclimation and subspecies effects on mitochondrial membrane potential
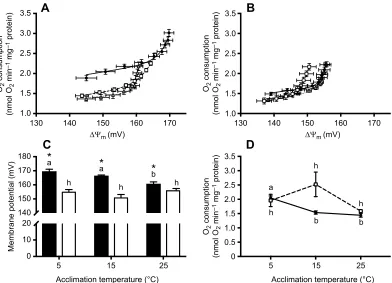
We examined mitochondrial membrane potential under state II (non-ADP phosphorylating) conditions by constructing a proton
leak kinetic curve through sequential inhibition of the ETS at complex II. The proton leak kinetic curves were strikingly different between northern and southern killifish (Fig. 6A,B). In northern killifish, there was a substantial impact of 5°C acclimation on the position of the curve, which was displaced to higher initialΔΨmand
higher rates of oxygen consumption (Fig. 6A). This effect was not observed in mitochondria from southern killifish (Fig. 6B). In addition, mitochondria from northern killifish generally operated at higher ΔΨm and with higher rates of oxygen consumption than
mitochondria from southern killifish, and this difference was particularly evident in fish acclimated to 5°C (compare Fig. 6A,B). These effects were also evident when comparing the maximum (un-inhibited) state IIΔΨm(Fig. 6C), as state IIΔΨmwas higher
in northern killifish fish than in southern killifish (Psubspecies<0.001)
at all acclimation temperatures. In northern killifish, state II ΔΨm decreased with acclimation to increasing temperatures
(Pacclimation=0.016), and this effect was not present in southern
killifish (Pacclimation×subspecies=0.001; Fig. 6C).
State II or state IV respiration is often used as a proxy for proton leak across the inner mitochondrial membrane, but accurate quantification of proton leak requires assessing leak-driven oxygen consumption at a defined value of the membrane potential, which can be derived from the proton leak kinetic curves. Quantification of changes in mitochondrial proton conductance (proton leak) across the inner mitochondrial membrane is usually performed by assessing O2
consumption rate at the highest common ΔΨm among treatments.
When considering the average proton leak kinetic curves for each subspecies and all three acclimation treatments, the highest common ΔΨm was 150.6 mV. At this membrane potential, northern 0
10 20 30 40
State III O
2
consumption
(nmol O
2
min
–1
mg
–1
protein)
*
ab
b
h h
h
A
20 25 30 35 40
O2
consumption
(nmol O
2
min
–1
mg
–1
protein)
C
*
ab
b h
h
h
0 1 2 3 4
State IV O
2
consumption
(nmol O
2
min
–1
mg
–1
protein)
a a
a h
h
h
B
0 2 4 6 8 10 12
Acclimation temperature (°C)
RCR (state III/state IV)
*
ab
a,b h
h
h
D
5 15 25 5 15 25
[image:9.612.109.506.56.341.2]5 15 25 5 15 25
Fig. 4. Mitochondrial O2consumption rates (nmol O2min−1mg protein−1) and respiratory control ratios (RCRs) for liver mitochondria
from northern (black circles, solid line) and southern (white squares, dashed line)F. heteroclitusacclimated to 5, 15 and 25°C and assayed at 15°C.Data are means±s.e.m. (n=5–6 for each group). (A) State III (maximal ADP phosphorylating) respiration, (B) state IV (oligomycin) respiration, (C) FCCP-stimulated respiration and (D) RCR, the ratio of state III/state IV respiration. Different letters indicate a significant difference between acclimation temperatures within a population, and an asterisk indicates a significant difference between populations at a given acclimation temperature. Data were analyzed using (A,B,D) planned comparisont-tests followed by FDR correction and (C) a Mann–WhitneyUrank sum test followed by FDR correction.
5 15 25
0 0.2 1.0 1.2 1.4 1.6 1.8
Acclimation temperature (°C)
ADP/O
a
*
ab h
h h
Fig. 5. P/O ratios for northern (black bars) and southern (white bars) F. heteroclitusacclimated to 5, 15 and 25°C and assayed at 15°C.Data are means±s.e.m. (n=4–6 for each group). Different letters indicate a significant difference within a population among acclimation temperatures as determined by planned comparisont-tests followed by FDR correction. An asterisk indicates
a significant difference between populations at a given acclimation temperature.
Journal
of
Experimental
[image:9.612.84.266.543.674.2]killifish liver mitochondria showed increased proton conductance following acclimation to 5°C, but southern killifish showed no difference in proton conductance with thermal acclimation (Pacclimation×subspecies=0.028, Pacclimation=0.010; Fig. 6D). There was
only a modest difference between the subspecies in proton conductance at the highest common membrane potential (Psubspecies=0.041), and this
difference was not evident inpost hocanalyses.
Taken together, these data suggest that there is little difference between the subspecies in the intrinsic proton conductance of the IMM (Fig. 6D), but that northern fish mitochondria tend to operate at a higherΔΨmwith a resulting higher level of proton conductance
(Fig. 6A–C), and that these differences are particularly evident when fish are acclimated to low temperatures.
Fatty-acid-induced uncoupling and thermal acclimation UCP1, which is the dominant UCP isoform in killifish liver (Fig. 2), is known in mammals to be activated by free fatty acids of a variety of chain lengths, reactive alkenals and superoxide products, and to be inhibited by purine nucleotides (e.g. ADP, ATP, GDP and GTP) (Klingenberg and Huang, 1999; Davis et al., 2008; Shabalina et al., 2004). Here, we utilized palmitate, which is a known fatty-acid activator of UCPs, causing increases in mitochondrial O2
consumption rate and decreases inΔΨm(e.g. Jastroch et al., 2007;
dos Santos et al., 2013b; Jastroch et al., 2012), to assess the functional role of UCP1 in affecting proton conductance in killifish liver.
Preliminary analyses (data not shown) indicated that although killifish liver mitochondria responded to palmitate in the expected
manner (i.e. with a decrease inΔΨm), the response could not be
reversed by GDP or GTP. Several concentrations of GDP were tested and the effectiveness of the protocol used was assessed using mitochondria isolated from rat (Rattus norvegicus) BAT. In rat BAT mitochondria, the addition of palmitate caused a 29.4% increase in O2 consumption rate and a 5% decrease in membrane potential.
Upon administering GDP following the palmitate addition, O2
consumption rate and membrane potential were restored by a 41.6% decrease and a 9.5% increase, respectively. In contrast, in killifish mitochondria, the increased respiration and decreased ΔΨm that
corresponded to the addition of palmitate was not inhibited by the addition of 8 mmol l−1 glutamate (high extra-mitochondrial
glutamate blocks the glutamate aspartate transporter; Samartsev et al., 1997), 6 µmol l−1 cyclosporine A (an inhibitor of the
permeability transition pore) or 50 µmol l−1 genepin (a known
inhibitor of UCP2) (data not shown). The addition of Cat (a known inhibitor of the adenine nucleotide translocator) resulted in the return of approximately 20% of the increase in respiration and decrease in ΔΨm (data not shown), and thus 5 µmol l−1 Cat was
included in every run to exclude the effects of the ANT on proton leak.
Exposure to palmitate caused a significant increase in O2
consumption rate over control conditions in northern killifish liver mitochondria following acclimation to 5 and 15°C but not 25°C (P5°C=0.038, P15°C=0.019, P25°C=0.296; Figs 7A–C, 8A). In
contrast, exposure to palmitate had no effect on O2 consumption
rate in southern killifish liver mitochondria at any acclimation temperature (P5°C=0.937,P15°C=0.803,P25°C=0.396; Figs 7D–F, 8B).
130 140 150 160 170
1.0 1.5 2.0 2.5 3.0 3.5
O2
consumption
(nmol O
2
min
–1
mg
–1
protein)
A
0 10 20 140 150 160 170 180
Acclimation temperature (°C) ΔΨm (mV)
Membrane potential (mV)
C
*
a
*
a
*
b h
h h
130 140 150 160 170
1.0 1.5 2.0 2.5 3.0 3.5
O2
consumption
(nmol O
2
min
–1
mg
–1
protein)
O2
consumption
(nmol O
2
min
–1
mg
–1
protein)
B
0 0.5 1.0 1.5 2.0 2.5 3.0 3.5
a
b b
h
h
h
D
ΔΨm (mV)Acclimation temperature (°C)
[image:10.612.113.505.57.340.2]5 15 25 5 15 25
Fig. 6. Thermal acclimation and population effects on liver mitochondrial proton leak kinetics inFundulus heteroclitus.(A) Proton leak kinetic curves from northern and (B) southern killifish acclimated to 5°C (black circles, solid line), 15°C (white squares, dashed line) and 25°C (gray triangles, dotted line). (C) State II membrane potential (mV) measured in liver mitochondria form northern (black bars) and southern (white bars) killifish acclimated to 5, 15 and 25°C. Data are means±s.e.m. (n=6–7 for all groups). (D) O2consumption rate (nmol O2min−1mg−1protein) at the highest common membrane potential (ΔΨm, 150.6 mV) from northern (black circles, solid line) and southern (white squares, dashed line) killifish acclimated to 5, 15 and 25°C and assayed at 15°C. Letters that differ indicate a significant difference within a population and an asterisk indicates significant differences between populations at a given acclimation temperature as determined by planned comparisont-tests followed by FDR corrections.
Journal
of
Experimental
DISCUSSION
This study represents a comprehensive examination of the effects of thermal acclimation and adaptation on mitochondrial proton leak and efficiency in two subspecies of a eurythermal teleost, F. heteroclitus, and an examination of the potential role of UCPs in modulating these effects. The most striking pattern that we observed was a difference in the plasticity of proton leak and mitochondrial efficiency in response to temperature acclimation between northern and southern killifish. In liver mitochondria from northern killifish, cold acclimation caused an increase in both respiratory capacity and proton leak, and these effects were absent in southern killifish. But, paradoxically, this increase in proton leak was associated with an increase in P/O ratio in northern killifish at
low acclimation temperatures, suggesting that the increase in ATP-synthesizing capacity in northern killifish in response to cold was greater than the increase in proton leak. In liver,Ucp1 was the primary UCP isoform expressed, and it was generally expressed at higher levels in northern killifish than in southern killifish. This is consistent with the observation that at a functional level, palmitate stimulation of proton leak was detectable only in mitochondria from northern killifish, suggesting there may be differences in UCP activity between subspecies. Taken together, these data indicate that northern killifish have an enhanced capacity to respond to cold acclimation relative to southern killifish, possibly associated with differences in the regulation and activity of UCPs.
120 130 140 150 160 170
1.0 1.5 2.0 2.5 3.0 3.5
O2
consumption (nmol O
2
min
–1
mg
–1
protein)
A
120 130 140 150 160 170
1.0 1.5 2.0 2.5 3.0
3.5
D
120 130 140 150 160 170
1.0 1.5 2.0 2.5 3.0
3.5
B
120 130 140 150 160 170
1.0 1.5 2.0 2.5 3.0 3.5
E
120 130 140 150 160 170
1.0 1.5 2.0 2.5 3.0
3.5
C
120 130 140 150 160 170
1.0 1.5 2.0 2.5 3.0
3.5
F
[image:11.612.55.564.55.322.2]ΔΨm (mV)
Fig. 7. Proton leak kinetic curves with or without palmitate for thermally acclimated northern and southernFundulus heteroclitus.Proton leak kinetic curves for control (black circles, solid lines) and palmitate-treated (35 µmol l−1, white squares, dashed lines) liver mitochondria from northern (A–C) and southern (D–F)F. heteroclitusacclimated to 5 (A,D), 15 (B,E) and 25°C (C,F) and assayed at 15°C. Data are means±s.e.m. (n=6–7 for all groups).
0 0.5 1.0 1.5 2.0 2.5 3.0 3.5
O2
consumption
(nmol O
2
min
–1
mg
–1
protein)
A
*
*
0 0.5 1.0 1.5 2.0 2.5 3.0 3.5
Acclimation temperature (°C)
B
5 15 25 5 15 25
Fig. 8. State II O2consumption (nmol O2min−1mg−1protein) with oligomycin present for liver mitochondria from northern and southernF. heteroclitus
exposed to control conditions (black bars) or 35 µmol l−1palmitate (white bars) and assayed at 15°C.At each acclimation temperature, control and palmitate O2consumption values were compared at the membrane potential demonstrating the greatest effect of palmitate: (A) northern killifish: 5°C at 164 mV, 15°C at 165 mV and 25°C at 158 mV; (B) southern killifish: 5°C at 151 mV, 15°C at 142 mV and 25°C at 145 mV. An asterisk indicates significant differences between treatments at a given acclimation temperature and membrane potential as determined by at-test. Data are means±s.e.m. (n=6–7 for each group).
Journal
of
Experimental
[image:11.612.111.510.544.683.2]What are the mRNA expression patterns of UCP isoforms in both subspecies with thermal acclimation?
To investigate whether UCPs could be involved in regulating proton leak in killifish, we first characterized the complement of UCP isoforms present in this species. The phylogenetic relationships between the Ucpisoform gene sequences from fish and tetrapod species support the existence of a coreUcpfamily consisting of the closely relatedUcp1,Ucp2andUcp3, withUcp5being less closely related (Fig. 1) (Jastroch et al., 2005; Mark et al., 2006; Tine et al., 2012; Tseng et al., 2011; Wen et al., 2015). However, our ability to discriminate among these families was limited (as indicated by the low bootstrap values on the branches for Ucp1,Ucp2and Ucp3; Fig. 1), which is most likely due to high similarity in the sequences of the members of the coreUcpfamily (Hughes and Criscuolo, 2008). In addition, a fish-specific isoform (Ucp3L) was also identified inF. heteroclitusand was shown to be most closely related to the fish Ucp3isoform gene sequence.Ucp3Lhas previously been identified in other studies as a fish-specificUcpisoform that is believed to be a product of the teleost genome duplication event (Tine et al., 2012; Wen et al., 2015). This isoform has been independently lost in several fish species, but is present in several others (Tine et al., 2012). We were unable to identify Ucp4 in the genome of F. heteroclitus, but it has previously been identified in zebrafish and cave fish (Wen et al., 2015; Tseng et al., 2011), suggesting that it is present in at least some fish species. At present, the killifish genome is not entirely complete, and thus this isoform may be present in one of the unsequenced regions. Alternatively, this isoform may have been lost from the killifish genome.
Ucp mRNA displayed tissue-specific expression patterns, consistent with what is known in other species (Fig. 2 and Figs S3-S6). In mammals, Ucp1is found in BAT (Nicholls and Locke, 1984; Nicholls, 2001), whereas in fish,Ucp1has been found primarily in the liver, where it has the highest expression relative to the other isoforms (Jastroch et al., 2005; Wen et al., 2015). This is also the case inF. heteroclitus(Fig. 2C), although it was also present at intermediate levels in gill tissue (Fig. 2B).Ucp3is known to be a skeletal-muscle-specific isoform across species from fish to mammals (Boss et al., 1997; dos Santos et al., 2013b; Vidal-Puig et al., 1997), and it is also found inF. heteroclitusat the highest levels in skeletal muscle (Fig. 2D). The fish-specific isoform, Ucp3L, has been identified in several other fish species, but its tissue distribution has not been fully characterized (Tine et al., 2012; Wen et al., 2015). Here, we show thatUcp3Lis primarily expressed in gill tissue in F. heteroclitus(Fig. 2B). Gill tissue displayed the most diversity inUcpisoform expression, potentially indicating that the different UCP isoforms may play separate functional roles or may differ by cell types even within a tissue. Ucp5 was most highly expressed in the brain (Fig. 2B), and this has also been demonstrated in zebrafish (Tseng et al., 2011). The consistency of killifishUcp mRNA expression with that of other species further indicates that the tissue-specific expression patterns of the Ucp isoforms are conserved and are likely functionally important.
The effects of thermal acclimation on UcpmRNA expression patterns differed depending on isoform, tissue and subspecies (Fig. 3 and Figs S3–S6). This may be indicative of each isoform having a different functional role in response to thermal acclimation and this role varying depending on the tissue and subspecies being investigated. One possible mechanism that could account for differences in gene expression among acclimation temperatures could be differences in mitochondrial volume density with thermal acclimation. Fangue et al. (2009a,b) and Chung et al. (2018) provided some evidence that there may be an increase in
mitochondrial amount or volume density following cold exposure in liver tissue from northern killifish. Similarly, Dhillon and Schulte (2011) detected increases in mitochondrial volume density in the muscle of northern killifish following cold acclimation. However, if a change in mitochondrial volume density was the only factor influencing the level of Ucp mRNA expression, it would be expected that all isoforms would change in a similar manner correlating to changes in mitochondrial volume density. In contrast, we found that the patterns of expression of differentUcpisoforms were not the same within a single tissue, suggesting that single factor such as a change in mitochondrial volume density is unlikely to drive all of the observedUcpmRNA expression patterns. Instead, we hypothesize that the differentUcpisoforms are likely regulated through different transcriptional regulatory programs.
UcpmRNA expression changes more in northern killifish liver mitochondria with thermal acclimation than it does in southern killifish (Fig. 3 and Figs S3–S6). This suggests that northern killifish have an enhanced capacity to respond to thermal acclimation. Although both subspecies experience similar variation in temperature throughout the seasons, the range of temperatures at the northern latitudes is colder than that at the southern latitudes (Fangue et al., 2006; Schulte, 2007). Thus animals or populations that experience winter cold may require greater plasticity of thermal responses than those that experience overall warmer temperatures. Further investigation is required to determine whether this is a general pattern. Overall, the patterns we observe in Ucp mRNA expression are consistent with the hypothesis that northern killifish have greater plasticity in mitochondrial function compared with southern killifish.
What are the effects of thermal acclimation on mitochondrial function in northern and southern killifish?
In addition to changes in Ucp mRNA expression, changes in mitochondrial function with thermal acclimation were observed in northern, but not southern, killifish liver mitochondria. This provides additional evidence that there are differences in the ability of these subspecies to respond to thermal change. Liver mitochondria from cold-acclimated northern killifish exhibited increases in ADP-phosphorylating respiration (state III; Fig. 4A), maximal ETS capacity measured as FCCP-stimulated respiration (Fig. 4C), mitochondrial coupling (RCRs, FCCP-stimulated respiration and P/O; Figs 4D and 5) and proton conductance (Fig. 6A,D). These changes in northern killifish liver mitochondria are consistent with compensation for decreased enzyme activity following prolonged cold exposure, as has been observed in other fish species (Guderley, 2004; dos Santos et al., 2013a; St-Pierre et al., 1998; Chung et al., 2018). The potential for cold compensation has previously been detected in another population of northernF. heteroclitus(Chung and Schulte, 2015; Chung et al., 2018), collectively supporting a role for increases in respiratory capacity as a compensatory mechanism in the northern subspecies of killifish. Unlike northern killifish liver mitochondria, we did not detect cold compensation in southern killifish liver mitochondria. However, Chung et al. (2018) found that an increase in mitochondrial respiratory capacity following cold acclimation in both northern and southern killifish. A possible explanation for this discrepancy is that Chung et al. (2018) provided liver mitochondria with either complex I or a mixture of complex I and complex II substrates, whereas in our study, only complex II substrates were provided. This suggests that there may be differences between the subspecies in the ability to change different components of mitochondrial physiology in response to thermal acclimation.
Journal
of
Experimental
Cold acclimation caused a pronounced shift in proton leak kinetics in northern killifish, such that northern killifish had increased proton conductance, as represented by increased state II (leak) O2consumption rates and changes in the shape and position
of the proton leak kinetic curve, following acclimation to 5°C (Fig. 6A,D). In contrast, proton leak kinetics did not differ significantly with thermal acclimation in southern killifish (Fig. 6B,D). Northern fish at 5°C also exhibited greater initial ΔΨmunder state II conditions (Fig. 6A), suggesting that in addition
to an increase in proton leak, there was also an increase in substrate oxidation or ETS capacity following cold acclimation. In contrast, there was no evidence of cold compensation in respiratory capacity, proton leak or coupling in southern killifish. When considered together, the increase in proton leak (Fig. 6A,D) along with the P/O ratios (Fig. 5), state IV respiration rates (Fig. 4B) and RCRs (Fig. 4C) suggest that liver mitochondria from cold-acclimated northern fish exhibit increases in proton leak, mitochondrial capacity and ADP-phosphorylating capacity following cold acclimation, whereas liver mitochondria from southern killifish do not demonstrate this effect.
Following acclimation to 25°C, southern killifish had greater P/O ratios than northern killifish, indicating that mitochondria from southern killifish are more efficient than those from northern killifish following warm acclimation (Fig. 5), suggestive of improved performance in response to warm acclimation in the putatively warm-adapted subspecies. However, there were no differences between the subspecies in leak respiration or mitochondrial coupling (Fig. 4B,D). This apparent discrepancy suggests that there may be differences between the subspecies in thermal acclimation responses of different ETS components and in mitochondrial coupling under non-phosphorylating (state IV) or phosphorylating (state III) conditions and provides a clear example of the difficulty of interpreting measures of state IV respiration and RCR values.
Taken together, these results suggest that northern, but not southern, killifish recruit substantial changes in mitochondrial capacity and proton leak in response to cold acclimation, which supports a role for putative local adaptation in thermal responses. The effects of cold acclimation on mitochondrial capacity and proton leak in northern killifish contrast against cold-acclimation responses in other ectotherms (Jastroch et al., 2007; Trzcionka et al., 2008). Indeed, Trzcionka et al. (2008) and Jastroch et al. (2007) observed a marked decrease in proton conductance in response to cold acclimation in liver mitochondria from cane toads (Bufo marinus) and common carp (Cyprinus carpio), respectively. Both studies interpreted the decrease in proton leak as a mechanism to increase mitochondrial efficiency as an energy-saving mechanism related to cold-induced metabolic depression. In contrast, in northern killifish, we observed an increase in mitochondrial capacity and proton conductance in the cold, suggesting a pattern of cold compensation. Similarly, in goldfish, dos Santos et al. (2013a) detected increases in state IV respiration rate in skeletal muscle mitochondria with cold acclimation, suggesting increases in proton leak in the cold. However, dos Santos et al. (2013a) did not characterize proton leak kinetic curves to accurately estimate proton leak at a common ΔΨm and were thus unable to disentangle the
effects of changes in proton leak from changes in substrate oxidation (Divakaruni and Brand, 2011). Interestingly, in goldfish, state III and state IV respiration rates increased in parallel in response to cold acclimation, resulting in no change in RCR (dos Santos et al., 2013a), whereas in northern killifish, we observed a greater change in state III respiration compared with state IV respiration, resulting
in an increase in RCR following cold acclimation. This indicates that ectotherms may adjust both mitochondrial substrate oxidation and proton leak in different ways in order to cope with the effects of long-term cold exposure.
Is there a correlation betweenUcpmRNA expression and fatty-acid-induced uncoupling in killifish liver mitochondria? We investigated mitochondrial responses to the presence of the fatty acid palmitate in order to demonstrate a putative functional role for UCPs in modulating mitochondrial proton leak with thermal acclimation. We predicted that fatty-acid-induced uncoupling would be greatest in northern killifish at lower temperatures as Ucp1was more highly expressed in liver of northern killifish than in southern killifish at all acclimation temperatures, and decreased greatly in both subspecies at an acclimation temperature of 25°C (Fig. 3A). Consistent with our prediction, fatty-acid-induced uncoupling from isolated killifish liver mitochondria was only observed in northern killifish mitochondria at 5 and 15°C (Figs 7 and 8). These data indicate that the northern subspecies, which experiences colder habitat temperatures, may have a greater capacity adjust mitochondrial function following cold exposure, and that one component contributing to this response may involve the regulation ofUcp1.
A notable finding from our work is that we were not able to inhibit fatty-acid-induced uncoupling using classic UCP inhibitors such as GDP or GTP. The effectiveness of UCP inhibition by different purine nucleotidesin vitrois still debated (e.g. Woyda-Ploszczyca and Jarmuszkiewicz, 2014), and in some scenarios, such as with goldfish UCP3 in skeletal muscle (dos Santos et al., 2013b) and lamprey UCP (Wang et al., 2010), inhibition by purine nucleotides cannot be induced. There are several possibilities as to why purine nucleotides did not inhibit fatty-acid-induced uncoupling. Firstly, the structure of killifish UCP1 may prevent the binding of purine nucleotides. The amino acid sequence hypothesized to be associated with purine nucleotide binding (amino acids 261–269; Bouillaud et al., 1994) differs by two amino acids between mammalian and killifish genomes. Phe267 is Tyr267 in the killifish UCP1 and Ala264 is Thr264 in the killifish UCP1 (NCBI killifish genome, Fundulus_heteroclitus-3.0.2, GCF_000826765.1, annotation release 101). Although the importance of the Ala→Thr substitution has not been investigated, there is some evidence that the Phe→Tyr substitution does not appear to alter UCP function (Bouillaud et al., 1994). Other amino acids that may be involved in UCP purine nucleotide binding include three Arg residues (Modrianský et al., 1997) of which killifish have all three. Another possibility is that any observed fatty-acid-induced uncoupling is not due to UCPs at all and is a result of another effect palmitate has on the mitochondrial membrane (Ibarguren et al., 2014; Zavodnik et al., 1996). All of the functional assays (including those with palmitate addition) were performed in the presence of Cat, an ANT inhibitor. However, the efficacy of Cat for inhibiting the ANT was not directly tested and therefore we cannot fully rule out the potential effects of ANT-mediated proton leak. Preliminary analyses in northern fish acclimated to 15°C indicated that ANT may contribute to approximately 20% of leak respiration. We have yet to test for the possibility that ANT may contribute more substantially to the modulation of mitochondrial proton leak in southern killifish or in northern killifish at other acclimation temperatures.
If the moderate fatty-acid-induced uncoupling seen here is due to UCPs, this may suggest that northern killifish liver mitochondria have a greater capacity to uncouple through UCPs following acclimation to colder temperatures (5 and 15°C). Other studies in