warwick.ac.uk/lib-publications
A Thesis Submitted for the Degree of PhD at the University of Warwick
Permanent WRAP URL:
http://wrap.warwick.ac.uk/80224
Copyright and reuse:
This thesis is made available online and is protected by original copyright.
Please scroll down to view the document itself.
Please refer to the repository record for this item for information to help you to cite it.
Our policy information is available from the repository home page.
A STATISTICAL METHOD FOR
DETERMINING AND REPRESENTING
FORMABILITY
Innovation Report
by
Neil Small
An innovation report submitted in partial fulfilment of the requirements for the degree of
Engineering Doctorate
University of Warwick, Warwick Manufacturing Group
“If at first you don’t succeed, Try, try, try again”
i
A
BSTRACT
Formability, conventionally characterised by the Forming Limit Curve (FLC), is a critical measure used to define the working limit of sheet metal in a forming operation. The FLC defines the limit strain the material can undergo before failure occurs. The importance of this failure criterion means it is used at various stages in the development of automotive body panels: during material selection; during stamping simulations; and in the purchase of stamping tools before commencing serial production.
To mitigate against the risk that the FLC is positioned incorrectly; that mechanical property variation between blanks causes reduced formability; and that conditions imposed by the stamping operation itself cause premature failure, a safety margin is introduced. The size of the safety margin is based on the industrial sponsor’s prior experience and attitude to risk, as opposed to an objective analysis of each of the risks posed to formability. Uncertainty around the position of an FLC arises from the dispersed limit strains that characterise the results of standardised formability tests. The aim of this research was to understand and characterise the uncertainty of the formability test, and develop a more accurate and precise method for determining and representing formability.
Initial tests were carried out according to the standard ISO method, and a digital image correlation (DIC) technique was used to measure full-field strains on each specimen throughout the tests. Two observations were made. Firstly, the method of analysis advocated by the ISO standard requires subjective interpretation to define a limit strain. Secondly, the full-field strain measurements showed a “noisy” strain distribution overlaid over the expected strain field. This “noise” was significant compared to the uncertainty of the DIC instrument.
A solution was developed by adopting a statistical attitude to model surface strain measurements. Strains from the beginning of deformation up to fracture were characterised by a fundamental analysis. The analysis showed that the forming limit of an individual test is statistical in nature, and that the strains’ statistical character exhibits recognisable trends that evolve from the start of the tests up to necking. A new 'time-dependent' method based on the innovative application of a Gaussian Mixture Model (GMM) was developed to characterise these trends, and quantify the forming limit. The GMM was used to objectively identify the locus of a localised neck; identify the onset of necking; and characterise the neck at the forming limit. Rather than selectively analysing strains in a pre-determined area of a specimen, and at a selected time of the test, the developed technique eliminates the subjectivity that is required by the current ISO-standard method.
The new GMM technique describes formability as a probabilistic risk of failure. Strain measurements made on single specimens were turned into a complimentary statistical formability criterion using the logistic regression technique proposed by Strano & Colosimo (2006). Formability Maps (FMs) were constructed to show the probability of failure contours on the Forming Limit Diagram (FLD). FMs derived from the GMM provide the precise representation of formability that is missing from the FLC, and that is required to objectively interpret the risk of failure for an industrial panel.
ii
D
ECLARATION
This innovation report is submitted to the University of Warwick in support of my application for the degree of Engineering Doctorate. It has been composed by myself, and is being resubmitted following the recommendations of the examination panel subsequent to the oral examination which was conducted on 19/05/14.
The work presented (including data generated and data analysis) was carried out by myself, except where explicitly stated.
E
NGINEERING
D
OCTORATE
M
ENTORS
Academic Mentors: Dr Sumit Hazra, Prof Rajat Roy, Dr Darren Hughes Industrial Mentor: Mr Richard Aylmore
I
NDUSTRIAL
S
PONSOR
iii
A
CKNOWLEDGEMENTS
I wish to offer my deepest thanks for the assistance and guidance I have received from Dr Sumit Hazra. This project would not have been nearly as enjoyable without Sumit’s unwavering patience, enthusiasm, and support.
I would like to thank Dave Williams and Professor Rajat Roy from WMG for their many words of wisdom, and their constructive feedback and support. Thanks also to Dr Tom Nichols for providing an informative insight and engaging discussions on the application and intricacies of statistical models.
From Jaguar Land Rover, I would like to thank Richard Aylmore and Dominic Hollingdale for their support and direction throughout this process.
I would like to thank everyone at WMG and Jaguar Land Rover who have provided me with their time, assistance, and expert knowledge.
I am grateful to both the Engineering and Physical Sciences Research Council and Jaguar Land Rover for financially supporting this project.
I am also grateful to my examiners not only for dedicating their valuable time to reading my research, but also for providing me with clear and concise feedback.
iv
C
ONTENTS
Abstract ... i
Declaration ... ii
Acknowledgements... iii
List of Figures ... vi
List of Tables ... ix
Glossary... x
Acronyms ... x
Mathematical Symbols ... x
Plasticity Modelling ... x
Statistical Modelling ... xi
1 Introduction ... 1
1.1 The Motor Industry in 2014 ... 1
1.2 Material Selection in Car Bodies ... 3
1.3 Sheet Metal Forming... 3
1.3.1 Formability ... 3
1.3.2 The Forming Limit Curve ... 4
1.3.3 Manufacturing Risk ... 4
1.4 Motivation ... 6
1.5 Conclusions ... 7
1.6 Research Methodology and Innovation Report Structure ... 7
1.6.1 Research Methodology ... 7
1.6.2 Innovation Report Structure ... 9
2 Research Background ... 11
2.1 Determining Formability ... 11
2.1.1 Tests for Determining Formability ... 11
2.1.2 Surface Strain Measurement ... 14
2.1.3 Determining Formability ... 15
2.2 Influence of Mechanical Properties on Formability ... 19
2.2.1 Anisotropy ... 19
2.2.2 Strain and Strain Rate Hardening ... 23
2.2.3 Surface Strain Heterogeneity ... 24
2.3 Characterising Formability ... 27
2.4 Influence of Strain Path Non-Linearity on Formability ... 29
2.5 Discussion ... 31
2.5.1 Characterising Formability ... 31
2.5.2 Assessing the Formability of Industrial Panels ... 32
2.5.3 Methodology and Contribution of this Work ... 32
v
3 A New Statistical Method for Determining and Representing Formability ... 34
3.1 Data Collection and Formability Benchmarking ... 34
3.2 Exploratory Data Analysis ... 38
3.2.1 Central Tendency and Dispersion ... 38
3.2.2 Distribution Shape... 41
3.3 A Statistical Model of Plastic Deformation ... 43
3.3.1 Model Selection ... 43
3.3.2 Applying Gaussian Mixture Modelling to DIC Measurements ... 48
3.4 Describing the Localised Neck using Statistical Clustering ... 50
3.5 Identifying the Onset of Localised Necking using Gaussian Mixture Modelling ... 54
3.6 Representing Formability ... 56
3.6.1 Results ... 59
3.7 Conclusions ... 66
4 Using the Formability Map to Perform a Design Feasibility Study ... 67
4.1 Method ... 67
4.2 Results ... 68
4.3 Discussion ... 71
4.3.1 The Cost of Improving the Performance of the Rear Fender Outer Toolset ... 71
4.3.2 Further Comments on the Application of a Formability Map to an Industrial Panel ... 73
4.4 Conclusions ... 74
5 Predicting Strain Behaviour at the Forming Limit using the Marciniak-Kuczynski Model ... 75
5.1 Predicting Formability ... 76
5.1.1 The Marciniak-Kuczynski Model ... 76
5.1.2 Advancements to the M-K Model ... 79
5.2 Method ... 80
5.3 Results ... 84
5.4 Discussion ... 85
5.5 Conclusions ... 89
6 Conclusions ... 91
6.1 Future Research ... 93
6.1.1 Improving the Description of the Transition from Diffuse to Localised Necking ... 93
6.1.2 Quantifying the Impact of the Stamping Operation on the Formability Map ... 94
6.1.3 Correlating Microscopic Plasticity to Macroscopic Strain Behaviour using High-Resolution DIC ... 94
vi
L
IST OF
F
IGURES
Figure 1: Roadmap for technology improvement proposed in 2009 by the Department for Business Innovation and Skills (2009) ... 2
Figure 2: The Forming Limit Curve demonstrating relevant strain paths and forming modes ... 4
Figure 3: FLDs showing the typical experimental scatter of limit strains of (a) 0.9mm DP600 and (b) 1.2mm AA6111T4 ... 5
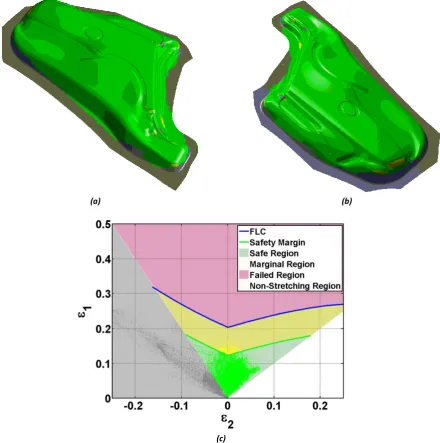
Figure 4: Example of a rear fender drawn shell viewed from (a) topside, (b) underside, and (c) comparison against the FLC ... 5
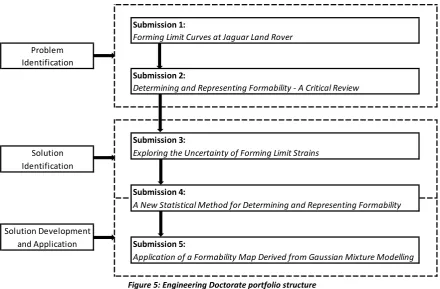
Figure 5: Engineering Doctorate portfolio structure ... 7
Figure 6: Schematics of tools used in (a) the Nakazima method, and (b) the Marciniak method ... 11
Figure 7: A "double peak" in the major strain distribution of a HXT600X specimen deformed by Merklein et al. (2010) using Nakazima tooling ... 13
Figure 8: FLCs demonstrating the strain paths generated by Marciniak and Nakazima tooling (Abspoel et al. (2013)) ... 13
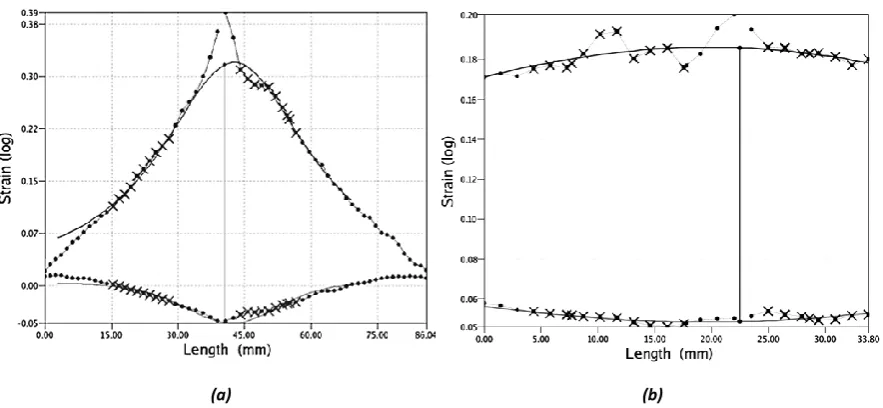
Figure 9: Major strain profiles (upper outline in (a) and (b)) and minor strain profiles (lower outline in (a) and (b)) drawn across two Nakazima specimens, where (a) demonstrates a specimen conforming closely to a second-order polynomial, and (b) a specimen poorly conforming to a second-order polynomial ... 17
Figure 10: Time series as calculated using the methods of (a) Merklein et al. (2010), and (b) Volk & Hora (2010) ... 18
Figure 11: Strain topographies of an AA5XXX alloy measured by Wang et al. (2014) using Digital Image Correlation, where (a) demonstrates the major strain topology of a tensile sample at the onset of fracture, and (b) a Marciniak specimen at the onset of localised necking ... 18
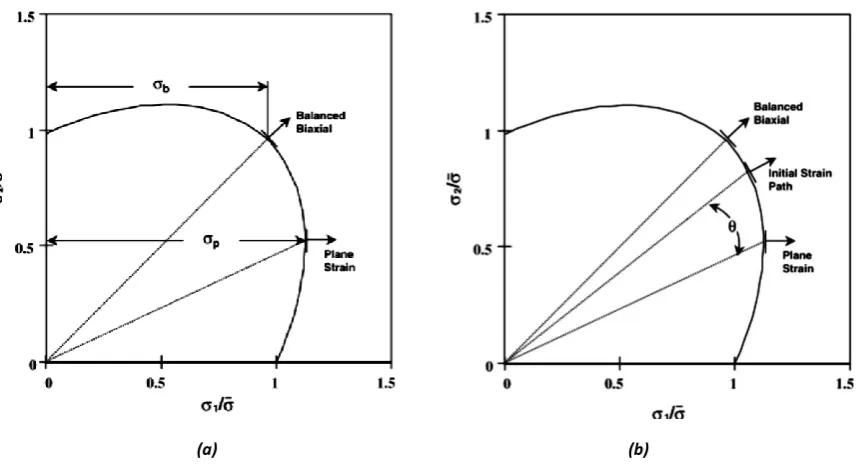
Figure 12: Graphical representations of (a) Barlat's parameter P (σp/σb) and (b) Friedman’s parameter θ (angular difference between the initial strain path and plane strain) taken from Barlat (1987) and Friedman & Pan (2000) ... 21
Figure 13: Demonstrating the effect of anisotropy on Hill's 1948 yield curve. (a) Variable 𝑹 assuming normal anisotropy, (b) Variable R90 assuming planar anisotropy ... 22
Figure 14: (a) A probabilistic forming limit diagram proposed by van Minh et al. (1974), (b) A FLB proposed by Janssens et al. (2001) ... 27
Figure 15: Formability Map calculated using logistic regression by Strano & Colosimo (2006) ... 29
Figure 16: Limit strains measured for six selected materials using the standardised method (denoted ISO12004-2), the method of Merklein et al. (2010) (denoted MKG) and the method of Volk & Hora (2010) (denoted VH) ... 35
Figure 17: Mean interpolated FLCs measured for six selected materials using the standardised method (denoted ISO12004-2), the method of Merklein et al. (2010) (denoted MKG) and the method of Volk & Hora (2010) (denoted VH) ... 36
Figure 18: Time series generated for a specimen of 1.2mm AA6111T4 undergoing plane strain deformation using the methods of (a) Merklein et al. (2010) and (b) Volk & Hora (2010) ... 37
vii Figure 20: Boxplots showing the change in distribution of ε3 in the Zone of Evaluation of Marciniak
specimens stretched in (a) uniaxial tension, (b) plane strain, and (c) equibiaxial tension ... 40
Figure 21: Examples of (a) a histogram, and (b) kernel density estimate used to estimate distribution shape ... 41
Figure 22: PDFs showing the evolution of the distribution of strains in a Marciniak specimen deformed in (a) uniaxial tension, (b) plane strain, and (c) equibiaxial tension ... 42
Figure 23: Dendrogram fitted to the final DIC measurement of a 1.2mm AA6111T4 specimen deformed in plane strain ... 44
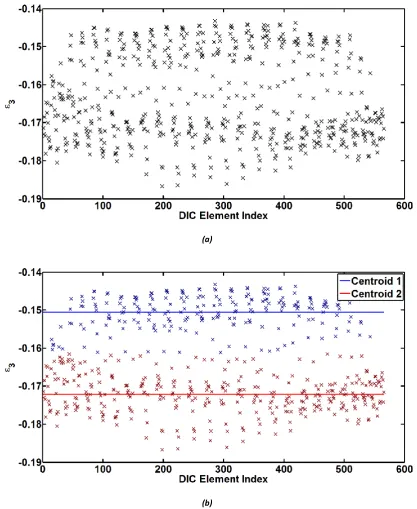
Figure 24: (a) Raw strain data from a DIC measurement, subsequently clustered using the K-means algorithm in (b) showing the clustered data and centroid positions ... 45
Figure 25: PDF calculated using a 2-component GMM ... 47
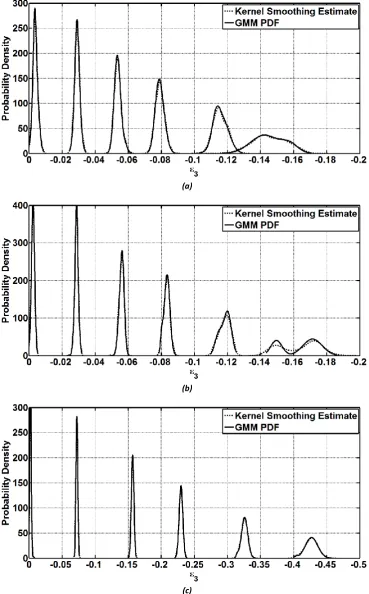
Figure 26: GMM PDFs showing the evolution of the distribution of strains in a Marciniak specimen deformed in (a) uniaxial tension, (b) plane strain, and (c) equibiaxial tension ... 49
Figure 27: Results of DIC measurement no. 310/316 where (a) is a MATLAB visualisation of the DIC measurement, (b) is the PDF calculated from the fitted mixture model, (c) is the DIC measurement reconstructed to show the probability of each element being drawn from the second component, and (d) shows the position of the clusters on the specimen ... 52
Figure 28: Results of DIC measurement no. 315/316, where (a) is a MATLAB visualisation of the DIC measurement, (b) is the PDF calculated from the fitted mixture model, (c) is the DIC measurement reconstructed to show the probability of each element being drawn from the second component, and (d) shows the position of the clusters on the specimen ... 53
Figure 29: (a) History of µ1,2 of 2-component GMMs fitted to the DIC measurement history of a specimen of 1.2mm AA6111T4 undergoing plane strain deformation, and (b) the corresponding |µ2 - µ1| ... 55
Figure 30: Broken stick regression lines applied to the |µ2 - µ1| history of a specimen of 1.2mm AA6111T4 undergoing plane strain deformation ... 56
Figure 31: FLB fitted to strains of 1.2mm AA6111T4 measured at the forming limit ... 57
Figure 32: Strains measured on specimens of 1.2mm AA6111T4 at the onset of localised necking, showing their affinity to Cluster 1 (outside the neck) or Cluster 2 (inside the neck) ... 58
Figure 33: A FM of 0.93mm AA6111T4 fitted to GMM-clustered DIC measurements ... 59
Figure 34: A FM of 0.93mm AA6111T4 compared to FLCs calculated by established methods ... 59
Figure 35: A FM of 1.2mm AA6111T4 fitted to GMM-clustered DIC measurements ... 60
Figure 36: A FM of 1.2mm AA6111T4 compared to FLCs calculated by established methods ... 60
Figure 37: A FM of 1.5mm NG5754O fitted to GMM-clustered DIC measurements... 61
Figure 38: A FM of 1.5mm NG5754O compared to FLCs calculated by established methods ... 61
Figure 39: A FM of 0.9mm DP600 fitted to GMM-clustered DIC measurements ... 62
Figure 40: A FM of 0.9mm DP600 compared to FLCs calculated by established methods ... 62
Figure 41: A FM of 1.6mm DP600 fitted to GMM-clustered DIC measurements ... 63
Figure 42: A FM of 1.6mm DP600 compared to FLCs calculated by established methods ... 63
Figure 43: A FM of 0.9mm MS3 fitted to GMM-clustered DIC measurements ... 64
viii Figure 45: Rate of separation of GMM components fitted to the strain history of a sample of 0.9mm MS3 subject to uniaxial tension deformation ... 65
Figure 46: Defects recorded in the production of a rear fender outer ... 68
Figure 47: (a) Feasibility assessment made using the original FLC, and (b) results superimposed on the simulated panel ... 69
Figure 48: (a) Feasibility assessment made using the Formability Map, and (b) results superimposed on the simulated panel ... 70
Figure 49: Draw die used to manufacture the rear fender outer, highlighting features responsible for splits in the drawn shell ... 72
Figure 50: Example of a nonlinear strain path) taken by an element in the drawing operation of the rear fender outer ... 74
Figure 51: Schematic of the specimen hypothesised in the M-K model (image obtained from Marciniak et al. (2002)) ... 76
Figure 52: Principal stresses in regions A and B at yield ... 77
Figure 53: (a) Strain vectors at yield for the uniform and imperfection regions, (b) subsequent yield curves for regions A and B after strain increment ... 78
Figure 54: Initial and final yield curves of the M-K model, highlighting the differences in strain ratios at failure ... 78
Figure 55: Alternative M-K specimen based on surface roughening (image adapted from Gronostajski & Zimniak (1992))... 79
Figure 56: Strain paths predicted by the modified M-K model for AA6111T4 ... 83
Figure 57: Marciniak-Kuckzynski predictions using the extension proposed by Gronostajski & Zimniak (1992) compared to (a-d) the Formability Maps, and (e-h) ISO-derived limit strains ... 84
Figure 58: Schematic illustration made by Wittridge & Knutsen (1999) showing (a) the occurrence of R-component colonies within a cube matrix aligned perpendicular to the tensile load, (b) initial development of surface roughening, (c) linking of valleys to form continuous bands, (d) macroscopic phase leading to strain localisation through the specimen thickness ... 87
ix
L
IST OF
T
ABLES
Table 1: Achievable reductions in CO2 emissions through direct and indirect weight saving, calculated
by the European Aluminium Association (2013) ... 2
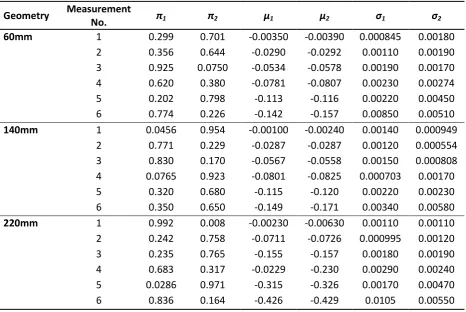
Table 2: GMM model parameters fitted to selected DIC measurements of 1.2mm AA6111T4 ... 50
Table 3: Linear regression results for an FLB fitted to limit strains of 1.2mm AA6111T4 ... 57
Table 4: Optimised logistic regression model fitted to DIC measurements of 0.93mm AA6111T4 ... 59
Table 5: Optimised logistic regression model fitted to DIC measurements of 1.2mm AA6111T4 ... 60
Table 6: Optimised logistic regression model fitted to DIC measurements of 1.5mm NG5754O ... 61
Table 7: Optimised logistic regression model fitted to DIC measurements of 0.9mm DP600 ... 62
Table 8: Optimised logistic regression model fitted to DIC measurements of 1.6mm DP600 ... 63
Table 9: Optimised logistic regression model fitted to DIC measurements of 0.93mm MS3 ... 64
Table 10: Estimated costs to change the die designs of the rear fender outer ... 73
Table 11: Parameters used to describe strain hardening behaviour of tested materials ... 80
x
G
LOSSARY
A
CRONYMSANOVA Analysis of Variance BCC Body Centre Cubic BiW Body-in-White
CCD Charge-Coupled Device CGA Circle Grid Analysis DIC Digital Image Correlation
EBSD Electron Back-Scatter Diffraction EDA Exploratory Data Analysis EM Expectation Maximization
EU European Union
FCC Face Centre Cubic FLB Forming Limit Band FLC Forming Limit Curve
FLC0 Major limit strain in plane strain FLD Forming Limit Diagram
FLSC Forming Limit Stress Curve
FM Formability Map
GMM Gaussian Mixture Model HCP Hexagonal Close Packed
ISO International Organization for Standardization KDE Kernel Density Estimation
M-K FLC prediction model developed by Marciniak & Kuczyński (1967) MKG Strain analysis technique of Merklein et al. (2010)
NEDC New European Driving Cycle PDF Probability Density Function PLC Portevin-Le-Chatelier effect SEM Scanning Electron Microscopy
VH Strain analysis technique of Volk & Hora (2010) WMG Warwick Manufacturing Group
M
ATHEMATICALS
YMBOLSPlasticity Modelling
𝜎0 Initial yield stress
𝜎𝑠𝑎𝑡 Stress at hardening curve saturation point
𝜎𝑏 Stress in equibiaxial tension
𝜎𝑖 Principal stress, where i = 1, 2, 3
𝜎𝑝 Stress in plane strain
𝜎 Flow stress
𝜀 Equivalent strain
xi
𝜀𝑖 Principal strain, where i = 1, 2, 3
𝜀𝑖∗ Principal limit strain
𝜌 Strain path
𝐾 Strength coefficient in power law hardening models
∆𝑅 Planar anisotropy
𝑅 Normal anisotropy
𝑅𝑖 Anisotropy at angle to rolling direction, where i = 0°, 45°, 90°
𝑅′ Surface roughness
𝑅′𝑚𝑎𝑥 Maximum surface roughness
𝛼, 𝑝 Dimensionless, material-dependent constants in Voce (1948) and Hockett & Sherby
(1975) hardening models
𝑃 Parameter to determine sharpness of yield curve, as proposed by Barlat (1987)
𝜃 Angular parameter to determine sharpness of yield curves, as proposed by Friedman & Pan (2000)
𝑑 Average grain diameter
𝑓0 Initial heterogeneity coefficient of M-K model
𝑓 Heterogeneity coefficient of M-K model
𝑚 Strain rate hardening exponent
𝑛 Strain hardening exponent
𝑡0𝑎,𝑏 Initial thickness in regions A and B of the M-K specimen
𝑡𝑎,𝑏 Thickness of regions A and B of the M-K specimen
φ Angle of imperfection in the M-K specimen
Statistical Modelling
𝜋𝑘 Mixture weight, where k = 1, 2
𝜎2 Variance of a population
𝜇 Mean of a population
𝜎 Standard deviation of a population
𝜗 Vector of parameter defining a PDF
𝑎, 𝑏, 𝑐, 𝑑, 𝑒 Coefficients fitted to logistic regression models
𝑎̂, 𝑐̂, 𝑑̂ Regression coefficients estimated using maximum likelihood
𝑐 Experimentally derived constant relating surface roughness to grain size
𝑔𝑘 GMM component denotation, where k = 1, 2
𝑛 Number of observations (in statistical models)
𝑦 Response variable in a linear regression model
𝑧 Response variable in a logistic regression model
𝐸 Model error
𝑁 Gaussian distribution function
𝑃𝑖 Probability of observing an outcome i
1
1
I
NTRODUCTION
1.1
T
HEM
OTORI
NDUSTRY IN2014
New car buyers in 2014 have high expectations surrounding the capability and flexibility of their prospective purchase. Whereas previous generations of vehicle enticed potential owners through safety and reliability accolades, these traits have now become expected characteristics in the modern vehicle. Manufacturers have gravitated towards offering vehicles styled at the forefront of the latest fashion, incorporating the latest technological and infotainment innovations, and providing the flexibility to specify an array of personalised options to attract customers.
The addition of personalised options such as air conditioning units, heated seats, and surround sound audio systems increases a vehicle's weight. Over the past decade the widening variety of available options, in conjunction with advances in occupant safety structures, has caused vehicles’ weights to increase. Statistics compiled in a report by the European Commission (2013) demonstrate that the gross weight of the average passenger vehicle sold in Europe has increased from 1696kg in 2001 to 1864kg in 2012. To ensure that dynamic performance is not compromised, the same report demonstrates the power of the average passenger vehicle sold in Europe has risen from 74KW in 2001 to 89KW in 2012.
Modern vehicle design is influenced by factors over and above specifications defined by safety legislation and consumer trends. A developing influence in recent years has been the impact of vehicles on the environment. Greater awareness has resulted in vehicle manufacturers becoming increasingly accountable for the environmental impact of a vehicle over its life cycle. The Kyoto protocol (1998) is regarded as the catalyst for this change, where 191 countries signed an agreement to reduce their respective greenhouse gas emissions. As one of the primary causes of greenhouse gases, the constituents of tailpipes emissions have become subjected to increasingly stringent legislature.
The European Union (EU) regulates tailpipe emissions through a dedicated directive. In 1992, EURO I was introduced to govern the amount of gases including carbon dioxide, hydrocarbons, and nitrogen oxides which can be emitted by new passenger vehicles. The directive is now in its sixth iteration (EURO VI). The acceptable level of each gas has incrementally decreased in each directive to mirror the desire to continually reduce global greenhouse gas emissions. A further driver was introduced in 2012 in the form of a financial penalty system. Vehicle manufacturers whose European fleet average exceeds the EU carbon dioxide target are penalised for each vehicle sold. The fleet average target for 2007 was 158.7g/km. This target will reduce to 130g/km by 2015, and to 90g/km by 2021. Penalties are imposed on an incremental scale, depending on how far targets are exceeded. Currently, if the fleet average is 1g/km over target the manufacturer is penalised €5 per vehicle. For every subsequent g/km over target the severity of the penalty increases. In 2019 the penalty system will change such that manufacturers will incur a penalty of €95 for every g/km of above the threshold.
2
Figure 1: Roadmap for technology improvement proposed in 2009 by the Department for Business Innovation and Skills
(2009)
The roadmap anticipates that weight reduction will consistently feature in vehicle technology development over the coming decades. Vehicle weight reduction through the application of lightweight materials and technologies has a positive effect on fuel saving. Fuel saving is achieved through the direct and indirect effects of weight reduction. The European Aluminium Association
(2013) define the savings benefits as follows:
Direct weight saving: Weight saving arising from replacing a heavier material with a lighter material in one or several components
Indirect weight saving: Weight saving from downsizing components (e.g. engine, suspension) while retaining vehicle performance as a result of direct weight loss elsewhere on the vehicle
Primary fuel saving: Fuel saved from the lower energy demand required to move a vehicle of reduced weight
Secondary fuel saving: Additional fuel saving obtained by optimising a downsized powertrain system to deliver performance equal to that of the original vehicle
Not only does fuel saving benefit the customer by reducing running costs, it also minimises the vehicle's environmental impact. CO2 emission benefits obtainable through weight and fuel saving have been calculated by the European Aluminium Association (2013) and are demonstrated in Table 1. These figures are based on simulations of a 2009 VW Golf 1.4 TSI being driven according to the New European Driving Cycle (NEDC) presented by Koffler & Rohde-Brandenburger (2009).
Direct Weight Savings (100kg)
Direct + Indirect Weight Savings (150kg)
Primary Fuel Savings 3.6g/km 5.4g/km
[image:16.595.100.495.71.312.2]Primary + Secondary Fuel Savings 8.4g/km 12.7g/km
Table 1: Achievable reductions in CO2 emissions through direct and indirect weight saving, calculated by the European
3 The scope of this research concerns the development and implementation of lightweight materials and technologies. Specifically, this project is focussed on direct weight saving opportunities that are exploitable in car bodies.
1.2
M
ATERIALS
ELECTION INC
ARB
ODIESThe Body-in-White (BiW) represents around 20% of a car's total weight. It is an ideal candidate to implement and realise direct weight saving. The BiW is the skeletal structure of the car, consisting predominantly of sheet metal components. Components are broadly categorised as either structural or skin panels. Structural panels (e.g. pillars, door and roof inners) form the internal structure of the body, providing body integrity and contributing to occupant safety. Skin panels (e.g. doors, fenders) are the external parts which enable cabin access and provide the vehicle's major aesthetic features.
Appropriate material selection is critical to ensure each component (and, subsequently, the vehicle) meets design intent. Structural panels require a high strength material to be able to support the weight of other systems within the vehicle and provide ideal crash deformation characteristics. Skin panel materials require high levels of formability to meet complex styling features whilst also resisting environmental degradation. Coated mild steels satisfy these requirements, and have been used to manufacture both types of panel.
The environmental demands discussed in Section 1.1 have focussed automotive manufacturers on substituting mild steel with alternative, lightweight materials - in particular aluminium alloys and high strength steels. Aluminium alloys enable weight saving by offering strengths similar to those of mild steels, but at 1/3rd the density. High strength steels are capable of supporting higher design loads through smaller cross-sectional areas. In recognition of the direct weight saving opportunities offered by these materials, the past decade has seen the contribution of both aluminium alloys and high strength steels in BiW manufacture increase. Jaguar Land Rover has been particularly prominent in integrating new materials into the BiW structure. The 2013 model Range Rover has over 80% of the BiW made of aluminium and high strength steel contributing towards a vehicle weight saving of ≈400kg over the previous incarnation.
1.3
S
HEETM
ETALF
ORMINGBiW panels are predominantly manufactured through stamping operations. A stamping toolset comprises a unique punch and die combination, with a sheet metal blank positioned at the interface. Forcing the punch and blank into the die cavity stretches the centre of the blank over the punch face, and draws the neighbouring region along the die wall and into the cavity. When the blank has been sufficiently plastically deformed, the blank retains the geometrical features of the die.
1.3.1 Formability
4 of the sheet. Significant localised thinning reduces the sheet's load bearing ability, thereby instigating a split or tear. This critical damage mechanism is referred to as localised necking. Within the automotive industry, the onset of localised necking is the practical limit of formability.
1.3.2 The Forming Limit Curve
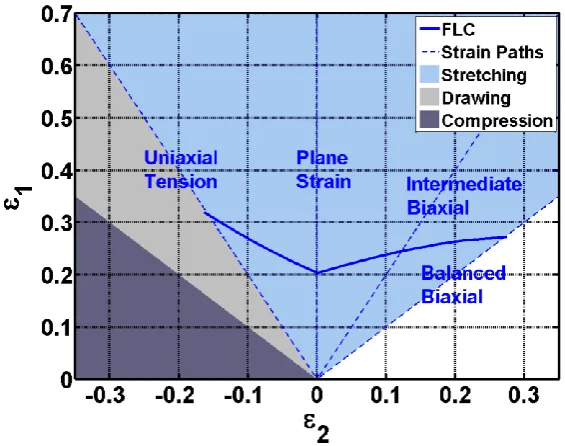
The Forming Limit Curve (FLC), shown in Figure 2, marks the onset of localised necking in sheet material over a range of strain paths. Since its conceptualisation by Keeler (1961) and Goodwin
[image:18.595.146.429.232.455.2](1968), the FLC has become an almost ubiquitous formability criterion for analysing stretching operations. It is used for material selection, stamping simulation feasibility studies, and for tooling buy-off.
Figure 2: The Forming Limit Curve demonstrating relevant strain paths and forming modes
Each combination of material, thickness, and temper has a unique FLC. The height of the FLC provides a general indication of formability. Forming grade mild steels have high formability, reflected by their high FLCs. Lightweight materials such as aluminium alloys and high strength steels have low formability, as characterised by lower height FLCs.
1.3.3 Manufacturing Risk
At Jaguar Land Rover, the Stamping Engineering department are responsible for the design, development, and delivery of safe and robust stamping processes. Early risk identification and resolution during simulation feasibility studies reduces the likelihood of performing costly remedial work (e.g. design changes, tool re-cutting) on physical toolsets. Whilst FLCs aid design feasibility, there is uncertainty concerning their position and shape on the Forming Limit Diagram (FLD).
5
[image:19.595.76.517.272.716.2](a) (b)
Figure 3: FLDs showing the typical experimental scatter of limit strains of (a) 0.9mm DP600 and (b) 1.2mm AA6111T4
(a) (b)
(c)
6 A further uncertainty forming engineers must contend with is the sensitivity of forming limits to both the mechanical property variation which naturally occurs in sheet metal production, and to the loading conditions imposed by the stamping die. Small changes to mechanical properties, and/or any non-proportional loading conditions that occur in the stamping operation, can substantially impact both the shape and level of the FLC. To overcome the uncertainties associated with defining the FLC and the sensitivity of the FLC to inherent production conditions, a measure of risk mitigation is necessary. A popular technique is to apply a safety margin to the FLC. The safety margin is a curve positioned at a fixed major strain below the FLC. The FLC and safety margin partition the FLD into three regions: 1) safe region – area beneath the safety margin; 2) marginal region – area between the safety margin and the FLC; 3) failed region – area above the FLC. Surface strains which reside in the safe region are considered robust to failure; strains in the marginal region are considered to have a risk of failure; and strains in the failed region are considered to almost certainly cause a defect. Figure 4 shows the FLC and safety margin, together with an overlay of surface strains simulated on a drawn shell.
1.4
M
OTIVATIONReduced formability of lightweight materials, as characterised by the FLC, constrains the level of styling freedom and design flexibility available to part stylists and tool designers. To minimise the restrictions of lightweight materials, it is desirable to maximise the amount of formability utilised without exposing the manufacturing process to unnecessary risk. This requires accurate characterisation of material formability and accurate compensation of risks to formability. The current practice of characterising formability with an FLC and minimising risk through a safety margin is a barrier to safely maximising formability.
The safety margin is intended to mitigate against three risks of forming failure: 1) the risk that the FLC is not reflective of a material's true formability; 2) the risk that intrinsic mechanical property between blanks cause formability variation between panels; and 3) the risk that conditions imposed by the stamping operation itself cause premature failure. The contribution of each risk towards the overall “formability risk” has not been quantified. Summarising these risks in a single safety margin prevents forming engineers from accurately quantifying the risk of failure. This restriction is particularly pertinent to situations where a forming simulation predicts a panel’s surface strains fall inside the marginal region.
If a forming simulation identifies that strains on a stamped panel fall within the marginal region, remedial actions must be agreed by both design and manufacturing engineers. Design engineers are responsible for styling aesthetically attractive panels to enhance vehicle appeal to a broad range of customers. Reducing styling freedom through the application of a safety margin leads to aesthetically less desirable vehicles (reduced market appeal), higher panel count (increased cost of manufacture and assembly) and thicker/heavier material selection (increased vehicle weight). To increase the likelihood of meeting a design brief, styling engineers are more ready to accept surface strains which fall into the marginal region. By contrast, manufacturing engineers are responsible for producing high quality panels using repeatable and reliable production processes. Repeatability and reliability is achieved by reducing the risk of manufacturing defective panels. Manufacturing engineers are therefore less ready to accept surface strains which fall into the marginal region. Conflicts of interest between engineers lead to disputes when determining remedial actions for stamping tools producing panels with surface strains in the marginal zone.
7 precisely quantified. The scatter arising from experimental measurements, and the subsequent characterisation of limit strains by an FLC, are the primary barriers for accurately describing material formability. The sources of limit strain scatter must be identified and addressed. A more precise and objective method of characterising these limit strains must also be developed. Until formability is accurately measured and precisely characterised, the risks to formability arising from mechanical property variation or the stamping operation itself cannot be accurately quantified.
1.5
C
ONCLUSIONS The scatter arising from experimental tests implies there is uncertainty about the accuracy of formability measurement
There is uncertainty about the precision of the FLC, due to the freedom available to interpret the shape and position of the curve within scattered limit strains
Formability is known to be sensitive to natural variation in mechanical properties, and to the deformation conditions imposed by industrial stamping operations. The safety margin is a subjective simplification of the risks posed to formability
The aim of this Engineering Doctorate is to understand and characterise the uncertainty in scattered limit strains, and develop a more accurate and precise method for determining and representing formability.
1.6
R
ESEARCHM
ETHODOLOGY ANDI
NNOVATIONR
EPORTS
TRUCTURE1.6.1 Research Methodology
This innovation report is structured to follow the progress of the Engineering Doctorate and the portfolio submissions. The author’s Engineering Doctorate portfolio comprises five submissions, in addition to this innovation report. These submissions were written chronologically, in the structure outlined in Figure 5, consistent with the research methodology that was followed.
[image:21.595.75.516.475.764.2]
Figure 5: Engineering Doctorate portfolio structure
Submission 1:
Forming Limit Curves at Jaguar Land Rover
Problem Identification
Submission 2:
Determining and Representing Formability - A Critical Review
Submission 3:
Solution Exploring the Uncertainty of Forming Limit Strains
Identification
Submission 4:
A New Statistical Method for Determining and Representing Formability
Solution Development
and Application Submission 5:
Application of a Formability Map Derived from Gaussian Mixture Modelling
v
v
8 Firstly, there was a need to identify and understand the problems facing the industrial sponsor. This was completed in two separate reviews. The focus of the first review, documented in Submission 1, was to identify external factors which influence the construction of a modern passenger vehicle. This was completed using publicly available European Union directives; government-issued investigations; and drawing upon the knowledge and experiences of Jaguar Land Rover and Tier 1 material suppliers. The information captured was used to contextualise industrial concerns with current formability assessment techniques, and define the research aim.
The second review, documented in Submission 2, was conducted to examine the current state of the art with respect to sheet metal formability. This was completed using secondary information sources including peer reviewed journals, conference proceedings, books, and the internet. Knowledge gained from the literature was also supplemented by primary experimentation. The main focus of the review was to identify limitations with current measurement techniques that cause ambiguity in formability measurement. As such, the review covers the essential requirements for experimentally measuring and representing formability, and discusses the influence of both the material and the stamping process on forming limits.
Submission 3 documents three investigations that were carried out to verify the inferences made from the literature review, and identify a solution to fulfil the research aim. The aim of the first investigation was to establish the systematic error of a strain measurement instrument. This was achieved by making zero-strain measurements of different shaped specimens using a DIC-system, and analysing the results using an ANOVA. The aim of the second investigation was to confirm whether surface strain behaviour identified in the literature was visible during standardised formability tests. This was achieved by creating a MATLAB tool to visualise strains measured by the DIC instrument independently of the specimen’s geometry. The aim of the third investigation was to verify that the scatter typifying measured limit strains is caused by the method used to identify and characterise a localised neck. This was achieved by performing a series of Marciniak tests for a broad range of automotive alloys. Measured strains were analysed with respect to the ISO-standard method as well as a selection of alternative methods identified from the literature.
The primary research of the Engineering Doctorate was carried out in Submission 4 where a solution was developed to fulfil the research aim. A new method for determining and representing formability was developed using a statistical modelling methodology. Exploratory data analysis was used to demonstrate the existence of statistical patterns and trends on the surface of a specimen undergoing a formability test. An innovative parametric model was constructed to quantify this behaviour, and relate statistical behaviours to the physical behaviour of materials. The model was subsequently used to perform the tasks necessary to objectively determine formability, and overcome the limitations of the current method. The utility of the new method was verified by measuring the formability of a broad range of automotive alloys, and benchmarking the results against standardised forming limits. Finally, a complimentary regression model was used to create an objectively positioned, probabilistic forming limit criterion to provide the more precise representation of formability required to fulfil the research aim.
9 1.6.2 Innovation Report Structure
This innovation report has been structured in such a way as to guide the reader through the topic and highlight the most important aspects of measuring and interpreting formability. The report begins with a background section which covers the primary aspects of this field, and then describes the underlying principles of the research methodology and highlights of the research. The main focus of the research is the determination and representation of formability. This report documents the methodical and rigorous research undertaken which has led to the development of an innovative experimental methodology for deriving a forming limit criterion. It describes the key innovations in detail before demonstrating the utility of the new criterion in an industrial formability study. Subsequently, it describes a phenomenological model used to predict features of the new criterion from mechanical properties, and discusses the underlying material structures that must be considered to obtain an accurate prediction. Finally, it summarises the project and discusses area for future work.
Chapter 2 presents the background of the project, including a review of the FLC concept. A critical assessment of the current state-of-the-art techniques for measuring formability is performed. This is accompanied by a review of secondary literature to understand the effects of mechanical properties and stamping conditions on formability. A discussion on how these features impact the assessment of an industrial panel is also provided. This chapter concludes by recognising the key requirements for accurate and precise measurement of a localised neck, and identifies a methodology for developing a new method to overcome the restrictions of the ISO-standard and alternative methods which prohibit this measurement.
Chapter 3 documents the main innovations created in this research. The chronological development of a new holistic statistical methodology for determining and representing formability is described which overcomes the limitations identified with established methods. It starts with a fundamental statistical analysis of strains measured during the course of formability tests. This leads to the discovery of a series of statistical trends common to both aluminium alloys and steels. An appropriate model is selected to quantify these trends, and correlate these trends to the physical behaviour of deformed specimens. The utility of the statistical model is then extended to perform the key stages of formability measurement: the identification of a neck’s location; the identification of the onset of localised necking from within a DIC-measured strain history; and the characterisation of the neck itself. The new method is used to measure the formability of a selection of automotive-grade sheet metals, with the results compared to limit strains obtained using the ISO-standard method. The remainder of the chapter describes the application of a regression model to translate experimental measurements into a practical, probabilistic representation of formability, which is benchmarked against the conventional FLC.
Chapter 4 describes the utility of performing a design feasibility assessment using the statistical formability criterion. An industrial panel is considered, selected by the industrial sponsor, which is assessed using two techniques: the conventional FLC technique; and the new criterion developed in this research. It is shown how the additional precision afforded by the new technique provides a more objective measure of the risk of failure for the panel, and in the case considered, cost avoidance for the industrial sponsor. The chapter then highlights the hurdles that need to be overcome in order to gain a complete and accurate measure of the risk of failure for an automotive panel.
10 limit strains. A discussion is included on the unique microstructures of the analysed materials that are responsible for the character of the DIC measurements, and that should be considered to improve the quality of the predictions.
11
2
R
ESEARCH
B
ACKGROUND
In order to identify the origins of scattered limit strains, a review of the published literature is conducted. The review focusses on four areas:
Methods of determining formability – Best practice methods for experimentally determining formability are evaluated to identify sources of uncertainty in formability measurement Influence of mechanical properties on formability – The impact of mechanical properties on
formability is examined to understand likely formability variation between tested specimens Techniques for characterising formability – Alternatives to the FLC are sought to more
precisely characterise strain behaviour at the forming limit
Influence of strain path non-linearity on formability – A significant discrepancy between formability characterised in the laboratory and the formability achievable in the press shop arises because of the influence of non-proportional loading. Understanding the impact of strain path changes, caused by non-proportional loading, on formability is helpful to determine the effectiveness of the safety margin in mitigating the risk to formability caused by the stamping operation
2.1
D
ETERMININGF
ORMABILITYFormability is determined through a set of controlled experiments. For consistency and repeatability, a standardised method for determining forming limits in the laboratory is prescribed by ISO12004-2
(2008). Three principal aspects are considered in the standard: 1) the test method used to deform material specimens, 2) the measurement technique used to record deformation, and 3) the measurement of the localised neck. The techniques prescribed by the standard are discussed herein.
2.1.1 Tests for Determining Formability
ISO12004-2 describes two test methods: a method outlined by Nakazima et al. (1971) and a method outlined by Marciniak (1967). Figure 6 shows the tooling schematics of the two methods. Both apparatus deform waisted blanks over a 100mm diameter punch with an open cylindrical die. Adjusting the waists of the test specimens gives rise to different proportional loading conditions, resulting in different strain paths. The primary difference between the methods is the hemispherical punch face prescribed by the Nakazima method and the flat-bottomed punch face prescribed by the Marciniak method.
(a) (b)
Figure 6: Schematics of tools used in (a) the Nakazima method, and (b) the Marciniak method
12 interface (labelled 1 in Figure 6a). Friction is negated between the Marciniak punch and the test specimen through the inclusion of a sacrificial carrier blank. Carrier blanks are sacrificial specimens manufactured to the same geometry as the test specimen, with the inclusion of a 32-34mm diameter hole machined at the centre. To avoid premature failure, carrier blanks are made from material more ductile than the test material. Unlike the Nakazima test where the tooling geometry causes out-of-plane straining, inclusion of the carrier blank in the Marciniak test promotes in-plane straining in the area of the specimen located above the hole.
Both punch-stretching tests described in ISO12004-2 use dedicated tooling and apparatus. Extensive availability of tensile test apparatus has motivated researchers to develop alternative test methods for determining formability. Priadi et al. (1992) designed five 300mm length rectangular specimens of variable widths and notch sizes capable of replicating strain paths between uniaxial tension and plane strain. Limit strains measured for a mild steel closely resembled those obtained by the conventional Nakazima method. Independently, Holmberg et al. (2004) designed notched specimens of different lengths, widths, and notch sizes. Limit strains obtained for a mild steel and a high strength steel were lower than those obtained by the Nakazima method.
The prevalence of hydraulic bulge testing equipment has led researchers to adapt existing apparatus to characterise formability. Lazarescu et al. (2012) manufactured a toolset where the bulging aperture is elliptical, rather than circular. Varying the ellipticity ratio of the aperture between 1 and 0.4 invoked strain paths ranging from equibiaxial tension to (close to) plane strain. Banabic et al.
(2013) kept a regular circular aperture, instead designing a series of double-skinned test specimens. The outer test specimen has two off-centre holes, with the inner test specimen manufactured from material at least as ductile as the test piece. The position and ellipticity of the holes dictated the strain path achieved in the centre of the outer specimen. Limit strains of AA6111T4 measured using the method of Banabic et al. (2013) were consistently lower than those obtained by the standardised Nakazima test.
The inability of the identified tensile test adaptations to generate biaxial straining conditions limits their capability to conduct conclusive formability studies. By the same rationale, the inability of the method prescribed by Lazarescu et al. (2012) to generate uniaxial straining conditions also restricts its application. For the purpose of formability characterisation, the Nakazima and Marciniak methods offer the most favourable conditions.
According to Abspoel et al. (2011) the Nakazima method is the more widely adopted. However, practical experience and published research raises concerns that the Nakazima punch geometry causes deformation conditions which prohibit accurate formability characterisation.
The first concern surrounds the impact of friction. Frictional interaction between the Nakazima punch and test specimen impacts the distribution of strains on the test specimen, initiating off-apex failure or causing deviation from the designed-for strain path. Despite the inclusion of a tribological stack between the punch and the specimen, practical experience has shown that a completely frictionless situation is rarely achieved. Surface strain distributions of samples deformed with a Nakazima punch, such as those displayed in Figure 7, are regularly characterised by a double strain concentration around the apex of the punch. Occurrence of such a distribution during localised necking introduces an uncertainty when locating and measuring the localised neck.
13 assumed that the failure occurs uniformly through the material thickness, enabling the failure mode to be characterised from both faces of the specimen. However, non-planar stress states – such as those caused by the Nakazima punch – cause out-of-plane straining. The resulting through-thickness strain gradient affects the manifestation of the localised neck. Morales et al. (2009) observed that initiation of a neck on the more-deformed outer face does not induce an overall instability. Morales concluded that as a result of out-of-plane straining, localised necking is suppressed by less-deformed material in the bulk of the sheet. Tharrett & Stoughton (2003) proposed that to characterise the formability of materials subjected to non-planar stress states, it is necessary to measure to onset of localised necking at the inner face. Consequently, formability characterisation is limited when strain measurements are constrained to the outer specimen face.
Figure 7: A "double peak" in the major strain distribution of a HXT600X specimen deformed by Merklein et al. (2010)
using Nakazima tooling
The final concern surrounds the ability of the Nakazima method to maintain proportional deformation. Initial contact between punch and test specimen (regardless of specimen geometry) results in biaxial straining. Only when punch and specimen are in full contact is the designed-for strain path realised. As a consequence of biaxial pre-straining, FLCs derived using Nakazima tests are characterised by a positive minor strain offset, as demonstrated in Figure 8.
Figure 8: FLCs demonstrating the strain paths generated by Marciniak and Nakazima tooling (Abspoel et al. (2013))
14 aluminium and steel respectively, using Nakazima and Marciniak tooling. Comparing the strain paths measured during the two tests demonstrates that biaxial pre-strain not only shifts FLC0 to the right, but also lowers the height of FLC0. Results also demonstrate the magnitude of pre-strain is a function of specimen width. By contrast, Abspoel et al. (2011) and Leppin et al. (2008) demonstrated that proportional deformation is preserved throughout Marciniak tests. Consequently, FLC0s of Marciniak FLCs are aligned to the y-axis and no “correction” is required.
In addition to preserving proportional deformation, the previous concerns with the Nakazima test do not affect specimens deformed by the Marciniak method. Firstly, inclusion of a carrier blank prohibits contact between the Marciniak punch and test specimens, entailing no frictional interaction between the two mediums and eliminating the non-uniform strain distribution that characterise the surfaces of Nakazima specimens. Secondly, the flat bottom of the Marciniak punch, combined with the carrier blank, ensures specimens are subject to planar stresses only. Specifically, planar stresses are realised in the area of the test specimen located above the carrier blank hole (known furthermore as the Zone of Evaluation). As a result, the impact of curvature or bending on forming limits measured by the Marciniak method is negligible.
2.1.2 Surface Strain Measurement
Surface strain measurement of sheet metals involves analysing a surface grid pattern and making a comparison between the pattern configuration before and after deformation. An assumption is made that each element in the grid deforms under planar conditions, with the third principal strain in the direction normal to the sheet surface. Assuming the material remains incompressible; an element’s principal strains are calculated directly from the distortion of the pattern. The geometrical changes of individual grid elements illustrate the distribution of both the magnitude and direction of strains over the sheet.
Precise and accurate strain measurements are required to measure the localised neck at the forming limit. Within ISO12004-2 two strain measurement techniques are described - an offline technique and an online technique. Offline techniques make strain measurements on specimens ex-situ, thereby constraining strain analysis to failed specimens, or specimens retrieved from an interrupted forming operation. Online techniques are capable of measuring the surface strains of specimens in-situ, enabling the entire strain history of a specimen to be measured.
Early research into sheet metal formability, including the pioneering researches of Keeler (1961) and Goodwin (1968), used the offline technique to measure surface strains. Both researchers etched a ≈5mm diameter circular grid on un-deformed specimens, and measured the grid distortion using Mylar tape. This technique is limited by the use of large diameter grids which can overlook certain characteristics of a localised neck. For example, the neighbourhood of a localised neck is often characterised by a sharp strain gradient, which can be smoothed within the boundary of a large grid. This reduces the ability to locate, and subsequently measure, the localised neck. Banabic (2010) cites
Grumbach & Sanz (1972) who studied the influence of the grid diameter on forming strains. Having analysed circle diameters between 0.5mm and 5mm, Grumbach & Sanz (1972) concluded the circle diameter has a strong influence on strains measured in the direction of the strain gradient.
15 deformation, Sowerby et al. demonstrated that adopting a quadrilateral grid pattern overcomes the resolution limitation of circular grids, and provides total coverage of test specimens. ISO12004-2 prescribes a maximum grid size of ISO12004-2.5x material thickness to ensure the development of a neck is adequately captured, with grid sizes between 1mm and 2mm typically used for formability characterisation.
A critical limitation of offline grid analysis is that only the final strain state is measured. The route by which the final strain state was reached cannot be obtained. Plasticity theory dictates that strain increments can only be integrated under proportional loading conditions. The Nakazima test and the majority of stamping operations are known to induce non-proportional loading. Therefore, the examination of formability using offline measurements is limited.
Continuous recording provided by online measurement techniques generates high quantity, high resolution images. These images enable strain increments to be calculated over the course of the test. Vacher et al. (1999) used a single camera to track in-plane deformation of a Marciniak sample. The strain measurement history was interrogated to identify the localised neck, and construct an FLC. A further development in the research of Vacher et al. (1999) was the use of a stochastic surface pattern as opposed to a regular grid. Imaging software was used to discretise the stochastic pattern into a quadrilateral grid, with each grid element having unique grey-level values. Cross-correlation was used to track the motion and distortion of the grid by matching each element’s grey-levels between successive images. Advantages of using a stochastic pattern over a regular grid include the simple method for generating and applying the pattern, and an achievable sub-1mm resolution.
Continuous recording using a single camera is only able to capture to distortion of specimens subject to in-plane deformation and no rigid-body motion. To overcome this limitation, Geiger & Merklein
(2003) used two CCD cameras to simultaneously record deformation of a specimen stretched over a Nakazima punch. A stochastic pattern was applied to the specimen, and the method of Vacher et al.
(1999) was used to discretise the pattern into a grid of 0.9mm x 0.9mm elements. An FLC of H360LA was subsequently drawn from the strain measurements.
In recent years, automated optical strain measurement has become almost ubiquitous in formability research. Commercial systems include ARAMIS by GOM mbH (2012), AutoGrid by ViALUX GmbH
(2012), and Q400 by Dantec (2014). The ARAMIS system is available within WMG for use in this research project. A comprehensive measurement-error investigation of the instrument was conducted as part of this research, where the influence of both internal and external factors on measurement accuracy was calculated. Results showed that the measurement error of the ARAMIS system is negligible compared to the magnitude of likely forming limit strains, and not significantly influenced by the identified internal and external factors. For further information the reader is directed towards Submission 3 where this investigation is reported in full.
2.1.3 Determining Formability
16 a locus on the specimen three circles in width adjacent to the fracture. The limit strain was interpreted as the average strain of circles within the locus. Each of these methods requires a manual interpretation of strain measurements. For a high-density grid pattern, manual assessment is both time consuming and subjective.
Later determination methods focus upon estimating strain behaviour at the onset of necking.
Bragard et al. (1972) proposed a method whereby a cross-sectional profile is drawn through a fractured specimen, perpendicular to fracture. Strains on the profile are subjectively classified as being either inside or outside the failure area. To estimate the strain profile at the onset of localised necking, a parabolic regression curve is fitted to strains judged to be outside the failure area. The limit strain is taken as the maximum point on the regression curve.
The quality of the regression curve fit used by Bragard et al. (1972) is sensitive to both the resolution of the strain grid and the classification of strains along the profile. To overcome this sensitivity, an improved method was proposed by D’Hayer & Bragard (1975). Known as the "double-profile" method, a second strain profile is drawn on the specimens at the onset of fracture. Overlaying strain profiles obtained at the onset of, and at, fracture enables strain measurements common to both profiles to be identified. Performing regression on these common measurements removes the subjectivity with the manual strain classification required by the method of Bragard et al. (1972).
Strain profile analysis is advocated in ISO12004-2 for limit strain determination. A single strain profile is extracted from either a fractured sample (if only offline measurement is available) or at the onset of fracture (if online measurement is available). The strain profile is drawn manually, as per the methods of Bragard et al. (1972) and D’Hayer & Bragard (1975). The profile is then differentiated to magnify the strain gradient in the neighbourhood of the neck, enabling the neck to be more objectively located within the profile. The slope of the differentiated profile is used to identify a "forming window" - strains which are not used during subsequent regression. An inverse second-order polynomial is fitted to ten measurements either side of the forming window to estimate the strain profile at the onset of localised necking. The limit strain is taken from the peak of the polynomial curve. Hotz & Timm (2008) report that limit strains obtained by this method are repeatable between laboratories.
Despite enabling limit strains to be repeatedly calculated, the standardised "position-dependent" method of limit strain determination has limitations. Firstly, it is assumed that the strain profile at the onset of localised necking conforms to a second-order polynomial, as shown in Figure 9a. Several scenarios may occur where this assumption is invalid. For example, Zhang & Wang (2012) observed multiple competing necks during the deformation of DP600. This phenomenon was also observed during biaxial deformation of a DP600 specimen (Figure 8 in Submission 2). In these examples, neither the strain profile at fracture nor at the onset of fracture conforms to a second-order polynomial. Likewise, the strain distribution of a Nakazima specimen is regularly characterised by a double strain concentration (Figure 7), as described in Section 2.1.1. The strain profile of such a specimen is also characterised by a twin-peaked strain profile (shown in Figure 9b) signifying non-conformance to the assumptions made in ISO12004-2.
17
[image:31.595.79.521.68.272.2](a) (b)
Figure 9: Major strain profiles (upper outline in (a) and (b)) and minor strain profiles (lower outline in (a) and (b)) drawn across two Nakazima specimens, where (a) demonstrates a specimen conforming closely to a second-order polynomial, and (b) a specimen poorly conforming to a second-order polynomial
Vacher et al. (1999) observed that localised necking in mild steel is a gradual process, and that the onset of localised necking may occur early in a formability test. Through visual inspection of successive DIC measurements, Vacher et al. observed the temporal and spatial characteristics of the measured strain and strain rate fields. According to Vacher et al., the onset of necking occurs when the strain rate becomes concentrated in a small area of the strain field, and the strain rate of the remaining material tends to zero. The limit strain is then obtained from the preceding DIC measurement.
The approach of Vacher et al. (1999) was extended by Volk (2006) who introduced a more objective method of determining the onset of localised necking. Volk (2006) deformed a Nakazima specimen and measured deformation using a DIC system. Each DIC measurement was then assessed against two criteria. Firstly, elements within the measurement grid were categorised as those experiencing increasing or decreasing strain rate. Secondly, the magnitude of the strain rate changes were analysed over the course of the test. The onset of localised necking was determined from a sudden increase in the number of elements experiencing severe increases in strain rate (inside the neck) and a corresponding number of elements experiencing a reduction in strain rate (outside the neck).
Eberle et al. (2008) extended this principle by including an empirical frequency diagram to track the development of the distribution of strain rates, and more accurately determine the onset of localised necking.
More recently proposed "time-dependent" methods use time series analysis to determine the onset of localised necking. These methods track strains (or strain rates) in a small area of the localised neck, and use the evolving characteristics of the area to detect the onset of localised necking.
Merklein et al. (2010) constrained their analysis to a 2mm diameter circle in the centre of the localised neck. The mean major strain acceleration (𝜀1̈) within the circle was recorded and plotted
for each DIC measurement. Volk & Hora (2010) constrained their analysis to elements of the measurement grid that fall within 50% of the maximum measured thinning rate at the onset of fracture. The mean major thinning rate (𝜀3̇) within the area was recorded and plotted for each DIC
18 calculated using their method are comparable to those obtained using the standardised "position-dependent" method for HX260 and AA6016.
(a) (b)
Figure 10: Time series as calculated using the methods of (a) Merklein et al. (2010), and (b) Volk & Hora (2010)
(a)
(b)