A Thesis Submitted for the Degree of PhD at the University of Warwick
Permanent WRAP URL:
http://wrap.warwick.ac.uk/81399
Copyright and reuse:
This thesis is made available online and is protected by original copyright.
Please scroll down to view the document itself.
Please refer to the repository record for this item for information to help you to cite it.
Our policy information is available from the repository home page.
Library Declaration and Deposit Agreement
1. STUDENT DETAILS
Please complete the following:
Full name: ………. University ID number: ……….
2. THESIS DEPOSIT
2.1 Under your registration at the University, you are required to deposit your thesis with the University in BOTH hard copy and in digital format. The digital copy should normally be saved as a single pdf file.
2.2 The hard copy will be housed in the University Library. The digital copy will be deposited in the University’s Institutional Repository (WRAP). Unless otherwise indicated (see 2.6 below), this will be made immediately openly accessible on the Internet and will be supplied to the British Library to be made available online via its Electronic Theses Online Service (EThOS) service.
[At present, theses submitted for a Master’s degree by Research (MA, MSc, LLM, MS or MMedSci) are not being deposited in WRAP and not being made available via EthOS. This may change in future.]
2.3 In exceptional circumstances, the Chair of the Board of Graduate Studies may grant permission for an embargo to be placed on public access to the thesis in excess of two years. This must be
applied for when submitting the thesis for examination (further information is available in the
Guide to Examinations for Higher Degrees by Research.)
2.4 If you are depositing a thesis for a Master’s degree by Research, the options below only relate to
the hard copy thesis.
2.5 If your thesis contains material protected by third party copyright, you should consult with your department, and if appropriate, deposit an abridged hard and/or digital copy thesis.
2.6 Please tick one of the following options for the availability of your thesis (guidance is available in theGuide to Examinations for Higher Degrees by Research):
Both the hard and digital copy thesis can be made publicly available immediately
The hard copy thesis can be made publicly available immediately and the digital copy thesis can be made publicly available after a period of two years (should you subsequently wish to reduce the embargo period please inform the Library)
Both the hard and digital copy thesis can be made publicly available after a period of two years (should you subsequently wish to reduce the embargo period please inform the Library)
Both the hard copy and digital copy thesis can be made publicly available after _______________ (insert time period in excess of two years). This option requires the prior approval of the Chair of the Board of Graduate Studies (see 2.3 above)
The University encourages users of the Library to utilise theses as much as possible, and unless indicated below users will be able to photocopy your thesis.
I do not wish for my thesis to be photocopied
3. GRANTING OF NON-EXCLUSIVE RIGHTS
Whether I deposit my Work personally or through an assistant or other agent, I agree to the following:
Guannan Li
Rights granted to the University of Warwick and the British Library and the user of the thesis through this agreement are non-exclusive. I retain all rights in the thesis in its present version or future versions. I agree that the institutional repository administrators and the British Library or their agents may, without changing content, digitise and migrate the thesis to any medium or format for the purpose of future preservation and accessibility.
4. DECLARATIONS
I DECLARE THAT:
I am the author and owner of the copyright in the thesis and/or I have the authority of the authors and owners of the copyright in the thesis to make this agreement. Reproduction of any part of this thesis for teaching or in academic or other forms of publication is subject to the normal limitations on the use of copyrighted materials and to the proper and full acknowledgement of its source.
The digital version of the thesis I am supplying is either the same version as the final, hard-bound copy submitted in completion of my degree once any minor corrections have been completed, or is an abridged version (see 2.5 above).
I have exercised reasonable care to ensure that the thesis is original, and does not to the best of my knowledge break any UK law or other Intellectual Property Right, or contain any confidential material.
I understand that, through the medium of the Internet, files will be available to automated agents, and may be searched and copied by, for example, text mining and plagiarism detection software.
At such time that my thesis will be made publically available digitally (see 2.6 above), I grant the University of Warwick and the British Library a licence to make available on the Internet the thesis in digitised format through the Institutional Repository and through the British Library via the EThOS service.
If my thesis does include any substantial subsidiary material owned by third-party copyright holders, I have sought and obtained permission to include it in any version of my thesis available in digital format and that this permission encompasses the rights that I have granted to the University of Warwick and to the British Library.
5. LEGAL INFRINGEMENTS
I understand that neither the University of Warwick nor the British Library have any obligation to take legal action on behalf of myself, or other rights holders, in the event of infringement of intellectual property rights, breach of contract or of any other right, in the thesis.
Please sign this agreement and ensure it is bound into the final hard bound copy of your thesis, which should be submitted to Student Reception, Senate House.
M A
E
G NS
I T A T MOLEM
U N
IV
ER
SITAS WARWICEN SIS
Locality Sensitive Modelling Approach for Object
Detection, Tracking and Segmentation in
Biomedical Images
by
Guannan Li
Thesis
Submitted to the University of Warwick
for the degree of
Doctor of Philosophy
Department of Computer Science
Contents
List of Tables v
List of Figures vi
Acknowledgments xiv
Declarations xvi
A List of Publication xvii
Abstract xviii
Abbreviations xix
Chapter 1 Introduction 1
1.1 Object Analysis in Fluorescence Bioimages: Myosin VI Protein
Move-ment on Actin FilaMove-ments . . . 3
1.2 Object Analysis in Histology Images: Automatic Analysis of
Endome-trial Biopsy Images for the Diagnosis of Recurrent Miscarriages . . . 6
1.3 Aims of the Thesis . . . 8
1.3.1 Detection and Tracking of Myosin VI Protein Spots in TIRFM
Sequences . . . 8
1.3.2 Cell Detecion and Epithelium Segmentation in Endometrial
1.4 Main Contributions . . . 11
1.5 Thesis Layout . . . 12
Chapter 2 Detection of Myosin VI Protein Spots in Fluorescence Microscopy Sequences 14 2.1 Methodology . . . 15
2.2 Related Work . . . 17
2.3 Pre-processing . . . 20
2.4 Spot Detection . . . 21
2.4.1 Object Detection . . . 21
2.4.2 Spot Classification . . . 21
2.5 Generation of Synthetic TIRFM Sequences . . . 25
2.5.1 Modelling of Synthetic Spots . . . 25
2.5.2 Modelling of Actin Filaments . . . 25
2.5.3 Addition of Artificial Nosie . . . 26
2.6 Evaluation of the Proposed Spot Detection Algorithm . . . 26
2.6.1 Evaluation on Synthetic TIRFM Images . . . 28
2.6.2 Evaluation on Real TIRFM Images . . . 29
2.7 Summary . . . 29
Chapter 3 Tracking of Myosin VI Protein Spots on Actin Filaments 32 3.1 Related Work . . . 33
3.2 Extended Hungarian Algorithm . . . 35
3.3 IMM Filter with Two Motion Models . . . 38
3.4 Workflow of the Proposed Multi-target Spot Tracking Framework . . 40
3.5 Elimination of Error Tracks . . . 41
3.6 Evaluation of the Proposed Spot Tracking Framework . . . 43
Chapter 4 Cell Detection and Luminal Epithelium Localisation in
Endometrial Histology Images 59
4.1 Methodology . . . 60
4.2 Related Work . . . 61
4.3 Counting of Stromal and UNK Cells . . . 63
4.3.1 Detection of Stromal Cell Nuclei . . . 65
4.3.2 Resolving Redundant Detections of Stromal Cells . . . 66
4.3.3 Detection of UNK Cell Nuclei . . . 68
4.4 Localisation of the Luminal Epithelium Edge . . . 72
4.4.1 Tissue Region Identification . . . 72
4.4.2 Epithelial Cell Nuclei Identification . . . 74
4.4.3 Luminal Epithelium Edge Localisation . . . 75
4.5 Experimental Results . . . 78
4.5.1 Evaluation of the Proposed Detection Methods . . . 78
4.5.2 Evaluation of the Proposed Localisation Method . . . 81
4.6 Summary . . . 87
Chapter 5 Segmentation of Epithelium in Endometrial Tissue 88 5.1 Related Work . . . 89
5.2 Pre-processing . . . 95
5.2.1 Estimation of Pixel and Cell Orientations . . . 96
5.3 The Proposed Descriptors . . . 99
5.3.1 Computation of the Cell Orientation Congruence (COrCo) Descriptor . . . 99
5.3.2 Computation of the Local Binary Cell Orientation Congruence (LBCOrCo) Descriptor . . . 104
5.4 Evaluation of the Proposed Descriptors . . . 109
5.4.1 Comparison of the Proposed Descriptors on Epithelium
Seg-mentation . . . 111
5.4.2 Evaluation of the Top-Two Proposed Descriptors for
Glandu-lar Epithelium Segmentation . . . 115
5.4.3 Evaluation of the Top-Two Proposed Descriptors for
Simulta-neous Segmentation of Glandular and Luminal Epithelium . 126
5.4.4 Discussion . . . 132
5.5 Summary . . . 138
Chapter 6 Conclusions and Future Directions 139
6.1 Chapter Summaries . . . 140
List of Tables
2.1 Results of the proposed spot detection algorithm on synthetic TIRFM
frames distorted with three different levels of Poisson noise. . . 30
2.2 Results and runtime of the proposed spot detection algorithm on 5
different real TIRFM sequences of 100 frames. . . 31
3.1 OSPA errors for the proposed spot tracking framework and other
methods on synthetic and real TIRFM sequences. The two best
re-sults are shown in bold font. . . 47
4.1 Quantitative comparison of the evaluated methods, which shows the
averages of Precision and Recall values and F1. . . 79
5.1 The segmentation accuracies of the compared methods on the
sub-images containing only glandular epithelium. Dice scores are reported
by the averages±standard deviations and the best results are in bold.116
5.2 The glandular and luminal epithelium segmentation accuracies of the
compared methods on the complete image dataset. Dice scores are
reported by the averages ±standard deviations and the best results
List of Figures
1.1 (a) and (b) are two example images captured for identified regions in
the HPFs of whole slide images at 40× magnification. . . 9
2.1 The block diagram of the proposed multi-target tracking framework
for Myosin VI spots in TIRFM sequence. . . 15
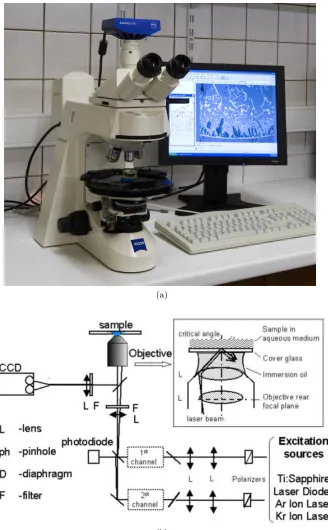
2.2 (a) A Zeiss Axioskop 40 Microscope; (b) Imaging process of Myosin
VI proteins using two-channel TIRFM. . . 18
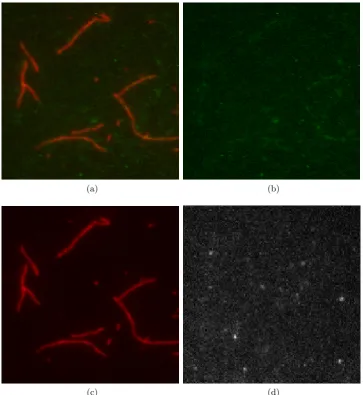
2.3 (a) is one sample frame from a two-channel TIRFM sequence of
Myosin VI proteins, (b) and (c) are the Green and Red channels
of (a) respectively, and (d) is a sample frame from a single-channel
TIRFM sequence of Myosin VI proteins. . . 19
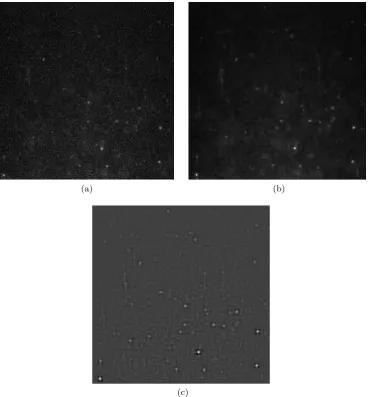
2.4 The intermediate result of each step in the pre-precessing stage
per-formed on real TIRFM frame. (a) Original frame. (b) Denoised
frame after translational invariant 3D wavelet transform and Kalman
filtering. (c) DoG filtered frame. . . 22
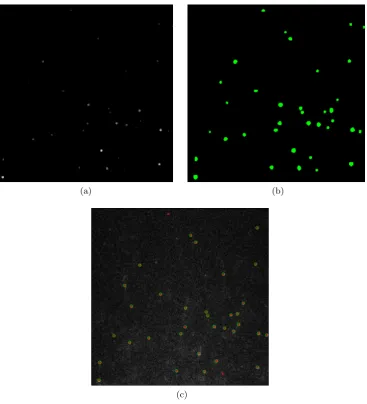
2.5 The intermediate result of each step in the pre-precessing stage on real
TIRFM frame. (a)H-dome transformed frame. (b) Samples drawn
from dome-like structures are depicted in green. (c) Final detection
results: all “dome-like” structures are depicted in red and only true
2.6 (a) A synthetic frame with type A background. (b) A synthetic frame
with type B background. Both synthetic frames depict spots of
dif-ferent sizes. . . 27
3.1 An example of the locality sensitive model with imaginary spots.
Black solid circles denote true spots, clear circles in a dotted line
denote virtual spots, and clear circles in a solid line denote dummy
spots. . . 37
3.2 Workflow of the proposed multi-target spot tracking framework for
Myosin VI spots in TIRFM sequence. . . 42
3.3 3D plot of the tracks produced by (a) the proposed spot tracking
framework and (b) u-track for 300 frames of a real one-channel TIRFM
sequence. Results show a region of the frames from [1-100] in both
thexandydirections. Each individual track is depicted in a different
colour. . . 46
3.4 Weighted Average Mean Square Displacement (MSD) curves of the
manually marked tracks (Ground Truth). . . 50
3.5 Weighted Average Mean Square Displacement (MSD) curves of a
montage of tracks generated by the proposed spot tracking
frame-work. . . 51
3.6 Weighted Average Mean Square Displacement (MSD) curves of a
montage of tracks generated by Mosaic. . . 52
3.7 Weighted Average Mean Square Displacement (MSD) curves of a
montage of tracks generated by GMimPro. . . 53
3.8 Weighted Average Mean Square Displacement (MSD) curves of a
3.9 Individual MSD curves of the tracks of five different spots, red curve
presents the MSD of a stuck spots track, orange curve presents the
MSD of a noisy spots track due to static noise or the camera
elec-tronics, the rest curves present the MSD of Myosin spots. . . 57
4.1 (a) Process of taking biopsies using a Endocell; (b) Mirax Midi (Zeiss,
Germany) whole slide scanner; (c) A local region of a whole slide
image viewed in Panoramic Viewer at 5×magnification . . . 62
4.2 Workflow for detecting stromal cells and segmenting UNK cell nucleus
(DAB stained brown) regions. Red dots indicate stromal cells and red
circles mark the UNK cell nucleus regions. . . 64
4.3 The model of the elliptical locality sensitive modelling. Red dots are
LIPSyM detections, red solid lines denote the boundaries of nuclei,
and the black ellipse marks the scope of the locality sensitive model,
and two dashed straight lines are the minor and major axes of the
probe, respectively. . . 69
4.4 The detection results of (a) LIPSyM and (b) the improved LIPSyM.
Green dots depict ground truth labelled by the experts for stromal
cell nuclei, while red dots depict stromal cell nuclei detected by the
algorithms. The differences between (a) and (b) are highlighted using
black arrows. . . 70
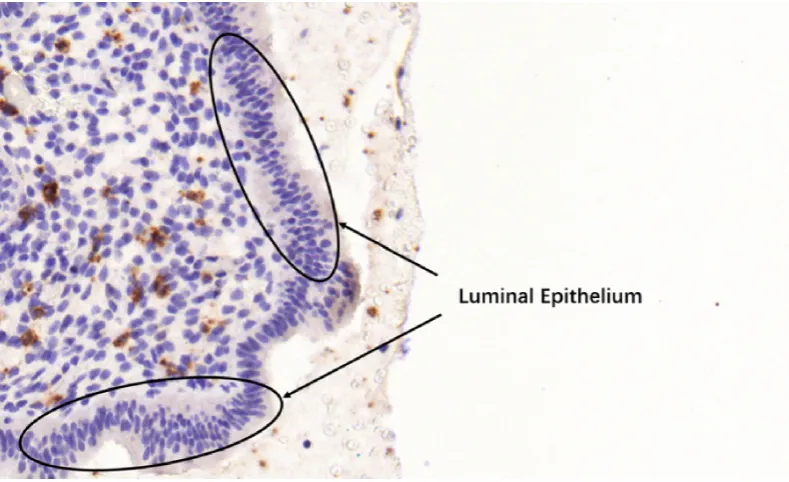
4.5 A sample image of luminal epithelium. . . 72
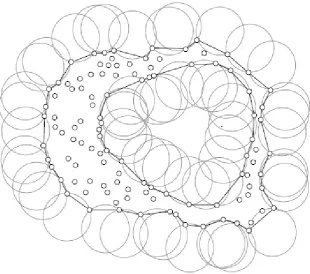
4.6 A 2D surface (the black edges between two points) constructed for a
point cloud using the alpha shapes algorithm. Retrieved from [1]. . . 74
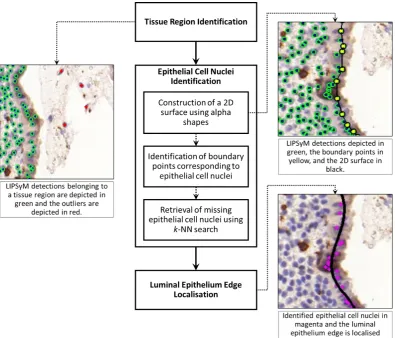
4.7 Workflow of the proposed luminal epithelium localisation method and
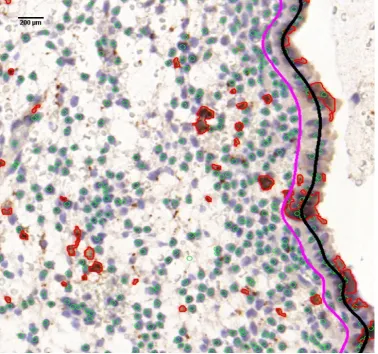
4.8 Final results of the stromal cell detection, UNK cell nucleus region
segmentation, and luminal epithelium edge localisation on a sample
image. Green circles indicate stromal cell nuclei; red areas are UNK
cell nucleus regions; the black curve localises the luminal epithelium
edge, and the magenta curve marks a distance (200µm) from the
luminal epithelium edge, any cell nucleus located within this distance
should not be counted. . . 77
4.9 (a) A cropped local region of an input image and (b) the stromal
cell nuclei and UNK cell nucleus regions segmented by VIS. In (b),
stromal cell nuclei segmented by VIS are shown in green and we mark
the incorrectly segmented stromal regions by VIS in black circles. . . 80
4.10 (a) Detection result of the original LIPSyM and (b) that of the
im-proved LIPSyM for the same cropped region shown in 4.9. Red dots
depict stromal cell nuclei detected by the algorithm and green dots
depict manually marked stromal cell nuclei. The differences between
(a) and (b) are highlighted using black arrows. . . 81
4.11 (a) Another cropped local region of the same input image showing
in green Ground Truth of UNK cell nuclei, and in red the UNK cell
nucleus regions detected by the proposed method. (b) The UNK
cell nucleus regions (in blue) and the stromal cell nucleus regions (in
green) segmented by VIS in the cropped local region of (a); note the
4.12 (a) shows the luminal epithelium localisation produced by the
pro-posed method and (b) shows the luminal epithelium segmentation
produced by VIS on same input images. In (a), Ground Truth of the
luminal epithelium edges is depicted in green, and the luminal
ep-ithelium edge detected by the proposed method is depicted in red. In
(b), the luminal epithelium segmentation produced by VIS is marked
by a black bounding box. . . 84
4.13 (a) shows the luminal epithelium localisation produced by the
pro-posed method and (b) shows the luminal epithelium segmentation
produced by VIS on same input images. In (a), Ground Truth of the
luminal epithelium edges is depicted in green, and the luminal
ep-ithelium edge detected by the proposed method is depicted in red. In
(b), the luminal epithelium segmentation produced by VIS is marked
by a black bounding box. . . 85
4.14 (a) shows the luminal epithelium localisation produced by the
pro-posed method and (b) shows the luminal epithelium segmentation
produced by VIS on same input images. In (a), Ground Truth of the
luminal epithelium edges is depicted in green, and the luminal
ep-ithelium edge detected by the proposed method is depicted in red. In
(b), the luminal epithelium segmentation produced by VIS is marked
by a black bounding box. . . 86
5.1 A block digram of the proposed method with intermediate result of each
step. Red dots depict detected cells, black bars represent cell orientation,
lumen segmentation is shown in transparent yellow, red grid marks
superpix-els, potential epithelial superpixels are shown in transparent red, green dots
depict epithelial cells classified by the proposed descriptors, and epithelial
5.2 Black circle marks the circular pixel neighbourhood, cell nucleus
seg-mentation is shown in green, red bars depict the estimated pixel
ori-entations, black dot depicts a detected cell, and black bar depicts the
estimated cell orientation. . . 98
5.3 The illustration of a locality sensitive model used in the COrCo
de-scriptor. Purple shapes depict cells, black dot depicts the position of
the cell, black circles mark the cell neighbourhoods in the descriptor,
black dashed lines divide the angular sections of the cell
neighbour-hoods (the gray regions), red dashed lines are coordinate axes, black
line depicts the cell orientation and black arrow depict a vector. . . . 103
5.4 The illustration of a locality sensitive model in the LBCOrCo
descrip-tor, black dot depicts the position of the cell, purple shapes depict
cells, black circles mark the cell neighbourhoods in the descriptor,
black dashed lines divide the angular sections of the cell
neighbour-hood (gray regions), red dashed lines are coordinate axes, black line
depicts the cell orientation and black arrow depict a vector. . . 107
5.5 Epithelium segmentation accuracy of the proposed descriptors. . . . 112
5.6 Comparison of computational speeds between different proposed
de-scriptors. . . 113
5.7 (a) is a cropped local region from an input image and (b) shows the
hand-marked Ground Truth in (a) using green lines. . . 117
5.8 Lumen segmentation of Figure 5.7(a) is shown in transparent yellow
and potential epithelium region is shown in transparent red in (b). . 118
5.9 (a) and (b) show the classification results of Figure 5.7(a) using the
MR-COrCo and MR-LBCOrCo descriptors, respectively. Black bars
depict cell orientations, red dots depict the cells classified as
non-epithelial cells, and green dots depict the cells classified as non-epithelial
5.10 (a) and (b) show the segmenatation results of Figure 5.7(a) using
the MR-COrCo and MR-LBCOrCo descriptors, respectively. Black
bars depict cell orientations. The differences between (a) and (b) are
highlighted using black arrows. . . 120
5.11 (a) is a cropped local region from an input image and (b) shows the
hand-marked Ground Truth in (a) using green lines. . . 122
5.12 Lumen segmentation of Figure 5.11 (a) is shown in transparent yellow
in (a) and potential epithelium region is shown in transparent red in
(b). . . 123
5.13 (a) and (b) show the classification results of Figure 5.11 (a) using the
MR-COrCo and MR-LBCOrCo descriptors, respectively. Black bars
depict cell orientations, red dots depict the cells classified as
non-epithelial cells, and green dots depict the cells classified as non-epithelial
cells. . . 124
5.14 (a) and (b) show the segmenatation results of Figure 5.11 (a) using
the MR-COrCo and MR-LBCOrCo descriptors, respectively. Black
bars depict cell orientations . . . 125
5.15 (a) is a cropped local region from an input image and (b) shows the
hand-marked Ground Truth in (a) using green lines. . . 128
5.16 Lumen segmentation of Figure 5.15(a) is shown in transparent yellow
in (a) and potential epithelium region is shown in transparent red in
(b). . . 129
5.17 (a) and (b) show the classification results of Figure 5.15(a) using the
MR-COrCo and MR-LBCOrCo descriptors, respectively. Black bars
depict cell orientations, red dots depict the cells classified as
non-epithelial cells, and green dots depict the cells classified as non-epithelial
5.18 (a) and (b) show the segmentation results of Figure 5.15(a) using the
MR-COrCo and MR-LBCOrCo descriptors, respectively. Black bars
Acknowledgments
It is my great honour to undertake this PhD which is absolutely an enlightened and
enjoyable experience in my life. This wonderful journey can never be accomplished
without enduring supports and trusts from all my family, supervisors, collaborators
and colleagues.
To my parents I dedicate this thesis in token of unspeakable affection and
gratitude. The story of my PhD all began by their unreservedly love and unshakable
trust on me. I must heartily appreciate my parents providing enormous financial
support for 11 years of my life and study in the United Kingdom, which culminated
in the form of this PhD thesis.
I would like to sincerely thank my supervisor Dr Nasir Rajpoot for offering
me this opportunity and financial support to participate in scientific research under
his patient and careful supervision. He has always been an excellent and warm
mentor who grants me firm confidence and research ability in academics over the
past few years. I would like also to thank my co-supervisor Dr Victor Sanchez for his
dedicated reviewing of my academic writing and inspirations to my research work
during all these years.
I am very thankful for all collaborators in my research work, for their efforts,
experimental materials and feedbacks. My special thanks to Dr Shahid Khan for
his help and feedback in our collaboration.
To my academic advisors, Prof Chang-Tsun Li, Dr Sara Kalvala and Dr
Yulia Timofeeva, I am very grateful for their time, involvement, discussions and
administrative staffs providing me a smooth and comfortable work environment.
I would like to acknowledge all current and previous members in our
lab-oratory, Prof David Epstein, Dr Shan E Ahmed, Dr Violet Kovacheva, Korsuk
Sirinukunwattana, Mike Tzu-Hsi Song, Nicholas Trahearn, Najah Alsubaie, Talha
Qaiser, Dr Adnan Khan, Dr Samuel Jefferyes and Dr Tian Ge, for their advice
and help in both research work and life during all these years. My special thanks
to Dr Shan E Ahmed Raza for his effort, guidance and feedback throughout our
collaboration.
Finally, I would like to extend my special gratitude to my beloved fiancee
Jinyan Song for her encouragement, truehearted love and unswerving companionship
Declarations
This thesis is submitted to the University of Warwick in support of my application
for the degree of Doctor of Philosophy. I declare that, except where acknowledged,
the material contained in the thesis is my own work, and has not been previously
published for obtaining an academic degree.
Guannan Li
A List of Publication
Journal Publications
1. Li, G., Sanchez, V., Raza, S. E., and Rajpoot, N. 2016, Novel cell orientation
congru-ence descriptors for epithelium segmentation in endometrial histology images. IEEE
Transactions on Medical Imaging (submitted)
2. Li, G., Sanchez, V., Patel, G., Quenby, S. and Rajpoot, N., 2015. Localisation of
luminal epithelium edge in digital histopathology images of IHC stained slides of
endometrial biopsies. Computerized Medical Imaging and Graphics, 42, pp.56-64.
3. Li, G., Sanchez, V., NAGARAJ, P., Khan, S. and Rajpoot, N., 2015. A novel
mul-titarget tracking algorithm for Myosin VI protein molecules on actin filaments in
TIRFM sequences. Journal of Microscopy, 260(3), pp.312-325.
Conferences
1. Li, G., Sanchez, V., Patel, G., Quenby, S. and Rajpoot, N., 2014. Localisation of
luminal epithelium edge in digital histopathology images of IHC stained slides of
endometrial biopsies. 12th European Congress on Digital Pathology (podium
presen-tation).
2. Li, G. and Rajpoot, N., 2012. Automated Segmentation and tracking of dynamic
focal adhesions in time-Lapse fluorescence microscopy. 19th International Conference.
Abstract
Biomedical imaging techniques play an important role in visualisation of e.g.,
bi-ological structures, tissues, diseases and medical conditions in cellular level. The
techniques bring us enormous image datasets for studying biological processes,
clin-ical diagnosis and medclin-ical analysis. Thanks to recent advances in computer
technol-ogy and hardware, automatic analysis of biomedical images becomes more feasible
and popular. Although computer scientists have made a great effort in developing
advanced imaging processing algorithms, many problems regarding object analysis
still remain unsolved due to the diversity of biomedical imaging.
In this thesis, we focus on developing object analysis solutions for two entirely
different biomedical image types: fluorescence microscopy sequences and
endome-trial histology images. In fluorescence microscopy, our task is to track massive
fluorescent spots with similar appearances and complicated motion pattern in noisy
environments over hundreds of frames. In endometrial histology, we are challenged
by detecting different types of cells with similar appearance and in terms of colour
and morphology. The proposed solutions utilise several novel locality sensitive
mod-els which can extract spatial or/and temporal relational features of the objects, i.e.,
local neighbouring objects exhibiting certain structures or patterns, for
overcom-ing the difficulties of object analysis in fluorescence microscopy and endometrial
Abbreviations
GFP Green Fluorescent Protein
ATP Adenosine triphosphate
TIRFM Total Internal Reflection Fluoresces Microscopy
TIFF Tagged Image File Format
SNR signal-to-noise ratio
IMM Interactive Multiple Model
LAP Linear Assignment Problem
CAT Computer-Aided Tracking
DoG Difference of Gaussian
EM Expectation Maximization
TP True Positive
FP False Positive
FN False Negative
OSPA Optimal Sub-Pattern Assignment
MSE Mean Squared Error
NN Nearest-Neighbour
UNK Uterine Natural Killer
H&DAB Haematoxylin & Diaminobenzidine
LIPSyM Local Isotropic Phase Symmetry Measure
UHCW University Hospitals Coventry and Warwickshire
HPFs High Power Fields
COrCo Cell Orientation Congruence
MR-COrCo Multi-Ring Cell Orientation Congruence
LBCOrCo Local Binary Cell Orientation Congruence
MR-LBCOrCo Multi-Ring Local Binary Cell Orientation Congruence
Chapter 1
Introduction
Biomedical imaging offers a new approach to study and understand biological
pro-cesses, as well as to measure and diagnose medical illnesses and conditions, by
visually revealing internal behaviours, structures and properties of biological
sub-stances, organs and tissues. However, biomedical imaging can produce extensive
datasets in which one single image also contain enormous information, e.g.,
moni-toring the interaction of massive sub-cellular structures from long image sequences,
and analysing abnormalities of enormous cells and tissue regions from thousands of
digital pathology images. Therefore, manual processing and analysing of biomedical
images is normally infeasible, as that would result in laboriousness,
unrepeatabil-ity and inefficiency. Moreover, bias and inaccuracy are often caused by subjective
assessment in manual work. Today the computer-aided techniques start playing a
more and more important role in the large-scale processing and analysis of
biomed-ical images.
In general, biomedical image has a wide diversity of types due to different
experiment purposes, biopsies, imaging equipments, or even imaging parameters,
which leads to the impossibility of developing generic solution for processing and
analysing all types of biomedical images. Nonetheless, some of the common tasks in
segmen-tation or tracking of certain objects, e.g., protein spots, cells or glands, depending on
the nature of images. Biomedical image processing is not trivial due to the
complex-ities of the objects and image quality, in most cases, conventional image processing
methods, e.g., Otsu thresholding, watershed segmentation, regional maxima, and
mathematical morphology, are often incorporated with more advanced techniques,
e.g., statistical inference, computer vision, pattern recognition, and machine
learn-ing.
For instance, a protein spot is first detected by local maxima (a spot is treated
as a set of connected neighbouring pixels which exhibits the maxima intensity in
a local region) in fluorescence microscopy image sequence, and it is then tracked
across the frames in two steps: (1) predicting its position by statistical inference
method on the next frame, and (2) updating its new position by associating it to a
corresponding spot which has the shortest distance to its predicted position on the
next frame. However, it is challenge to accurately associate spots between adjacent
frames based on comparing spot features such as position, shape or intensities,
because the spots are normally textureless and all in circular shape, and also such
spot features are highly inconsistent even over a short sequence of frames due to
imaging equality.
Another example of the application area is when the clinical diagnosis of a
medical condition is made on counting stromal cells in a tissue region. It is
diffi-cult to distinguish between stromal cell and epithelial cells because they have very
similar features in terms of texture and stain colour between them, and also the
features such as size and morphological shape are highly inconsistent between the
same type of cells. However, one can observe that stromal cells are distant to glands
and normally exhibits an inconsistent orientation pattern in a local neighbourhood.
In contrast, epithelial cells are packed along the lumen edge and are arranged in
parallel. The example of stromal and epithelial will be shown in the later
cell orientation consistency in local neighbourhood. It is obvious that modelling
temporal and spatial relationships between the objects in local neighbourhood can
offers more crucial advantages, comparing with exclusively employing their
inher-ent features (e.g., shape, texture and colour) for object analysis. We express such
relational features by numerically (or statically) computing the similarities or
dif-ferences between the objects (e.g., fluorescent spots or cells) in a temporal or/and
spatial local neighbourhood, such attempt is so called as locality sensitive modelling
approach.
In this thesis, we propose several image analysis algorithms by utilising the
fact that local neighbouring objects exhibiting certain structures or patterns, to
obtain their relational features computed by locality sensitive modelling approach,
for overcoming several difficulties of object analysis in two different projects. The
first one regards to track the movement of a motor protein in fluorescence images
for understating their roles in intracellular processes. The second one aims at
de-veloping a computer-aided system which can automatically counts cells in digital
endometrial biopsy images for assisting diagnosis of recurrent miscarriages due to
the over-presence of natural killer cells.
1.1
Object Analysis in Fluorescence Bioimages: Myosin
VI Protein Movement on Actin Filaments
Green Fluorescent Protein (GFP) [2] [3] was first isolated from the jellyfishAequorea
victoria in the early 1960s. It can emit bright green fluorescence when exposed to
light in the blue to ultraviolet range, which causes it to be used as genetically
en-coded probes. Jellyfish-derived GFP and its homologs extracted from diverse marine
animals have since been widely engineered into many mutants with enhanced
char-acteristics and availability in entire visible spectrum over the past few decades. The
have resulted in many possibilities for direct visualising of cellular structures and
a large number of intracellular activities such as protein interaction and traffick
in living cells, which provide scientists substantial biological information regarding
to the physical properties of fluorescent proteins, i.e., extinction coefficients,
quan-tum yields and photobleaching rates, for answering many biological questions in
sub-cellular level.
Myosins consist of a family of Adenosine triphosphate (ATP) dependent
mo-tor proteins in eukaryotes, that convert chemical energy in the form of ATP to
mechanical energy to generate force and movement for Actin-based motility. They
are well known for their involvements in muscle contraction [7] [8] and role in a
wide range of cell motility processes [9]. Myosin VI protein is a processive motor
[10] that attaches to the surface of a suitable substrate, called Actin filament, and
uses it as a rail to carry out the movement. This particular protein shows a very
interesting phenomenon that it travels towards the minus end of an Actin filament,
in an opposite direction as compared to other proteins in the Myosin family [11].
Investigating the movements of Myosin VI proteins on Actin filaments may assist
in answering many questions regarding their functions and motor properties in a
variety of intracellular processes such as vesicular membrane traffic, cell migration
and mitosis [12]. Nonetheless, manually tracking and recording the movements of
thousands of fluorescent protein spots over several hundreds of image frames is not
a feasible option, as it suffers from unrepeatability, inefficiency, and inaccuracy due
to subjective assessment. Therefore, a computer-aided multi-target tracking system
is eagerly requested by cell biologists for analysing the spatio-temporal movement
of Myosin VI proteins.
A conventional tracking framework for fluorescent spots is comprised of
sev-eral steps. First, the image sequences are usually very noisy due to background
fluorescence and electronic noise of microscopy. Since the image quality has an
reduction/removal of background noise and enhancement of the visual appearances
of fluorescent spots, is necessary for improving the signal-to-noise ratio (SNR) of
images, which can be accomplished by many denoising techniques [13]. Second,
flu-orescent spots are detected from each image frame for the later tracking step, the
detection is usually based on the assumption of that visual appearance of fluorescent
spot exhibits as a regional maxima in a small local image region in terms of intensity
or a response of an imaging system to a point source that described by
diffraction-limited point spread function (PSF) [14]. The last step is to track fluorescent spots
across all image frames. The spot tracking is essentially a data association process
that iteratively associates target in one frame with their correspondences appeared
in an adjacent (previous or next) frame, which eventually establishes the target
trajectories over a fragment of consecutive frames. Data association methods are
generally categorised into local and global association. The strategy of local data
association is to individually associate an established target track up to one frame
with a most probable target among all potential targets within the local
neighbour-hood (also called acceptance gate) around the location of current track in successive
frames. Nearest Neighbour filtering [15], Multiple Hypothesis Tracker [16] [17] [18]
and Joint Probabilistic Data Association filter [19] [20] [21] [22] are well known
local data association based tracking methods. On the contrary, global data
asso-ciation, e.g., [23] and Linear Assignment Problem based methods [24] [25] [26] [27]
simultaneously associate all the targets in one frame with their correspondences in
an adjacent frame, by finding a globally minimum matching cost (e.g., Euclidean
distance between two spots).
Spot tracks generated by data association suffer from inaccuracy due to noisy
background and spot measurement/detection errors. Bayesian filtering based
meth-ods, e.g., Kalman filter [28], Extended Kalman filter [29], Unscented Kalman filter
[30] and Particle filter [31], are often employed as estimators which recursively
states and the new spot measurements to smooth and improve spot tracks
pro-duced by data association methods. Kalman filter is only appropriate when the
targets have linear motion models. Non-linear Bayesian filters such as Extended
Kalman filter, Unscented Kalman filter and Particle filter are designated to handle
the non-linearity of some spot motions (e.g., Brownian motion). Extended Kalman
filter attempts to linearise the non-linear motion model but suffers from divergence
caused by poor linearisation. Unscented Kalman filter and Particle filter use a set of
Monte Carlo sampled points/particles (potential spot states) to represent a
poste-rior probability distribution of the spot states. However, they are computationally
intensive in dense and clutter environments such as hundreds of fluorescent
pro-teins. Interactive Multiple Model (IMM) filtering [32], on the other hand, provides
a computationally effective alternative for approximating non-linear spot motions
by running multiple Kalman filters in parallel, where each Kalman filter features a
distinct motion model respectively.
1.2
Object Analysis in Histology Images: Automatic
Analysis of Endometrial Biopsy Images for the
Di-agnosis of Recurrent Miscarriages
Digital pathology offers several advantages over the age-old tissue slide analysis
under the microscope by converting tissue slides into high-resolution microscopic
image of the whole slide. One of these advantages is the seamless transfer and
manipulation of digitised images via computer algorithms [33]. Indeed, histology
image analysis has been tipped to hold the key to providing the much needed added
value to digital pathology [34].
Uterine Natural Killer (UNK) cells are immune cells found in the human
female uterus lining. In general, these cells make up no more than 5% of all cells in
numbers of UNK cells in the uterus of women who suffer from recurrent miscarriages,
a condition that affects one in every 100 women of reproductive age in the UK.
High UNK cell density in the lining of the womb was associated with glucocorticoid
deficiency [36] and a small randomised controlled trial suggested that women with
high numbers of UNK cells are more likely to have a live birth if given glucocorticoids
in lieu of placebo [37]. This means that UNK testing has clinical significance as it
could direct clinicians towards the effective treatment. A diagnose protocol for
the recurrent miscarriages due to the over-presence of UNK cells devised in [35]
calculates the ratio of UNK cells to stromal cells in digital images of endometrial
tissue slides.
Manual counting of thousands of cells from a large digital endometrial
histol-ogy image dataset on a regular basis is cost ineffective, potentially inaccurate due to
subjective assessment, and involves the hassle of manually removing epithelium from
tissue regions. The automatic cell counting system involves several image processing
steps, i.e., detecting all types of cells, segmenting brown stain regions and
epithe-lium for cell classification, and classifying stromal, epithelial and UK cells, which is
continuously performed on the HPF images from the same whole slide image until
a number (5,000 at minimum in our experiments) of stromal cells are cumulatively
counted. Next, the ratio of UNK cells to stromal cells is calculated and converted
into a percentage for the diagnosis.
UNK cells are those cells covered by brown stain regions, which are illustrated
in Figures 1.1(a) and (b), brown stain regions can be used for classifying UNK cells.
Counting stromal and UNK cells is the primary task here and the analysis of cell
morphology in endometrial biopsies (i.e., colour texture, morphological shape, or
mitosis) is beyond the scope of the diagnose protocol, therefore segmentation of
stromal and UNK cells is not necessary to accomplish the cell counting. Nonetheless,
it is compulsory to segment brown stain region for classify UNK cells from the counts.
difficult due to their exhibiting similar stain colour and texture in a variety of
mor-phological shapes, as shown in Figures 1.1(a) and (b). However, epithelial cells are
packed at the boundaries of tissue regions and lumen, therefore this prior
knowl-edge can help us to locate potential epithelial cells from the detected cells. More
importantly, it is observed that epithelial cells in local neighbourhood have distinct
distribution/arrangement and orientation congruency along some particular
direc-tions, compared with that of local neighbouring stromal cells. This observation gives
us a clue for distinguishing between epithelial and stromal cells, although these two
types of cells are exhibiting the same intrinsic features.
1.3
Aims of the Thesis
The objects in microscopy sequences and endometrial histology images often exhibit
inconsistent features compared with the other objects of the same type or similar
fea-tures to the objects of other types. Existing object analysis algorithms in biomedical
image have weaknesses and unsatisfactory performance for analysing these objects,
because these methods are limited in modelling intrinsic characteristics of the
ob-jects. In this thesis, we aim to expand the capabilities of object analysis in both
TIRFM sequences of Myosin VI proteins and Endometrial Histology Images, by a
locality sensitive modelling approach derived from the concept of that the prominent
features of an object may embody in a temporal or spatial correlation between it
and others in a local neighbourhood.
1.3.1 Detection and Tracking of Myosin VI Protein Spots in TIRFM
Sequences
Existing spot tracking algorithms are proprietary for the specific types of fluorescent
spots and microscopy sequences. Consequently, they are not adept in detecting and
appear-(a)
[image:33.595.121.520.150.638.2](b)
Figure 1.1: (a) and (b) are two example images captured for identified regions in
ances and non-linear motions of the spots and noisy backgrounds such as fluorescent
artefacts and subcellular objects. Moreover, these algorithms are computational
ex-pensive and inaccurate when they are faced with intensive number of spots with
frequent overlapping, disappearing, reappearing, and abrupt changes of directions
and velocities. Our aim is to develop a low computational cost multi-target
track-ing framework to cope with the complex characteristics of Myosin VI spots and
overcomes the difficulties in their detection and tracking in TIRFM sequence.
1.3.2 Cell Detecion and Epithelium Segmentation in Endometrial
Histology Images
The computer-aided diagnostic system for recurrent miscarriages due to over-presence
of UNK cells is developed in two stages. The first stage aims to detect cells,
clas-sify between stromal and UNK cells, and localise luminal epithelium in order to
excluded epithelial cells. It is important to note that the image data in the first
stage was captured near the boundary of tissue regions and gland are not included
according to the diagnosis protocol of the first stage. Hence, the scope in this stage
is to remove only the cells which are located within a range of 200µm to luminal
epithelium from the cell counts.
To the best of our knowledge, there is no existing method proposed for
segmenting both luminal and glandular epithelium in endometrial histology
im-age. Alternatively, the epithelium can be indirectly obtained by extracting it from
segmented glandular structures. Existing gland segmentation methods are mainly
based on the assumption that a glandular structure is in the form of lumen
sur-rounded by a layer of epithelial cells. And they tend to detect, segment or classify
lumen and epithelial cells by employing their locations, colour and texture. In
en-dometrial histology, there are insignificant distinctive features, in terms of colour,
texture and morphology, between epithelial and stromal cells, and also between
layers of epithelial cells, and stromal cells are also packed at the boundaries of glands
and tissue regions in some cases. Consequently, these methods fail to segment
ep-ithelium correctly. In the second stage, the ultimate goal is to develop a universal
solution for segmenting both luminal and glandular epithelium in order to excluded
epithelial cells..
1.4
Main Contributions
The novelty of our framework for tracking Myosin VI proteins in TIRFM is manifold
and listed as follows:
• First, it uses a Bayesian estimation filter with two motion models to accurately
approximate the non-linear movements of Myosin VI proteins.
• Second, it integrates a global data association into the Bayesian estimation
filtering process for solving measurement-to-target and estimation-to-target
assignment problems.
• Third, it overcomes the limitation of bijective mapping of global data
associ-ation by incorporating a locality sensitive model with imaginary spots in the
spot association process.
Several novel methods are contributed for detecting and classify different types of the
cells, and also for segmenting both luminal and glandular epithelium in endometrial
histology images:
• A cell detection method based on local phase symmetry is enhanced by a
novel locality sensitive model for improving cell dtetcion accuracy, and a novel
adaptive background removal method is proposed to segment brown stain
regions (when stain UNK cell using DAB) which are used identify UNK cells.
• We identify individual tissue region by using a clustering algorithm on the
boundaries of tissue regions as epithelial cells. A curve fitting method is then
used on the identified epithelial cells to mark luminal epithelium.
• We propose a generic solution for segmenting both luminal and glandular
ep-ithelium. It is observed that epithelial cells are arranged in a locally and neatly
oriented manner therefore neighbouring epithelial cells exhibit certain patterns
of orientation congruence. Based on the observation, we propose a variety of
novel cell orientation congruence descriptors for epithelium segmentation. The
common idea of the proposed descriptors is to describe cell orientation
con-gruence within a local cell neighbourhood using locality sensitive modelling
approach.
1.5
Thesis Layout
This thesis is divided into 6 chapters. An introduction of biomedical imaging was
given in Chapter 1, followed by a brief discussion of challenges and solutions for
computerised objects analysis in biomedical imaging. The following chapters 2, 3,
4 and 5 present the solutions based on locality sensitive modelling. Each chapter
also briefly reviews the related work and evaluates the proposed solution against the
state-of-the-art methods.
Chapter 2 presents the pre-processing methods for removing background
noise and enhancing spot appearance to improve spot detection accuracy, and also
a method for detecting Myosin protein spots. Next, a multi-target spot tracking
framework for is presented in Chapter 3.
Chapter 4 presents a complete cell detection solution for the endometrial
histology images containing only luminal epithelium. The solution consists of a cell
detection method, a DAB stain segmentation method for classifying UNK cells, and
a luminal epithelium localisation methods for excluding irrelevant cells from the
descriptors to classify epithelial cells, which can be integrated with superpixel to
attain a generic approach for segmenting both luminal and glandular epithelium.
Chapter 6 concludes the thesis, summarises contributions, advantages and
limitations of the work, and discusses several future directions for extending the
Chapter 2
Detection of Myosin VI Protein
Spots in Fluorescence
Microscopy Sequences
The major steps for tracking spot in fluorescence microscopy sequences has been
introduced in Chapter 1, which involves 3 main stages: pre-processing, spot
detec-tion, and spot tracking. Figure 2.1 shows a workflow of the proposed multi-target
tracking framework for Myosin VI protein spots in fluorescence sequence and the
intermediate results of each stage. In this chapter, we focus on presenting the
pre-processing and spot detection stages, the spot tracking stage will be introduced in
Chapter 3.
The reminder of this chapter is organised as follows. Section 2.1 introduces
all details necessary to recreate the experiments of detecting and tracking Myosin VI
protein spot in fluorescence microscopy sequences. In Section 2.2, we briefly discuss
several popular algorithms for detecting fluorescence spots. A pre-processing method
for fluorescence microscopy sequences is introduced in Section 2.3 and an algorithm
Figure 2.1: The block diagram of the proposed multi-target tracking framework for Myosin VI spots in TIRFM sequence.
of generating synthetic fluorescence sequences for evaluating the proposed detection
and tracking algorithms in Section 2.5. In Section 2.6, we evaluate the proposed
detection algorithm on both real and synthetic fluorescence microscopy sequences.
The work is summarized in Section 2.7.
2.1
Methodology
To study vitro properties of Myosin VI proteins, our collaborators artificially
in-troduce plasmid into transfected mammalian cells to produce the engineered Myosin
VI protein with a fluorescent tag. Once the proteins start being produced by the
cells, our collaborators harvest the cell to extract and purify the proteins which are
used to do the in-vitro motility stepping assays to analyse the properties of a single
molecule [38] [39]. Myosin VI proteins on Rhodamine-Phalloidin stabilised Actin
filaments are dyed by enhanced GFP [40] and their spatial-temporal movements are
captured using Total Internal Reflection Fluorescence Microscopy (TIRFM) [41] [42]
abili-ties of limiting Myosin VI protein excitation in a narrow spectrum region and
elim-inating background fluorescence. These particular advantages significantly improve
signal-to-noise ratios and the spatial resolution of fluorescent proteins to enhance
their visual presences in in-vitro image sequences, thereby easing object analysis
in fluorescence bioimage such as detection and tracking of Myosin VI proteins to a
certain extent [42].
The fluorescence microscopy assay for Myosin VI proteins were performed
using an Axioskop 40 Microscope (Zeiss, Germany) shown in Figure 2.2(a),
fluores-cence microscope with a PlanNeofluar 100×1.45 numerical aperture objective fitted
with a custom laser excitation system consisting of a frequency doubled neodymium:
that entered the fluorescence light path using a custom-built adaptor.
Fluores-cence emitted from the rhodamine-phalloidin-labeled actin filaments or the eGFP
labelled Myosin VI complexes was collected by the same objective lens. Filter cubes,
mounted in the microscopes epifluorescence filter wheel, separated the eGFP
fluo-rescence (Excite 488nm Laser, dichroic: Di02-R488; Emission filter: FF02-520/28,
Semrock, Rochester, NY, USA) from the rhodamine fluorescence (yttrium aluminum
garnet laser (λ= 532nm, 20 milliwatts), dichroic: Di02-R561; Emission filter:
FF01-609/54 Semrock), the fluorescence was imaged onto a charge coupled device camera.
More details on microscopy workstation can be found in [43]. The issues of static
errors due to ambient vibrations was dealt with in [44]. They analysed static eGFP
spots which were immobilized to a glass coverslip and showed that mobile single
fluorophores could be detected reliably.
Furthermore, the setup used in our experiments is similar to the one used in
[44] where a shutter-less camera was used to acquire the images. Image sequences
of video were captured using a frame grabber card and recorded onto a computer
hard disc in Tagged Image File Format (TIFF). The time interval between two
adjacent frames of the TIRFM sequences is 0.048s. The resolution of a frame is
proteins using two-channel TIRFM is shown in Figure 2.2(b). Myosin VI proteins
and Actin Filaments are imaged in the Green and Red channel respectively. A
sample frame from a two-channel TIRFM sequence is shown in Figure 2.3(a). The
Green and Red channels separated from the sample frame are shown in Figures
2.3(b) and (c), respectively. In addition, Figure 2.3(d) shows a sample frame from
an one-channel TIRFM sequence of Myosin VI proteins.
2.2
Related Work
It is a great challenge of obtaining accurate and complete detection of
subcellu-lar structures in fluorescence microscopy images [45]. The quality of fluorescence
microscopy image is typically poor due to many limitations in the image
acqui-sition process. It is especially the case for imaging living cell, where the images
normally have a very low SNR, this is because that the illumination is reduced
to the minimum in order to prevent photo-damage and photo-bleaching [46] [47].
In addition, although optical microscopy technique has been greatly improved over
the last decade [48], the resolution of the best microscope available today is only
approximately 100 nanometers, which is still comparatively coarse to the sizes of
subcellular structures (generally only several nanometers in diameter). This causes
that a subcellular structure labelled with GFPs exhibits as a bright spot which has
diffraction-limited appearance and only occupy a few pixels in the images.
More-over, the appearances of subcellular structures are similar to that of e.g., fluorescent
artefacts, other irrelevant background structures, or even the background noise due
to electronics. Therefore it is very difficult even for expert biologists to precisely
recognise subcellular structures in fluorescence microscopy images.
Spot detection methods are generally divided into two groups:
unsuper-vised and superunsuper-vised. Unsuperunsuper-vised methods implicitly or explicitly model the
(a)
[image:42.595.158.487.124.655.2](b)
(a) (b)
[image:43.595.137.501.193.589.2](c) (d)
tuned either manually or semi-automatically to proper values based on the
assump-tion/observation of specific images in order to achieve the best performance. Thus,
the performance of unsupervised methods depends on the nature of specific images.
Most of unsupervised methods can be employed in both pre-processing (e.g., image
denoise and spot enhancement) and detecting spot, e.g., wavelet-based multi-scale
detectors [49] [50] [51], local background subtraction [52], linear filtering [53] [54]
[55], and morphological filtering [56] [57] [58] [59]. The proposed spot detection
method is a mixture of several methods listed above.
Supervised methods [60] attempt to “learn” the appearances of spots and
irrelevant objects from small image patches containing their intensity profiles and
use a classifier, e.g., Adaboost [61] [62] to distinguish between spots and background
objects based on “the learned appearances”. Supervised methods are more
power-ful than unsupervised methods when sufficient and accurate“learning materials” are
provided [63]. Unfortunately, supervised methods are not suitable in our case since
limited number of image dataset were provided to the experiments. A
comprehen-sive comparison between a number of state-of-the-art unsupervised and supervised
methods is presented in [63].
2.3
Pre-processing
The pre-processing stage is aimed at facilitating the later spot detection stage by
improving the quality (SNR) of image frames via denoising the noisy background
and enhancing the visual appearances of spots in TIRFM sequence. We first denoise
the TIRFM sequences by using the translational invariant 3D wavelet transform
proposed in [64] on the entire sequence. This wavelet based approach is effective
in removing the noisy background and aberrant “spot-like” noise while significantly
reducing the Gibbs phenomenon that is commonly observed when using wavelet
Difference of Gaussian (DoG) filter on a frame-by-frame basis in order to enhance the
visibility of any potential spot. Here, the Kalman filter adjusts the pixel intensities
of framet based on the pixel intensities of frame t−1, where t denotes the frame
index in time. The DoG filter is utilised to sharpen spot appearances, as well as
remove undesirable artefacts and noises. The intermediate result of each step of the
pre-precessing stage performed on real TIRFM frame is shown in Figure 2.4.
2.4
Spot Detection
The spot detection stage consists of two steps: 1) object detection and 2) spot
classification.
2.4.1 Object Detection
In the first step, we apply theH-dome transform [65] on each frame. This particular
image transformation can detect all regional maxima (bright objects) that resemble
“dome-like” structures, e.g., the diffraction-limited spots due to the GFP bound to
the Myosin VI protein molecules in our cases.
2.4.2 Spot Classification
In the second step, we propose a spot detection method inspired by the work
in-troduced in [63] to distinguish between potential diffraction-limited spots and other
“dome-like” structures. We first normalise the H-dome transformed imageIH into
a 2D probability distribution mapMp as follow,
Mp(x, y) =
IH(x, y)
max(IH)
(2.1)
where IH(x, y) and Mp(x, y) denote the intensity and probability values at pixel
(x, y) of IH and Mp, respectively, andmax(IH) is the maximum intensity value of
(a) (b)
[image:46.595.137.506.193.591.2](c)
Second, we draw a large number of sample points from the IH using the
probability mapMp. Since the probability values of “dome-like” structures are much
higher than that of the background, sample point clusters are usually found in those
pixel regions depicting “dome-like” structures. The sample point are clustered using
the Mean-shift algorithm [66].
Finally, we fit a 2D Gaussian model to each detected clusterRdome, using an
Expectation Maximization (EM) algorithm. The EM algorithm finds the maximum
likelihood estimates of the parameters of the fitted 2D Gaussian model, i.e., mean
positionµdome, covariance matrix Σdome, and standard deviations σx and σy in the
x and y directions. We observe that a “dome-like” structure depicts a
diffraction-limited spot as long as the estimated 2D Gaussian model for the corresponding
cluster satisfies the following criteria: 1) µ is found close to the centroid ofRdome;
2) σx ≤ 1 and σy ≤ 1; 3) the off-diagonal values in Σdome are close to zero; and
4) min(σx2, σ2y)/max(σx2, σy2) ≥ 0.6, in other words, Rdome should resemble a more
circular shape rather than an elliptical shape. In addition, the size ofRdome should
be within a threshold according to the magnification used to acquire the TIRFM
sequences. For our TIRFM dataset, this size should be no larger than 5×5 pixel.
Figure 2.5 shows the intermediate result of each step in the spot detection stage on
real TIRFM frame.
The diffraction-limited spots detected using the proposed detection algorithm
may still contain those noisy spots caused by, e.g., electronic or auto-fluorescence
noise. The true diffraction-limited spots usually retain their intensity level over
time until they photo-bleach in a single step fashion or dissociate. In contrast, the
noisy spots due to electronic noise usually persist for up to 2-3 frames only, while
the intensity values of the noisy spots due to cellular auto-fluorescence noise, which
comprise multiple dim fluorophores in most of the cases, decay exponentially with
time. Therefore, we can also remove some noisy spots based on the above prior
(a) (b)
[image:48.595.138.506.184.589.2](c)
Figure 2.5: The intermediate result of each step in the pre-precessing stage on real
TIRFM frame. (a) H-dome transformed frame. (b) Samples drawn from
2.5
Generation of Synthetic TIRFM Sequences
We generate one-channel (gray-scale) synthetic TIRFM sequences of Myosin VI
spots moving along Actin filaments in 3 steps: 1) modelling synthetic Myosin VI
spots, 2) generating synthetic Actin filaments, and 3) adding artificial noises to the
background.
2.5.1 Modelling of Synthetic Spots
We assume that the visual appearances of Myosin VI spots exhibit as 2D Gaussian
distribution. The intensity value S(x, y) of the synthetic spot at pixel (x, y) is
computed as,
S(x, y) =f·e−(X0+Y0) (2.2)
where
X0 = (x−xo) cosθs−(y−yo) sinθs
σ02x ,
Y0= (x−xo) sinθs+ (y−yo) cosθs
σ02y
where xo and yo denote a randomly generated centroid position of the synthetic
spot, and σx0 and σy0 control the spread in the x and y directions, respectively, f
is the intensity factor which adjusts the brightness of the synthetic spot, and θs
controls the orientation of the synthetic spot.
2.5.2 Modelling of Actin Filaments
Actin filaments, in general, resemble curvilinear structures [67], whose shapes are
hard to approximate. To this end, we model synthetic Actin filaments as a collection
of curve segments and approximate each segment using the cubic Bezier curve [68].
The synthetic Actin filaments are also used as motion trajectories which control the
animation of synthetic spots over the sequences.
point P n and its shape is controlled by a set of control points P1 through Pn−1.
The position atttime step of a cubic (3 orders) Bezier curveB3(t) is define as,
B3(t) = (1−t)3P0+ 3(1−t)2tP1+ 3(1−t)t2P2+t3P3,
0≤t≤1
(2.3)
The length of each generated cubic Bezier curve is very short (only a very
few pixels). One synthetic Actin filament is approximated by connecting a set of
m cubic Bezier curves. The end point of the first curve must be same as the start
point of the second curve and so on. In addition, the start point of the first curve
must not be same as the end point of the last curve since we assume that real Actin
filament is never closed.
2.5.3 Addition of Artificial Nosie
We add 3 types of artificial noise into the synthetic TIRFM frames: 1)
auto-fluorescence noise, i.e., the synthetic spots with exponentially decayed brightness
over time, 2) fluorescent artefacts, i.e., the synthetic spots with oversized or very
elongated shapes, and 3) electronic noise in the background, i.e., Poisson noise.
Fig-ure 2.6 show two examples of synthetic TIRFM frames with different backgrounds.
2.6
Evaluation of the Proposed Spot Detection
Algo-rithm
We use Precision and Recall values to quantify the accuracy of our spot detection
algorithm and the values are defined as follows,
P recision= T P
T P +F P
Recall= T P
T P +F N
(a)
(b)
where a True Positive (TP) is a detected spot that can be found in the ground
truth (i.e., manually detected spots), a False Positive (FP) is a detected spot that
cannot be found in the ground truth, and a False Negative (FN) is a spot that is
not detected by the algorithm but that can be found in the ground truth.
2.6.1 Evaluation on Synthetic TIRFM Images
We generate synthetic TIRFM images with a resolution of 320×320 pixel with one
of two types of backgrounds: type A has an uniformly distributed image snrintensity
level, while type B contains large cluttered objects that often appear in real TIRFM
frames and usually represent large subcellular structures.
In our real TIRFM sequences, spots are usually of different sizes with round
or elongated shapes. For the synthetic data, with both typeA andB backgrounds,
we model round and elongated spots with two sizes; small and large. These
elon-gated spots are generated using different standard deviation values in thex and y
directions, within the range [0.8−1.2] for small spots, and within the range [1.4−2.2]
for large spots. Round spots are generated by setting the standard deviation to 1.0
in thexandy directions for small spots, and to 1.8 for large spots. Both Figure 2.6
(a) and (b) show different sizes and roundness of the synthetic spots. We generate
over 250 randomly-positioned spots for each synthetic frame. Figure 2.6 (a) and (b)
shows two synthetic frames with typeA and B backgrounds, respectively.
In this work, the synthetic data is distorted by one of three levels of Poisson
noise; low, medium or high. Poisson noise is generated by rescaling the intensity
values of the frames to different ranges, and the intensity value of each pixel in the
rescaled frame is interpreted as the mean of a Poisson distribution that is used to
generate a new random intensity value for the corresponding pixel. After rescaling,
the frames are rescaled back to the original range of intensities. Low-level Poisson
noise (SNR≈49dB) is generated by rescaling the pixel intensities to the range [1,60],