Original citation:
Brand, Samuel P. C., Rock, Kat S. and Keeling, Matthew James. (2016) The interaction between vector life history and short vector life in vector-borne disease transmission and control. PLoS Computational Biology, 12 (4). e1004837.
Permanent WRAP URL:
http://wrap.warwick.ac.uk/79397
Copyright and reuse:
The Warwick Research Archive Portal (WRAP) makes this work of researchers of the University of Warwick available open access under the following conditions.
This article is made available under the Creative Commons Attribution 4.0 International license (CC BY 4.0) and may be reused according to the conditions of the license. For more details see: http://creativecommons.org/licenses/by/4.0/
A note on versions:
The version presented in WRAP is the published version, or, version of record, and may be cited as it appears here.
The Interaction between Vector Life History
and Short Vector Life in Vector-Borne Disease
Transmission and Control
Samuel P. C. Brand1,2*, Kat S. Rock1,2, Matt J. Keeling1,2,3
1School of Life Sciences, University of Warwick, Coventry, United Kingdom,2WIDER (Warwick Infectious Disease Epidemiology Research) Centre, University of Warwick, Coventry, United Kingdom,3Mathematics Institute, University of Warwick, Coventry, United Kingdom
*S.Brand@warwick.ac.uk
Abstract
Epidemiological modelling has a vital role to play in policy planning and prediction for the control of vectors, and hence the subsequent control of vector-borne diseases. To decide between competing policies requires models that can generate accurate predictions, which in turn requires accurate knowledge of vector natural histories. Here we highlight the impor-tance of the distribution of times between life-history events, using short-lived midge spe-cies as an example. In particular we focus on the distribution of the extrinsic incubation period (EIP) which determines the time between infection and becoming infectious, and the distribution of the length of the gonotrophic cycle which determines the time between suc-cessful bites. We show how different assumptions for these periods can radically change the basic reproductive ratio (R0) of an infection and additionally the impact of vector control
on the infection. These findings highlight the need for detailed entomological data, based on laboratory experiments and field data, to correctly construct the next-generation of policy-informing models.
Author Summary
The basic reproductive ratio (R0) is a crucial measure of transmission intensity, lying at
the interface between mathematical modelling and policy decision making. If control mea-sures can induce a situation whereR01 for a sustained period of time then the pathogen
must be eradicated. For diseases spread by short-lived insect vectors a modeller can not calculateR0without addressing questions of chance such as,“What percentage of vectors
will survive their extrinsic incubation period (EIP) to become infectious?”. Classical Ross-Macdonald theory provides answers for the modeller by making certain concrete assump-tions, such as a fixed length EIP and exponentially distributed times between vector blood-meals. Using bluetongue virus spread by biting midges as an exemplar we demonstrate that biologically plausible alterations to the classical assumptions can significantly change the modeller’s prediction ofR0with both serious over-estimation and under-estimation
being possible. The important modelling/control question,“How doesR0respond to a11111
OPEN ACCESS
Citation:Brand SPC, Rock KS, Keeling MJ (2016) The Interaction between Vector Life History and Short Vector Life in Vector-Borne Disease Transmission and Control. PLoS Comput Biol 12(4): e1004837. doi:10.1371/journal.pcbi.1004837
Editor:Jacob Koella, Universite de Neuchatel Institut de Chimie, SWITZERLAND
Received:July 6, 2015
Accepted:February 29, 2016
Published:April 29, 2016
Copyright:© 2016 Brand et al. This is an open access article distributed under the terms of the Creative Commons Attribution License, which permits unrestricted use, distribution, and reproduction in any medium, provided the original author and source are credited.
Data Availability Statement:All relevant data are within the paper and its Supporting Information files.
increased vector per-capita mortality?”, is also found to depend strongly on details of the vector life-cycle expressed in the language of probability distributions.
Introduction
The language of probabilities and chance entered mathematical epidemiology, then dubbed pathometry, almost from its foundations [1]. However, the common use, and huge success, of deterministic models for disease dynamics (ODEs) have made certain probabilistic assump-tions very popular in the literature; for example the implicit assumption that the time between various epidemiologically important events is exponentially distributed, which follows from assuming constant per capita rates of change. For vector-borne diseases (VBDs) the ODE-based approach dominates, originating with Ross’modelling of malaria [2]. In the 1940s and
‘50s Macdonald and Garrett-Jones, amongst others, made substantial contributions to the mathematical theory of VBDs [3,4], including the fundamental appreciation that only a frac-tion of inoculated vectors will survive the extrinsic incubafrac-tion period (sometimes called spo-rogony) of a disease to become actively infectious. The probability of surviving the extrinsic incubation period (EIP) has been most conveniently expressed by assuming that the EIP dura-tion is fixed [3,4]. The epidemiologically important factors in a vector’s life history are its life duration, how many times it bites in its life and how many of those bites are infectious. Varia-tion between vector life histories can be modelled as probabilistic; the difference in outcomes between vectors are modelled as being due to identically distributed chance factors rather than intrinsic variation in vector fitness. This requires estimation of the underlying random distri-butions governing vector life histories. The popularity in the modelling literature of implicitly assuming that relevant distributions are either exponential or fixed length is often due to the popularity of ODE models and mathematical convenience rather than biological motivation. Ross-Macdonald theory has remained very popular amongst mathematical modellers of VBDs. A century after Ross’original mathematical analysis, reviews of the modelling literature reveal that modern analysis still typically uses the majority of the core set of assumptions famil-iar to Ross, Macdonald and Garrett-Jones [5]. This has led to speculation that the entire field could have become‘canalised’implying that there exist equally fruitful avenues of research that are being under-explored due to the popularity of the Ross-Macdonald approach [6]. However, Ross-Macdonald theory is essentially an attempt to think clearly and quantitatively about the vector life events that must occur in the host-to-vector-to-host transmission cycle of VBDs. In particular their theory allows the integration of important entomological information [the vec-tor biting rate (α), vector mortality rate (μ) and the vector population density relative to hosts (M)] with epidemiological data [the vector competence for the given pathogen (V) and the extrinsic incubation period, or inverse incubation rate, (σ−1)] into epidemic metrics for VBDs that give a prediction for transmission intensity. A popular metric is the vectorial capacity (C), first proposed by Garrett-Jones [4], which measures the expected number of future infected hosts due to a single infectious host per day [7].
If we assume the host has mean infectious duration 1/γ, which includes host mortality and possible excess mortality due to disease, and additionally assume that the host is certain to sur-vive its incubation period, then combining vectorial capacity with the mean duration of host infectiousness gives the classical reproductive ratio for the VBD as
Rc
0¼C=g¼ MVa2
gm
expðm=sÞ: ð1Þ
The NTD modelling consortium judged the work acceptable to publish but had no other role in study design, data collection and analysis or preparation of the manuscript.
We use the notationRc
0for the classical Macdonald reproductive ratio for a VBD. However, in relationship to other common definitions ofR0(e.g. [8]) it could equally be described asR20as the square of the geometric mean of two infectious generations: vectors and hosts.Rc
0is a thresh-old quantity for the epidemic; that is if control efforts can induce a situation whereRc
01for a sustained period the VBD must be eradicated [8]. On the other hand, recent analysis [9,10] has suggested that the reproductive ratio for the midge-borne viral disease bluetongue virus (BTV) spreading between a single host population and a single midge species can be expressed as,
R0¼ MVa
2
gm
s
sþm
: ð2Þ
The discrepancy between the two formula is due to the interaction between the lifetime of the vector, modelled as an exponential distribution, and the assumed distribution of the EIP.Rc
0(eq
1) is derived from assuming a constant (fixed) duration EIP, whereasR0(eq 2) is generated by
assuming an exponential distribution as epitomised by ODE models. Despite both models assuming the sameaverageEIP duration (1/σ) and vector life expectancy (1/μ), they predict dif-ferent probabilities of an inoculated (female) vector surviving her EIP and therefore becoming actively infectious. When the incubation rate is much faster than the mortality rate (σμ) the twoR0predictions become identical because the vector is very likely to survive its EIP and
prob-abilistic details become irrelevant. This will not be true for vectors (such as midges and
sand-flies) that are short lived compared to their typical EIP duration.
The classic assumption that the lifetime of a vector is exponentially distributed is equivalent to assuming that it has a constant hazard rate of death. In this we follow Macdonald [11] and argue that due to predation, and other persistent environmental risks to the vector, exponen-tially distributed lifetimes are a reasonable model for many vectors. Constant hazard is proba-bly a more accurate modelling choice for smaller arthropods (with less complex life-histories) such as biting midges or sandflies than compared to their larger cousins such as mosquitos and tsetse flies. Certain populations of the biting midge speciesCulicoides sonorensishave been found to have a lifetime distribution that closely matches exponential, even in a laboratory set-ting where predation pressures and other environmental risks are absent [12]. In addition, field estimates of mortality based on the proportion of parous vectors caught implicitly assume exponential lifetimes (e.g. [13]). For larger arthropods there is stronger evidence of senescence [14], however laboratory studies of this facet represent an upper estimate on the survivorship of arthropods in the natural setting.
We introduce a flexible approach to modelling vector life histories as random events during an individual vector’s life. The random waiting time between bites on hosts is drawn from a general distribution, that does not have to be the standard exponential. The generalisation of the vector biting process to non-exponentially distributed gonotrophic cycle duration defines a renewal process, a standard theoretical model for processes of discrete events [15]. The EIP duration is also allowed to be chosen from an arbitrary positive distribution; the probability of a vector surviving its EIP duration can then be expressed analytically. Combining these two insights we develop a numerical procedure for calculating a generalised reproductive ratio (Rg0), and also an analytic approximation (R~g0) based on the renewal process for biting rate of longer-lived vectors. Given the uncertainty in the forms of these distributions, it is convenient to intro-duce a dispersion scale, which interpolates between thefixed-duration, dispersion-zero, gono-trophic cycle assumptionEq (1)and the exponentially-distributed, dispersion-one,
gonotrophic cycle assumptionEq (2). This approach does not capture all possible distribu-tional choices, but does include the two most popular [eqs(1)and(2)]. We demonstrate that for short-lived vectors these changes have a significant effect on both predicted intensity of VBD transmission and the efficacy of control measures.
Culicoidesgenus biting midges spreading the multi-serotypeorbivirusbluetongue virus (BTV) provide an ideal case study for the theory developed, due to the plethora of entomological and virological data available on the midge-BTV disease complex. BTV causes the economically important bluetongue disease amongst ruminants, both wild animals and commercial livestock, and is in particular associated with severe disease and increased mortality amongst sheep. BTV circulates persistently in Africa, North America, Australia, the Middle east, China, the Indian subcontinent and southern Europe whereverculicoidesmidge species are present. Moreover, the virus has demonstrated epizootic invasion capability into northern Europe (north of 50°N) [16]. In 2006 BTV invaded northern European herds of commercial ruminant livestock for the first time in record, and demonstrated the ability to overwinter before being controlled by mass vac-cination campaigns of over 100 million animals in the subsequent years [17]. The generalised predictions from this paper show that the effort required to achieve eradication by host vaccina-tion or insecticidal spraying can be substantially greater or lower than those offered by classical Ross-Macdonald theory, depending on the assumed underlying distributions. However, we show that wheneverRg0agrees withRc0, the classical approach overestimates the efficacy of reduc-ing vector life expectancy with adulticidal sprayreduc-ing. As experimental knowledge about midge gonotrophic cycles and EIP increases and becomes more detailed [18,19] there should be an concurrent effort from modellers of VBDs to integrate more of this detailed entomology into predictions of disease risk. The theory presented in this paper allows the full distributional infor-mation on the length of gonotrophic cycle and EIP to be integrated into a prediction of trans-mission intensity: this represents a significant development from the classical formulation forR0
[eq (1)] where only information aboutaveragescan be used to estimated disease risk.
Methods
In this section we highlight two processes that combine to determine the reproductive ratio of vector-borne diseases: surviving the EIP and the timing of vector bites. In particular we distin-guish between biting from the vector population in general and infectious bites from long-lived inoculated vectors.
Model overview
define the time between each successful bite until death, and death is assumed to occur at con-stant rateμ(Fig 1). This means that the lifetime biting process of the vector follows a renewal process [15] stopped at the end of the vector’s life. The starting point of the gonotrophic cycles for each vector is taken to be its emergence as an adult. If a vector is inoculated with the patho-gen, then only bites after a random durationE(the EIP) are potentially infectious. The product of the probabilities of transmission from infectious host to vector and from infectious vector to host (the vector competence) is given asV. The classical assumption is that theGnare
exponen-tially distributed (G*exp(α)) andE= 1/σis constant. Here we drop these assumptions and generate ageneralisedreproductive ratio (Rg0) for a single midge species spreading a pathogen amongst a single host species (Fig 1). Assuming that the average host infectious duration is 1/γ, Rg0expressed in explicitly probabilistic terms:
Rg0¼VgE½rate of vector population bites per host
E½# bites after EIP by inoculated vector: ð3Þ
[image:6.612.38.426.76.384.2]The factorisation ineq (3)is appropriate because the future biting of a vector after its inocula-tion can be taken as independent of its past life-history. The probability of a vector surviving its
Fig 1. Reproductive ratio and vector life history examples.The generalised reproductive ratio,Rg
0, is derived by computing the expected number of
vertebrate hosts infected through one complete generation of the parasite due to a single infected host. The average quantities underlyingRg
0depend upon
assumptions on the chance life events of individual vectors. Three example realisations of vector lives are given for three extremal modelling assumptions (Right). 1) The classical model. The vector waits for an exponentially distributed period between bites (circles), once inoculated with the pathogen the vector has afixed latency period (green line) until the end of its EIP after which it makes infectious bites. 2) The constant model. Both the EIP duration and the time between bites arefixed. 3) The Markov model. Both the time between bites and the EIP duration are exponentially distributed. In each case the vector’s life ends with afixed per-capita mortality rate.
EIP duration and the average biting rate over the vector population can be solved in terms of the moment generating functions (MGFs) of the random life-cycle distributions for the vector. The MGF for a random variableXis defined as,
XðyÞ ¼E½expfyXg: ð4Þ
From an entomological modelling perspective the MGF evaluated atθ>0 is the probability of a vector surviving a random period defined byXwhilst undergoing constant mortality rateθ. The two MGFs we will use in our analysis areϕE, the MGF of the EIP duration, andϕG, the
MGF of the gonotrophic cycle duration. Therefore the probability of a vector surviving its EIP,
PE¼EðmÞ: ð5Þ
The classical assumption that the EIP isfixed atσ−1for each inoculated vector in fact leads to the smallest estimate ofPEoveranychoice of distribution for the EIP with average duration
σ−1[eq (15)]; that is the classical estimate is almost certainly an over-estimate for the
propor-tion of inoculated vectors that die before becoming actively infectious.
The average number of bites, or equivalently survived gonotrophic cycles, in the lifespan of a vector is,
E½number of lifetime bites ¼ GðmÞ
1GðmÞ
: ð6Þ
A traditional modelling assumption is that each vector bites according to a Poisson process at rateα(each gonotrophic cycle is exponentially distributed with a mean cycle duration of 1/α) giving a population biting rate per host ofMαwhereMis the vector-to-host population ratio. A convenient feature of modelling vector bites as a Poisson process is that the chance of the vector biting at any moment in time is completely independent of the vector age,a, since emerging as an adult. This is not true in general; it is biologically plausible that having bitten successfully a vector is less likely to bite shortly afterwards, even if the average time between bites remains 1/α. This could be experimentally confirmed by observing that gonotrophic cycles are under-dispersed compared to an exponential distribution. As a consequence vectors of different ages will have different chances of biting: vector age dependence in the model emerges from considering non-exponentially distributed gonotrophic cycles without any assumption on vector senescence. We will demonstrate that for a general choice of gonotrophic cycle distribution the equilibrium biting rate of the vector population upon hosts is the
expected total number of bites made in per vector lifetime divided by the vector life expectancy. This has a concise mathematical expression:
E½rate of vector population bites per host ¼Mm GðmÞ 1GðmÞ
: ð7Þ
Eq (7)is consistent with the classical prediction of biting rating from the vector population in that if the biting process is Poisson (waiting timesGare exponentially distributed) then,
GðmÞ ¼
a
aþm)Mm
GðmÞ 1GðmÞ
¼Ma: ð8Þ
Althougheq (7)holds in general,eq (8)is specific to the Poisson assumption.
A second quantity that is key to calculating the basic reproductive ratio is the expected num-ber of infectious vector bites. Infectious bites are those that occur after the latent EIP duration
an inoculated vector must survive its EIPandany remaining gonotrophic period after its EIP finishes. This implies three key considerations:
1. A significant proportion of inoculated vectors (1−PE;eq (5)) will die before the end of their
EIP and contribute no infectious bites.
2. Inoculated vectors that survive their EIP might still die before they complete their remaining gonotrophic period between the end of the EIP and the vector’s first infectious bite.
3. The remaining period will be typically shorter than a complete gonotrophic cycle. There-fore, an infectious vector that survives its EIP will, on average, achieve more infectious bites than a typical emerging adult vector.
Because a vector’s inoculating bite also initiates its EIP it is possibly to calculateBIexactly
using an integral formula [eq (20)]. We can also approximateBIexplicitly, using the asymptotic
distribution of remaining time until next bite,
E½# bites after EIP by inoculated vector ¼BIEðmÞ
a
m: ð9Þ
The approximation is exact if the gonotrophic cycle is exponentially distributed. Putting Eqs(7)and(9)together gives the generalised reproductive ratio:
Rg0¼MVg mGðmÞ 1GðmÞ
BI; ð10Þ
and the approximate generalised reproductive ratio (R~g0):
~
Rg0¼MV a g
EðmÞGðmÞ 1GðmÞ
: ð11Þ
Eq (11)explains the discrepancy in the introduction. If the EIP duration isfixed atE= 1/σthen
ϕE(μ) = exp{−μ/σ} which recovers the classicalRc0[eq (1)] whereas assuming an exponentially distributed EIP (ϕE(μ) =σ/(σ+μ)) recovers the alternativeR0[eq (2)]. A key point is that the
generalised predictions for the reproductive numberRg0depends on the MGFs of the EIP and gonotrophic cycle. MGFs depend upon the full distribution, thereforeRg0can be estimated using all the information from an entomological study rather than just summary statistics such as mean (or variance) of gonotrophic cycle duration. In Results we will concentrate on gamma distributed durations which are determined by their mean and dispersion around the mean, however there is no theoretical necessity to use these distributions in general.
Vector life duration and survival probabilities
Each vector has an agea, which defines the time since its first gonotrophic cycle was initiated after the end of its juvenile period. After reaching adulthood the vector has a random exponen-tially distributed lifetimeLwith meanE½L ¼1=mdescribed by the probability density function,
fLðaÞ ¼mexpfmag: ð12Þ
from its population at equilibrium is a random variableA. The equilibrium age probability den-sity (fA(a)) can be calculated using themicrocosm principlefor population processes [20] which
states that the proportion of a population in some state is proportional to the mean lifetime an individual would spend in that state. In this case, the microcosm principle gives,
fAðaÞ ¼
PðL>aÞ
E½L ¼mexpfmag: ð13Þ
For exponentially distributed life-times, the equilibrium population density of vector age is equal to the life duration density i.e.fL=fA, but this is not generally true.
After successful inoculation with the pathogen the vector will become infectious after a ran-dom EIP durationEwith density functionfE. The memoryless property of the vector lifetime
distribution implies that the probability of surviving its EIP (PE) is given by the MGF of the
EIP duration evaluated at the vector mortality rate:
PE¼PðL>EÞ ¼ Z 1
0
Z 1
0 1
ðx>yÞmexpfmxgfEðyÞdxdy
¼
Z 1
0
expfmygfEðyÞdy
¼EðmÞ:
ð14Þ
Where1(.) is an indicator function, taking the value 1 if the statement is true or 0 otherwise. Since exp{−μx} is a convex function inxthen Jensen’s inequality gives that foranydistribution ofE(c.f. inequality (2.23) in Klebaner [21]):
PE expfmE½Eg ¼ expfm=sg: ð15Þ
Eq (15)shows that the probability of an inoculated vector surviving afixed EIP is the lowest possible estimate for any EIP distribution.
Vector biting process
Vector biting follows a natural repeating cycle: the vector finds a host to bite at the end of each of its gonotrophic cycles and, once successfully fed, initiates a new gonotrophic cycle which includes locating a suitable oviposition site, oviposition, oogenesis and then subsequent host seeking. We model the gonotrophic cycle durations as a collection of independent and identi-cally distributed (i.i.d) random variables labelledGn, each with a common density function,fG.
The (random) number of bites the vector has managed by agea, denotedB(a), is the same as the number of gonotrophic cycles completed,
BðaÞ ¼ max n:X
n
k¼1 Gka
( )
: ð16Þ
Processes such as this that count the number of i.i.d. waiting periods completed up to a given time are known asrenewal processes, and their probabilistic properties have been extensively analysed [15]. For vectors dying at constant rateμ, the chance of surviving each gonotrophic cycle is independent of the number of cycles survived in the past.Eq (14)gives the probability of a vector surviving its EIP, by exactly the same argument the vector survives each gono-trophic cycle with probabilityϕG(μ) up until its death therefore the lifetime number of bites by
a vector is distributed geometric, with meanϕG(μ)(1−ϕG(μ))−1.
rate per vector is some fixed rateα, independent of the age and time since last bite of the vector, is equivalent to assuming that each gonotrophic cycle is exponentially distribution with average durationE½G ¼1=a. However, we do not need to restrict our attention to this special case. Over a long life duration the elementary renewal theorem [15] gives that the expected bites per unit time will converge on the inverse of the average durationα,
lim
a!1
E½BðaÞ
a ¼a: ð17Þ
Eq (17)potentially explains why it is uncommon in the mathematical epidemiology literature to model epidemic contact processes as general renewal processes, as opposed to Poisson pro-cesses, since if the life time of an individual is long compared to its inter-contact periods a Pois-son process is a reaPois-sonable approximation. However, for short lived vectors this is not true; the average biting rate per vector will crucially depend upon the age distribution amongst the population.
We can now write the average biting rate, denotedα(a), for vectors at ageain terms of probability densities:
aðaÞ ¼X
n1 f n
G ðaÞ: ð18Þ
Wheref n
G is the density function for the sum of gonotrophic cycles Pn
k¼1Gk(see supporting
informationS1 Text). The equilibrium population average biting rate per vector is therefore,
ME½aðAÞ ¼Mm
Z 1
0
expfmagaðaÞda
¼Mm
X
n1
½GðmÞ n
¼Mm GðmÞ 1GðmÞ
:
ð19Þ
Here we have used standard results on the MGF of sums of independent random variables and geometric sums. The equilibrium biting rateE½aðAÞdiffers from the long term biting rateα because of the non-exponentially distributed gonotrophic cycles and the typically short lives of the vector, such that many vectors may die before they seek theirfirst blood meal (Fig 2). Note thatEq (19)implies that in the long life limitE½aðAÞ !airrespective of the gonotrophic cycle distribution, and hence results are independent of the assumed distribution.
Vectors that become inoculated via a bloodmeal from an infectious host have bitten at least once, therefore the population equilibrium biting rate is not appropriate to model their subse-quent biting process. The expected number of future bites by an inoculated vectorafter its EIP, denotedBI, can be calculated directly as,
E½#bites after EIP by inoculated vector ¼BI ¼ Z 1
0 P
ðL>tÞPðEtÞaðtÞdt: ð20Þ
That is the expected infectious bites from an inoculated vector are due to the aggregate of the biting rate at all timestafter the inoculating bite, weighted by both the probability that the vec-tor is still alive at that time and has completed its EIP (Fig 3).Eq (20)is numerically solvable using thatα(•) is the rate of change of the solution to the renewal equation with waiting time distributionG(see supporting informationS1 Text). Probabilistically, the exact value forBIis
only the small proportion of vectors that are by chance comparatively long-lived contribute to BIwhen the EIP is typically longer than life expectancy. Therefore it can be argued that the
asymptotic biting rateα(eq 17) is appropriate for such vectors conditional on having survived their EIP, i.e.
BIPE
a
m¼EðmÞ
a
m: ð21Þ
Eq (21)is exact when the gonotrophic cycle durations are exponentially distributed. In the sup-porting information we make the argument forEq (21)as a general approximation toEq (20)
more rigorous by considering the long-time distribution of remaining time after the EIP until next bite. We also consider the special case of each gonotrophic cycle being offixed, rather than random, duration (S1 Text).
Results
We are now in a position to consider the numerical values associated with the quantities for-mulated above, and consider how they are influenced by the assumed distributions for the length of the gonotrophic cycle and the extinsic incubation period. In particular, we consider the value of the generalised reproductive ratio (Rg0) using parameters suitable for bluetongue virus spreading between cattle viaCulicoidesgenus biting midges. Due to the relative ease by which it can be colonised in a laboratoryC. sonorensishas become an ideal biological model species for VBDs spread by midges. There exist laboratory andfield studies on its mean gono-trophic cycle duration [22,24], mortality rate [12,13] and a distributionalfit for the EIP of BTV within the midge host [19]. Each of these quantities are sensitive to temperature, so throughout we use the values associated with vector activity at 20°C as illustrative of the theory developed above. Seetable 1for a summary of values and functions.
[image:11.612.45.510.77.269.2]In general estimating the reproductive ratio for vector-borne diseases directly from entomo-logical parameters has been problematical, and such estimates often differ strongly from
Fig 2. The effect of dispersion on the important epidemiological quantities in VBDs.The equilibrium average biting rate per midge (left), the probability of an inoculated midge surviving its EIP (right) forCulicoidesgenus midges. The mortality rate isμ= 0.22 per day (Culicoidesgenus midge mortality rate at 20°C [13]), the asymptotic biting rateα= 0.18 per day (Culicoidesgenus midge inverse mean gonotrophic cycle duration at 20°C [22]), mean EIPσ−1= 8.4 days (the posterior median forCulicoidesgenus midge mean EIP duration [19]). The red dots indicate the results derived from the classical Ross-Macdonald assumptions, other colour dots represent EIP dispersion estimates in the literature: BTV-1 spread byC. bolitinosmidges [19] andTrypanosoma brucei brucei
spread by tsetse flies [23]. Each quantity is found to be increasing with increasing dispersion.
estimates derived from analysing equilibrium inoculation rates (c.f. [25]). In particular, the vec-tor to host ratioMis in practise very difficult to estimate. To avoid these issues we present our results in terms of a relative reproductive ratio (Rrel), which is the ratio between the generalised
reproductive number,Rg0, and the classical reproductive number,Rc
[image:12.612.206.542.74.422.2]0, given byEq (1), as this
Fig 3. Relative reproductive ratio and expected biting from infected vectors.The generalised reproductive ratio for bluetongue virus relative to its classical estimateðRg
0=Rc0Þfor a range of dispersions (dG, dE) (top left) and the relative error of the analytic approximationðR~g
0=Rg0) (top right) calculated using the same
parameters as inFig 2(i.e. for midge life histories assuming a constant 20°C temperature). The lower parameter sets (middle/bottom, left and right) give illustrations of the expected life histories of inoculated midges at indicated dispersion parameters. The greyfilled curve gives the expected biting rate of midges at each time after the inoculating bite conditional on their survival; the total grey area up to that time is the expected number of bites by the surviving midge. The expected number of actively infectious bites per inoculated midge (BI) is calculated by integrating over the biting rate re-weighted at each time by the survival probabilityPðL>tÞ(blue curve; right hand axis) and the incubation probabilityPðEtÞ(upper bars; green indicating a low probability and red indicating a high probability). The biting rate predicted by modelling bites as a Poisson process (dG= 1) is shown (red curve). Low dispersion in gonotrophic cycles (parameter sets A, C) predicts that inoculated midge biting is expected to peak around multiples of the average gonotrophic cycle length (α−1= 5.5 days) whereas higher dispersion (parameter sets B,D) predicts rapid convergence to the Poisson process biting rate. Low dispersion in EIP predicts a sharp transition at which virtually all inoculated midges will become infectious (parameter sets C,D). In general, higher dispersion favours transmission however the details can be important. The approximationR~g
0is accurate for all values ofdEonly
whendG>0.5, otherwiseR~g
relative quantity depends only onμand the distributions ofGandE,
Rrel¼
Rg0 Rc
0
¼ m2GðmÞBI
ð1GðmÞÞa2expðm=sÞ
: ð22Þ
We note that the classicalRc
0is an estimate derived by assuming constant biting rates per midge andfixed EIP durations, for example [26]. An additional benefit of consideringRrelis
that additional factors such as the contribution due to heterogeneous biting (c.f. [27]) are can-celled out. Determining the distribution of a random period is notoriously difficult so it is con-venient to re-express the generalised reproductive ratio in terms of moments ofGandE, and in particular focus on dispersion as a simple measure.
Dispersion and
R
0for VBDs spread by midges
Using a gamma distribution to interpolate between exponentially distributed (when the gamma shape parameter is 1) and constant periods (when the gamma shape parameter diverges to infinity with fixed gamma mean) is a common modelling choice due to its compar-ative simplicity and flexibility with a pedigree in epidemic modelling [28]. The dispersion of a gamma distributed random variableX,dX, is defined as,
dX¼
VARðXÞ
E½X2 : ð23Þ
The dispersion of the random periodXinterpolates betweenfixed (dX= 0) and exponential (dX
= 1), it is also possible for a duration to be over-dispersed (dX>1) but we restrict attention to
under-dispersal in this work. The dispersion is also usefully incorporated into the MGF of a
gamma distributed random variableX:
XðmÞ ¼ ð1þmE½XdXÞ
1=dX: ð
24Þ
[image:13.612.36.568.89.297.2]ModellingEandGas gamma distributed with dispersions,dEanddGrespectively allows us to Table 1. Parameters and functions for generalised VBD model.
Description Symbol Estimate or
range
Comments
MGF of random variable X ϕX(θ) - XðyÞ ¼E½expfyXg
Mean biting rate at age/time since inoculating bitea
α(a) - ais used for age since emergence (biting from susceptible vectors),tis used for time since inoculating bite (biting from infectious vectors)
Asymptotic biting rate α 0.18 per day Culicoidesgenus biting midges at 20°C temperature [22,24] Vector per capita mortality rate μ 0.22 per day Culicoidesgenus biting midges at 20°C temperature [13]
Incubation rate of pathogen σ 0.12 per day Culicoidesgenus biting midges at 20°C temperature [19] Age of vector chosen at random
from population
A 0–1 Density function
fA(a) =μexp{−μa} Random life span of a vector L 0–1 Density function
fL(l) =μexp{−μl} Random duration of gonotrophic
cycle
G 0–1 Density functionfG,Gis gamma distributed with mean 1/αand dispersiondG.
Random duration of EIP E 0–1 Density functionfE,Eis gamma distributed with mean 1/σand dispersiondE. Dispersion of gonotrophic cycle dG 0–1 dG¼VARðGÞ=E½G2
calculate the population average biting rate per host and probability of surviving its EIP as
ME½aðAÞ ¼Mm 1þmdG
a
1=dG
1 !1
; ð25Þ
and
PE ¼ 1þ
mdE
s
1=dE
ð26Þ
respectively. The mortality rate, mean gonotrophic cycle duration and mean EIP duration for BTV are all strongly temperature dependent forC. sonorensiswith the reproductive ratio being maximal at around 20–25°C [9]. At 20°C, using realistic parameters, only a minority of midges are expected to survive theaverageEIP duration of BTV; the chance long-lived tail of the midge population are the sole contributors to the outbreak. However, the actual survival proba-bility for the EIP varies from the 15.6% survival (dE= 0; the classical assumption that all EIP
durations are identical) to 35.0% survival (whendE= 1). The population averaged biting rate
per midge is similarly sensitive, and varies from 0.18 bites per midge per day (dG= 1; the
classi-cal assumption that the gonotrophic cycle is exponentially distributed) to 0.09 bites per midge per day (dG= 0) (Fig 2).
Turning our attention to the relative reproductive ratio (Rrel), and using the numerically
exact form ofBI(eq (20)andFig 3), we find that this increases with increasing dispersion of
either distribution. As such, the reproductive ratio is maximised by both distributions being exponential (Rrel= 2.24) and is lowest when both are fixed (Rrel= 0.50) (Fig 3). The classicalRc0 for BTV can therefore be either a significant overestimate or a significant underestimate com-pared to the true prediction that accounts for dispersion.
The approximateR~g0is exact when the midges are expected to bite according to a Poisson process (dG= 1). Whenever the gonotrophic cycle duration has high dispersal (dG>0.5) the
approximate reproductive ratio is a good estimate across the entire EIP dispersion range (Fig 3). HoweverR~g0can be both an underestimate or an overestimate ofRg0whendG<0.5
depend-ing on an complex interplay between the distributions ofEandG. In particular, when the EIP duration is nearly exponential (dE1) and the gonotrophic cycle is under-dispersed (dG<
0.5), with the worst relative error beingR~g0=Rg0¼1:21when (dE= 1,dG= 0). This can be
under-stood through the failure of the assumption that only chance long-lived midges with biting rates well approximated by the asymptotic rateαsurvive their EIP.
Controlling VBDs spread by midges
The most important feature of the reproductive ratio as a measure of transmission intensity is that it yields a threshold quantity for disease persistence, and hence provides a quantitative insight into control. If an agency tasked with disease control can cause the reproductive ratio to fall below unity for an extended period of time then eradication can be achieved locally. One method for reducing the reproductive ratio is by vaccinating the host population; in the case of BTV there was a mass vaccination of northern European cattle during 2008 which was ulti-mately effective at eliminating BTV incidence in northern Europe. However, a vaccine for a novel or unexpected strain might not be immediately available, as occurred in northern Europe in 2006 which was invaded by BTV-8 serotype rather than the BTV-2 or BTV-4 serotypes which circulate in southern Europe [17], in which case other control measures need to be considered.
Wide-spread application of insecticide around a farm has not been recorded as successfully causing significant local midge population reduction [29], but it has been suggested that targeting spraying of an insecticide with long residual life in proximity to cattle might be more successful [30]. To model the effect of such insecticide spraying proximate to cattle we assume that the midge mortality is increased by an excess mortalityμebut the overall midge to host ratio (M)
remains unchanged, due to the inability to target the entire midge population. If we make the classical assumptions (dE= 0,dG= 1), then the critical excess mortality (mc) required to achieve
eradication can be determined as the solution to:
MVa2 gðmþmcÞ
expððmþmcÞ=sÞ ¼1: ð27Þ
This is derived fromeq (1), by including the excess mortality and insisting that the resultant reproductive ratio is one.
For disease control using vaccination there is a simple relationship between the critical vac-cination coverage of hosts and the reproductive ratio; such that the critical vacvac-cination cover-age amongst hosts implied by a classical estimateRc
0is11=Rc0. For eradication via increasing midge mortality the relationship between the critical excess mortality and the reproductive ratio estimateRc
0derived using the classical assumptions (e.g. [26]) solves, m
mþmc expfmc=sg ¼ 1
Rc
0:
ð28Þ
Note thatmcdepends on the reproductive ratio estimateRc
0, the midge mortality rateμand the incubation rateσin contrast to the critical vaccination coverage of hosts which depends only onRc
0. A natural consideration is the effect that generalising the distribution of the EIP and the gonotrophic cycle durations has upon the predicted critical excess mortality or critical vaccina-tion coverage needed for eradicavaccina-tion.
We begin by considering excess mortality and assume that we have access to a classical esti-mate of the pre-control reproductive ratioRc
0. In the generalised setting, the midge population biting rate depends on the precise nature of the excess mortality so we consider two separate scenarios:
• Scenario 1: The insecticidal spray increases the mortality rate of midges that have successfully fed on cattle, which are assumed to remain nearby these hosts,andit also reduces biting from the susceptible midge population by increasing their per capita mortality. This implies that the critical excess mortality (me) is the solution to:
ðmþmeÞGðmþmeÞ
að1GðmþmeÞÞ
mBIðmþmeÞ
aexpðm=sÞÞ¼
1
Rc
0:
ð29Þ
• Scenario 2: The insecticidal spray increases the mortality rate of midges that have successfully fed on cattle, which remain nearby these hosts,but it does notreduce biting from the suscep-tible midge population which have yet to be affected by the insecticide. This implies that the critical excess mortality (me) solves the following equation:
mGðmÞ
að1GðmÞÞ
mBIðmþmeÞ
aexpðm=sÞÞ¼
1
Rc
0:
WhereBIðmþmeÞis the expected number of bites after its EIP by a midge undergoing excess
mortalityme. It should be noted that Eqs(29)and(30)are defined in terms of an estimate of the reproductive ratio based on classical assumptions, which can be related to a generalised reproduc-tive ratio viaEq (22). For either control scenario calculating an approximate critical excess mortal-ity (m~e) by using the approximate expression forBIEq (21)is significantly easier numerically. The
quality of the analytic approximation to the critical excess mortality has similar dependency on the dispersion parameters as the approximate reproductive ratioR~g0: the approximation is broadly good whendE<0.5 or when the gonotrophic cycle is more dispersed than the EIP (S1 Fig).
The classical formulation of the reproductive ratioEq (1)suggests that increasing the mortal-ity rate of vectors could be an effective control strategy sinceRc
0decreases faster than exponen-tially with increasingμ. In the generalised setting this is not necessarily true; the sensitivity ofRg0 toμcan be sub-exponential, implying that increasing vector mortality is less effective at reducing the proportion of inoculated vectors expected to survive their EIP than the classical prediction would predict. On the other hand, in the generalised setting the mean vector population biting rate can decrease with increasingμ; an effect that reduces transmission and which is absent from the classical Ross-Macdonald model. In fact, the generalised critical value,me, can be either
greater or less than the value implied by the classical assumptions (mc) derived from solvingEq
(28), with the relative critical excess mortality (mrel¼me=mc) increasing for both increasingdG
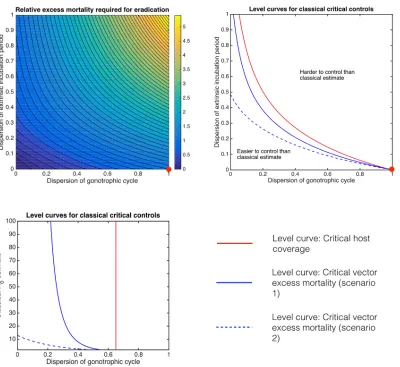
anddE(Fig 4). Unsurprisingly, the parameter region where control using spraying is expected to
be harder than the classical prediction (i.e.mrel>1Þis larger for scenario 2, which is more
pessi-mistic about the efficacy of insecticidal spraying than scenario 1 (Fig 4). Because the critical vacci-nation coverage can be expressed as depending only on the reproductive ratio, the curveRrel= 1
separates the region where it is more difficult from the region where it is less difficult to eradicate using host vaccination than the classical prediction. However, theRrel= 1 curve is not identical to
the curve defined bymrel¼1(Fig 4). This has an important consequence, even ifR g
0 ¼Rc0(i.e. the critical host vaccination coverage is the same even when accounting for the distributions) then the critical amount of excess mortality that insecticide based control must achieve in order to eradicate may be different depending on the distributions. In fact, forculicoidesbiting midges the amount of necessary insecticide control predicted using classical assumptions is an underestimate everywhere along theRrel= 1 level curve for scenario 1, and the underestimation is even more
dramatic for scenario 2. In fact, whenever the generalised reproductive ratio and the classical reproductive ratio coincide, the classical model is always overly optimistic about the how little excess mortality will be required to achieve eradication. This is true for both varying (dG,dE) for
a BTV epidemic with the classical estimateRc
0¼2and whenfixingdE= 0.130 (the median
poste-rior estimated dispersion for the EIP ofC.bolitinosinfected with BTV-1 serotype [19]) allowing
ðRc
0;dGÞto vary (Fig 4). However, it should be noted that there is an appreciable region of
param-eter space where eradication is easier to achieve than expected using classical modelling assump-tions. IfdGis sufficiently small then in most cases we predict that it could be easier to eradicate
via increasing adult vector mortality than predicted by classical modelling. Whether thefindings of this paper are optimistic or pessimistic with regard to insecticidal spray efficacy will ultimately be resolved by more detailed data on biting vector gonotrophic cycle dispersion.
Discussion
Modelling mortality associated with vector biting and the first gonotrophic
cycle
subsequent cycles. An alternative is to explicitly include heightened mortality risk associated with vector activities such as host-seeking or oviposition as has been done in modelling papers of mosquito-borne diseases (e.g. [31]). Introducing additional risk of vector mortality immedi-ately before and after biting modifies the time-dependent biting rateα(•) by incorporating the chance that biting leads to vector death.α(•) is the solution to a modified renewal equation and therefore introducing this extra model component represents no extra difficulty compared to only having background mortality (seeS1 Text).
[image:17.612.42.442.73.440.2]Many midge species are autogenous: their females emerge as adults ready to produce and oviposit an initial egg batch without a bloodmeal [32]. From an midge ecology perspective this allows the midge population to persist even when hosts are frequently absent. Therefore, from an epidemiological perspective the waiting time until the first bite from a female autogenous
Fig 4. Critical control effort relative to classical predictions.The relative excess mortality that would be required to control BTV using insecticides compared to its classical valuemrel¼me=mcgivenRc
0¼2(top left). The red dot indicates the classical Ross-Macdonald prediction. The environmental
temperature is assumed to be a constant 20°C giving the same parameters as inFig 2. The critical excess mortality required to achieve eradication using insecticides as predicted by classical assumptions can be either an underestimate or an overestimate. Tracing the level curves from the classical value for critical vaccination coverage (Rrel¼R
g
0=Rc0¼1; red curves) and critical excess mortality (mrel¼1; blue curves) separates the (dG,dE) plane into regions where
control is more or less difficult compared to the classical value for both cattle vaccination and insecticide spraying. Two scenarios for the efficacy of spraying are considered: where the excess mortality reduces the population biting rate as well as reducing the life expectancy of inoculated vectors (solid blue curves) or if it solely decreases the life expectancy of inoculated vectors (dashed blue curves). ForfixedRc
0¼2(top right) andfixeddE= 0.130 (based onC. bolitinos
inoculated with BTV-1 serotype [19];bottom) the level curve forRrel= 1 is distinct from the level curveμrel= 1.
midge on a host occurs at the end of the second gonotrophic cycle. This possibility can be included in our model since we base our analysis on renewal theory: renewal processes with an initial waiting period that is different from subsequent waiting periods (known as delayed renewal processes [15]) are theoretically standard (S1 Text).
We did not explore these biologically motivated modelling extensions further due to our focus on bluetongue diseases spread byCulicoidesgenus biting midges; current best estimates of midge mortality in the wild are based on estimates of the proportion of parous midges in the population [13]. This gives an estimate of the mortality rate based on the probability of surviv-ing a gonotrophic cycle which cannot be disentangled into separate hazards. Moreover, no autogenous midge species has been implicated in the transmission of any arbovirus, including bluetongue [32].
Concluding remarks
The classical Ross-Macdonald theory of VBDs created a critically important scientific frame-work with a measure of generational transmission intensity (R0) at its heart. However the
spe-cific practical insights derived from the Macdonald reproductive ratio (for example the implied efficacy of increasing the mortality rate of adult insect vectors in reducing transmission) are undermined by the growing realisation amongst epidemiologists of mosquito-borne diseases that different methods for estimatingR0produce strongly differing results (cf.Smithet alfor a
discussion on the problems associated with validation of the mathematical theory of mosquito-borne pathogens [6]). The problems with theoretic cross-validation appear to have not been explicitly stated in the literature of midge-borne pathogens but the issues are essentially similar. In summary, it has become generally accepted in the modelling community that, whilst all models are simplifications of reality, the classical simplifications of Ross-Macdonald theory may produce misleading results (cf.recent reviews [5,6]). The development of mathematical models of VBDs that deviate from Ross-Macdonald theory has generally focused on heteroge-neity in transmission, whether due to heterogenous distribution of vectors across space, for example the recent northern European outbreak of BTV has inspired a number of explicitly spatial models (for example [33–35]), or because of the observation that (typically) a dispro-portionately greater number of bites will be distributed across a small number of vertebrates (as discussed in [26]). It seems that questions about the role of chance in generating variation in life histories between vectors, even if they are otherwise identical from a modelling perspec-tive, has been largely overlooked despite being in principle empirically observable in the labora-tory setting.
the timing of epidemiological relevant contacts, (e.g.successful bites) are overwhelmingly mod-elled as a Poisson process throughout the mathematical modelling literature. We show that the generalisation of the contact model from a Poisson process to a renewal process, in conjunction with the typically short lives of the vector and a general EIP duration, has significant effects on the basic predictions of an otherwise standard VBD model.
The more general modelling of the vector’s biting process as a renewal process, and the EIP duration as non-constant, predicts that the classical reproductive ratio can be either a signifi-cant overestimate or underestimate compared to the generalised prediction. Moreover, the gen-eralised modelling approach cannot be disentangled from considerations of the age
distribution of the vector population. However, by assuming that the population is at equilib-rium and making theoretically well-motivated approximations (as well as assuming constant mortality rates) we are still able to present the dependence ofR0on the entomological situation
in an explicit manner. For the motivating case of midges spreading BTV, the reproductive ratio is increasing with increasing variation in either the latency (EIP) duration or the time between bites (gonotrophic cycle). This can be understood by considering two consequences of the short life-span of the‘typical’midge: firstly, a significant proportion of midges can die whilst their expected biting rate is low (due to relaxing the Poisson biting process assumption) and secondly, that the‘typical’midge inoculated with BTV will not survive her EIP (which can depend sensitively on the EIP distribution). Only the‘tail’of the inoculated midge population actively contribute to BTV incidence amongst hosts, and therefore random variation between vector life history events becomes a crucial factor. In particular, the potential importance of the precise details about the distribution of the gonotrophic cycle duration seems to be under-rec-ognised in both the theoretical and entomological literature. These findings echo results from at least one other model which generalises the vector biting process [36] and suggests that greater effort must be devoted to understanding and quantifying the detailed vector biology both at the individual and population levels in order to accurately parametrise these kinds of models.
The popularity ofR0as a metric of transmission intensity is in a large part due to its
uncom-plicated relationship with disease eradication: ifR0can be reduced below unity for a sufficient
period of time then the disease must be eradicated. The generalised prediction ofR0presented
insecticidal spraying should not be used as a control measure against a vector-borne disease in any circumstance. It might well be the case that a vaccine for hosts might be unavailable or pro-hibitively expensive whereas a suitable, and safe, insecticide might be readily available and cheap.
An intriguing possibility is to target the older vectors that make up the tail of the age profile using late life acting insecticides (LLAIs). This has been suggested for controlling malaria so that evolutionary pressure on the mosquito population to develop insecticidal resistance is sharply diminished [37]. Modelling the EIP as random rather than fixed always favours vector survival of EIP [eq 15]. This implies that more‘young’inoculated vectors will be actively infec-tious than expected by a model with a fixed EIP; a pessimistic finding with respect to the effi-cacy of LLAIs whether the LLAI is effective after a delay since exposure or simply preferentially affects older vectors. An advantage of the modelling approach taken in this work is that the action of the LLAI can be explicitly age-dependent or dependent upon real time since exposure. In Readet al[37] the action of the LLAI on the vector is modelled as occurring after a number of vector gonotrophic cycles. However, the age of a vector after a number of gonotrophic cycles is uncertain due to variation in the cycle duration. Therefore, experimental data on age-depen-dent (or time delayed) LLAI efficacy might be difficult to interpret in the context of a model which focuses only on the number gonotrophic cycles a vector survives. Our modelling approach doesn’t suffer from this problem and experimental data on LLAIs could be integrated into our model directly. This would certainly be an interesting direction for future research.
Mathematical models are now commonly used to underpin policy decisions concerning dis-ease control in both developed and low- and middle-income countries. We have used BTV which affects livestock spread byCulicoidesgenus midges as a motivating example. However,
the methodology could equally apply toLeishmaniain humans spread by sandflies, which have
similar entomological characteristics to midges. Similarly, while mosquitoes do not necessarily match all assumptions within our model, mosquito-borne diseases could be accommodated with only a slight increase in model complexity. Our work has highlighted the sensitivity of model predictions to entomological and epidemiological details. This points to further avenues of applied experimental or observational research: 1) the acquisition of more detailed knowl-edge concerning the life cycles of potential vectors, in particular going beyond the measure-ment of simple averages to include variability; 2) studies of the life expectancy and age profiles of vector populations in the wild; 3) a more comprehensive investigations of the response of vector populations to insecticide-based control measures. Developing highly informative pol-icy-relevant prediction for the future control of vector-borne diseases is likely to therefore require a combination of state-of-the-art models, with meticulous quantitative studies of the insect vector.
Supporting Information
S1 Text. Mathematical details on the biting renewal process and the expected number of potentially infectious bites by a vector after its inoculating bite.This gives further results on renewal processes as well as further discussion on the approximate form for the expected num-ber of infectious bites per inoculated vector (BI). Also included is a numerical scheme for
com-putingBIdirectly for both when the inter-bite durations are random and fixed.
(PDF)
S1 Fig. Relative error of the generalised critical excess mortality to its analytic approxima-tion.The classical reproductive ratio estimate given isRc
0 ¼2. For a large portion of parameter space the critical excess mortality relative to its analytic approximation is reasonably accurate (me=m~e1). As with the approximationR~
g
and more dispersed than the gonotrophic cycle the analytic approximation is less successful due to the failure of the assumption that the expected biting rate of vectors which survive their EIP is well represented by their limiting rateα. Also, there is a small region arounddE= 0,dG= 0
whereme¼0andm~eOð10
3Þ.
(EPS)
Acknowledgments
We would like to acknowledge the entomological insight of C. J. M Koenraadt and our many useful discussions with him on the subject of midge biology.
Author Contributions
Conceived and designed the experiments: SPCB MJK. Performed the experiments: SPCB. Ana-lyzed the data: SPCB KSR MJK. Contributed reagents/materials/analysis tools: SPCB KSR MJK. Wrote the paper: SPCB KSR MJK.
References
1. Ross R. An application of the theory of probabilities to the study of a priori pathometry. Part I. Proceed-ings of the Royal Society of London Series A. 1916; 92(638):204–230. doi:10.1098/rspa.1916.0007 2. Ross R. The prevention of malaria. Murray, London; 1911.
3. MacDonald G. The epidemiology and control of malaria. Oxford University Press; 1957.
4. Garrett-Jones C. Prognosis for Interruption of Malaria Transmission Through Assessment of the Mos-quito’s Vectorial Capacity. Nature. 1964; 204:1173–1175. doi:10.1038/2041173a0PMID:14268587 5. Reiner RC, Perkins TA, Barker CM, Niu T, Chaves LF, Ellis AM, et al. A systematic review of
mathemat-ical models of mosquito-borne pathogen transmission: 1970–2010. Journal of the Royal Society Inter-face. 2013 Jan; 10(81):20120921. doi:10.1098/rsif.2012.0921
6. Smith DL, Perkins TA, Reiner RC, Barker CM, Niu T, Chaves LF, et al. Recasting the theory of mos-quito-borne pathogen transmission dynamics and control. Transactions of the Royal Society of Tropical Medicine and Hygiene. 2014 Mar; 108(4):185–197. doi:10.1093/trstmh/tru026PMID:24591453 7. Garrett-Jones C, Shidrawi GR. Malaria vectorial capacity of a population of Anopheles gambiae: an
exercise in epidemiological entomology. Bulletin of the World Health Organization. 1969; 40(4):531. PMID:5306719
8. Diekmann O, Heesterbeek J, Metz JA. On the definition and the computation of the basic reproduction ratio R 0 in models for infectious diseases in heterogeneous populations. Journal of Mathematical Biol-ogy. 1990; 28(4):365–382. doi:10.1007/BF00178324PMID:2117040
9. Gubbins S, Carpenter S, Baylis M, Wood JLN, Mellor PS. Assessing the risk of bluetongue to UK live-stock: uncertainty and sensitivity analyses of a temperature-dependent model for the basic reproduc-tion number. Journal of the Royal Society Interface. 2008 Mar; 5(20):363–371. doi:10.1098/rsif.2007. 1110
10. Turner J, Bowers RG, Baylis M. Two-Host, Two-Vector Basic Reproduction Ratio (R0) for Bluetongue.
PLoS One. 2013; 8(1):e53128. doi:10.1371/journal.pone.0053128PMID:23308149
11. MacDonald G. The analysis of the sporozoite rate. Tropical diseases bulletin. 1952 Jun; 49(6):569– 586. PMID:14958825
12. Lysyk TJ, Danyk T. Effect of temperature on life history parameters of adult Culicoides sonorensis (Dip-tera: Ceratopogonidae) in relation to geographic origin and vectorial capacity for bluetongue virus. Jour-nal of Medical Entomology. 2007; 44(5):741–751. PMID:17915503
13. Gerry AC, Mullens BA. Seasonal abundance and survivorship of Culicoides sonorensis (Diptera: Cera-topogonidae) at a southern California dairy, with reference to potential bluetongue virus transmission and persistence. Journal of Medical Entomology. 2000; 37(5):675–688. doi:10.1603/0022-2585-37.5. 675PMID:11004778
14. Styer LM, Carey JR, Wang JL, Scott TW. Mosquitoes do senesce: departure from the paradigm of con-stant mortality. The American journal of tropical medicine and hygiene. 2007; 76(1):111–117. PMID:
17255238
16. Sperlova A, Zendulkova D. Bluetongue: a review. Vet Med. 2011; 56:430–452.
17. Zientara S, Sánchez-Vizcaíno JM. Control of bluetongue in Europe. Veterinary microbiology. 2013 Jul; 165(1–2):33–37. doi:10.1016/j.vetmic.2013.01.010PMID:23462519
18. Carpenter S and Mordue W. Oogenesis and laboratory survival in the Scottish biting midge Culicoides impunctatus. Physiological Entomology. 2006; 31: 89–93.
19. Carpenter S, Wilson A, Barber J, Veronesi E, Mellor P, Venter G, et al. Temperature Dependence of the Extrinsic Incubation Period of Orbiviruses in Culicoides Biting Midges. PLoS One. 2011 Nov; 6(11): e27987. doi:10.1371/journal.pone.0027987PMID:22125649
20. Mollison D. The structure of epidemic models. In: Mollison D, editor. Epidemic models: their structure and relation to data. Cambridge University Press p. 17–33; 1995.
21. Klebaner FC. Introduction to Stochastic Calculus With Applications. 2nd ed. Imperial College Press; 2005.
22. Mullens BA, Gerry AC, Lysyk TJ, Schmidtmann ET. Environmental effects on vector competence and virogenesis of bluetongue virus in Culicoides: interpreting laboratory data in a field context. Veterinaria italiana. 2004; 40(3):160–166. PMID:20419655
23. Dale C, Welburn SC, Maudlin I, Milligan PJ. The kinetics of maturation of trypanosome infections in tsetse. Parasitology. 1995 Aug; 111 (Pt 2):187–191. doi:10.1017/S0031182000064933PMID:
7675533
24. Mullens BA, Holbrook FR. Temperature effects on the gonotrophic cycle of Culicoides variipennis (Dip-tera: Ceratopogonidae). Journal of the American Mosquito Control Association. 1991 Dec; 7(4):588– 591. PMID:1787404
25. Dietz K. The estimation of the basic reproduction number for infectious diseases. Statistical methods in medical research. 1993 Mar; 2(1):23–41. doi:10.1177/096228029300200103PMID:8261248 26. Smith DL, McKenzie FE, Snow RW, Hay SI. Revisiting the Basic Reproductive Number for Malaria and
Its Implications for Malaria Control. PLoS Biology. 2007; 5(3):e42. doi:10.1371/journal.pbio.0050042
PMID:17311470
27. Dietz K. Models for Vector-Borne Parasitic Diseases. In: Vito Volterra Symposium on Mathematical Models in Biology. Berlin, Heidelberg: Springer Berlin Heidelberg p. 264–277; 1980.
28. Wearing HJ, Rohani P, Keeling MJ. Appropriate models for the management of infectious diseases. PLoS Medicine. 2005; 2(7):e174. doi:10.1371/journal.pmed.0020174PMID:16013892
29. Satta G, Goffredo M, Sanna S, Vento L, Cubeddu GP, Mascherpa E. Field disinfestation trials against Culicoides in north-west Sardinia. Veterinaria italiana. 2004 Jul; 40(3):329–335. PMID:20419688 30. Carpenter S, Mellor PS, Torr SJ. Control techniques for Culicoides biting midges and their application
in the U.K. and northwestern Palaearctic. Medical and Veterinary Entomology. 2008 Sep; 22(3):175– 187. doi:10.1111/j.1365-2915.2008.00743.xPMID:18816267
31. Cator L J and Lynch P A and Thomas M B and Read A F. Alterations in mosquito behaviour by malaria parasites: potential impact on force of infection, Malaria Journal. 2014 May; 13:164. doi:10.1186/ 1475-2875-13-164PMID:24885783
32. Purse B V and Carpenter S and Venter G J and Bellis G and Mullens B A. Bionomics of Temperate and Tropical Culicoides Midges: Knowledge Gaps and Consequences for Transmission of Culicoides-Borne Viruses. Annual Review of Entomology. 2015; 60(1) 373–392 doi: 10.1146/annurev-ento-010814-020614PMID:25386725
33. Szmaragd C, Wilson AJ, Carpenter S, Wood JLN, Mellor PS, Gubbins S. A Modeling Framework to Describe the Transmission of Bluetongue Virus within and between Farms in Great Britain. PLoS One. 2009 Nov; 4(11):e7741. doi:10.1371/journal.pone.0007741PMID:19890400
34. Græsbøll K, Bødker R, Enøe C, Christiansen LE. Simulating spread of Bluetongue Virus by flying vec-tors between hosts on pasture. Sci Rep. 2012 Nov; 2. doi:10.1038/srep00863PMID:23162689 35. Turner J, Bowers RG, Baylis M. Modelling bluetongue virus transmission between farms using animal
and vector movements. Sci Rep. 2012 Mar; 2. doi:10.1038/srep00319PMID:22432051
36. Rock KS, Wood DA, Keeling MJ. Age-and bite-structured models for vector-borne diseases. Epidem-ics. 2015 Sep 30; 12:20–29. doi:10.1016/j.epidem.2015.02.006PMID:26342239