ISSN: 1816-949X
© Medwell Journals, 2020
Performance Optimization of Bus Rapid Transit in the City of Jogja
Abdul Samad, Harnen Sulistio, Ludfi Djakfar and Achmad Wicaksono
Program of Civil Engineering, Faculty of Engineering,
Universitas Brawijaya, Malang, Indonesia
Abstract: Indonesia is one of the countries categorized as developing countries with increasing demand for transportation in which the people prefer using private transportation for its convenience and punctuality. Meanwhile, one of the efforts to overcome the problem with public transportation is by operating Bus Rapid Transit (BRT). Indeed, Jogja has a BRT called Trans Jogja. The implementation of Bus Rapid Transit (BRT) itself requires a performance evaluation by exploring the service quality. Strategic priorities for the implementation of Bus Rapid Transit (BRT) management are needed in optimizing the performance of BRT in Jogja. The findings of this study reveal that the better the management of BRT is the more the performance of BRT will directly improve. The better the policy of BRT is the more the performance of BRT will directly improve. The better the quality of BRT management is the more the quality of BRT service will directly improve.The better the policy of BRT is the more the quality of BRT service will directly improve. Improving the quality of BRT management and policy will directly enhance the performance of BRT and indirectly will affect the improvement of the service quality.
Key words: Transportation, Trans Jogja bus, BRT management, implementation, transportation, private
INTRODUCTION
Indonesia is one of the countries categorized as developing countries with increasing demand for transportation (Ofyar, 2000). The number of people moving or being mobile using private transportation and those using public transportation is not sufficiently balanced, so that, transportation problems in Indonesia are quite difficult to solve. Today’s lifestyle has actually created a higher dependence on cars and reduced the need for mass transit. The main factors determining the decline of public transport users are the prosperity of the people, the car availability that continues to get better, the desire to have a house in quiet areas and the government’s policies related to housing and road developments that indirectly encourage the use of private cars (Lumintang et al., 2013).
Urban problems in Indonesia, generally include rapid population growth, extremely high increase of private vehicles, the increase of BBM (fuel) use increased air pollution, supply and demand imbalances, mismatch between modes of transport, high rates of accidents and low mobility efficiency due to the use of land that is not supporting (Ofyar, 2000). The policy of urban public transport is illustrated with the development of public transport modes such as buses called BRT.
In its implementation, Bus Rapid Transit (BRT) needs a performance evaluation by exploring the service quality. Since, the quality of the service is important for the success of Trans Jogja, this study is then conducted in one of BRT organizers which is Jogja.
The province of DIY (The Special Region of Yogyakarta) comprises 4 regencies (Sleman, Bantul, Gunung Kidul, Kulon Progo) and 1 city (Yogyakarta). Urban agglomeration of Yogyakarta area covers all of Yogyakarta city, part of Sleman regency and Bantul regency. The condition and the performance of urban public transport is getting worse; the average LF in 2004 was only 27.22%. Trans Jogja is a bus rapid transit operatingin the city of Jogja. Based on the Department of Transportation (KOMINFO) 2010, there are several problems related to the implementation of Trans Jogja bus which are the lack of bus stops which are too far for the passengers to reach the shelter, the complaints from the users or passengers against the service of Trans Jogja bus and the placement of the bus stop that is quite dilemmatic between the needs and the constraints, i.e., on the one hand, people need it but on the other hand, it is rejected by those who feel that their activities are disrupted. This study is aimed at investigating the strategic priorities of the implementation of Bus Rapid Transit (BRT) management in Jogja.
Definition of bus rapid transit: Bus Rapid Transit (BRT) or busway is a high quality bus based on fast, convenient and low cost transit system for urban mobility by providing pavements for pedestrians, infrastructures, fast and frequent service operations, marketing benefits and distinctions as well as services to the customers (Levinson, 2003). Bus Rapid Transit (BRT) basically
Research
A review of performance improvement of Bus Rapid Trainst (BRT)
Problem identi cation
Research variables
The level of performance and servicee of Bus Rapid Trainst (BRT)
The management of Bus Rapid Trainst (BRT) The policy of providing Bus Rapid Trainst (BRT)
Research instruments (questionnaires)
Detecting respondent (samples are from the population of people in Solo, Yogya,
Semarang)
Data collection (observation, interview,
questionnaires)
Data analysis (descriptive analysis, importance performance analysis and stuctural equation modelling)
Interpretation of the results and discussion
Conclusion, suggestions and recommendations i
emulates the performance characteristics of the modern rail transport system. One BRT system will usually cost 4-20 times less than Light Rail Transit (LRT) and 10-100 times less than the subway train system.
The term BRT has emerged from its implementation in North America and Europe. However, this concept is also transmitted through the world under different names such as:
C High-capacity bus systems C High-quantity bus systems C Metro-bus
C Surface metro C Express bus systems C Busway systems
Although, the term varies from country to country, it has the same basic principles such as: the service quality of the vehicles that compete with other public transport at affordable cost (Lumintang et al., 2013). For convenience, the term BRT or bus way will be used frequently in describing this system. However, it is acknowledged that this concept and system will undoubtedly keep developing. Some literature that can help explain BRT’s definitions is as follows:
“Bus Rapid Transit (BRT) is a flexible mode with rubber tires that has quick transits and combines station (bus stop), vehicles, services, roads and Intelligent Transportation System (ITS) element in an integrated system with strong identity (Jotin and Lall, 2006).
MATERIALS AND METHODS
Analysis method of Quality Function Deployment (QFD): QFD method aims to get priorities for service attributes and technical responses from the users of bus rapid transitby creating house of quality. Before QFD analysis, IPA is firstly done (Sugiyono, 2009).
The application of research variables: The research variables are used to learn the types of services, regulations, policies and the facilities of bus rapid transit in Jogja, Solo and Semarang.
Research samples: The research sample used is
disproportioned stratified random sampling in which the samples are taken randomly from the whole population and stratified even though some of the divisions are less proportional (Levinson, 2003).
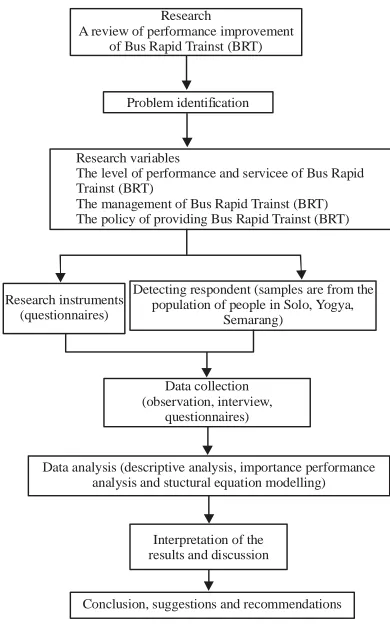
[image:2.612.331.526.93.405.2]Creating research questionnaires: Questionnaires as an instrument of data collection are created based on literature reviews and the needs of the users which are collected through preliminary survey. The questionnaires
Fig. 1: Flow chart of the reseasrh; Personal documents are in the forms of question items comprising BRT’s service attributes with Likert scale as the followings: C Not satisfactory
C Less satisfactory C Fairly satisfactory C Satisfactory
Very satisfactory
Testing the correlation and the consistency in building the house of quality
Correlation test: Correlation test is done to investigate the validity of the questionnaires that will be distributed to the people in the research samples. This test is done to 30 people (Riduwan and Kuncoro, 2008).
RESULTS AND DISCUSSION
The results of analysis and improvement of BRT with
QFD method: The determination of improvement
variable in this research can be done by using analysis tools of Quality Function Deployment (QFD). This QFD analysis process uses the results of IPA analysis that has been previously conducted. The purpose of this analysis is to define and determine the targets of improvement on one quality of Bus Rapid Transit (BRT) service by measuring the value of Own Performance (OP) or technical responses from the management.
The stages of this analysis are first, determining the order of difference of the existing variables (GAP). After GAP analysis is done using service quality, the analysis of quality finction deploymentis then conducted in the next step. One of the important things in QFD is House of Quality (HoQ). The stages in making HoQ are:
C Creating voice of sustomer C Creating a planning matrix C Creating technical responses
Bus Rapid Transit (BRT) in the city of Yogyakarta The analysis of voice of customer: In the analysis of service quality above, it has been concluded that there are several attributes that become the priority based on the order of difference (GAP) starting from the biggest to the smallest in improving the service quality of Bus Rapid Transit (BRT). Table 1 shows the service attributes with high priorities (quadrant I) in order based on the results of data processing using QFD analysis.
Data of voice of customer of bus rapid transit in Yogyakarta priorities for BRT service attributes:
C BRT waiting time C BRT operational time C Health relief measures
C Getting the transport needed after using BRT C The information on BRT integration to the
destination locations
C The officers are polite and friendly as well as well-groomed in giving the service
C Ticketing service C Transport service time
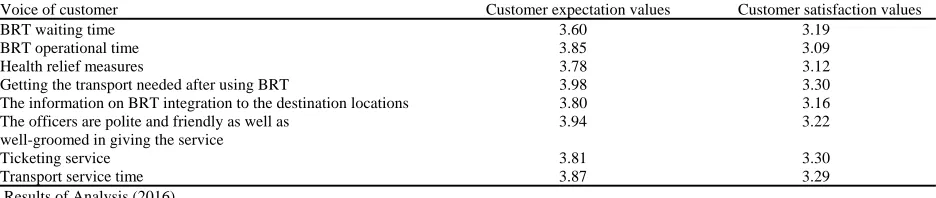
The analysis of planning matrix: The next step in designing house of qualityis the planning matrix. This analysis refers to the value of expectation and satisfaction as follows (Table 2). There are seven sections in the planning matrix, namely.
Importance of Customer (IoC): The value of
importance of customeris obtained from the goal achieved from the average level of expectation divided by the total of all expectation values in each attribute of Voice of Customer (VoC). For example, the calculation of IoC on attribute number 1 resulted in an obtained goal of 3.6. Meanwhile, the overall total of the goal values is 30.63 thus:
Goal 3.6
IoC 0.117
Totalgoal 30.63
[image:3.612.72.540.517.616.2]Customer satisfaction performance: It is the value of the passenger’s perception of how well the services of the alloying mode terminal meet the passenger’s needs. The passenger satisfaction level is obtained from the average perception values. Table 3 shows the complete calculation results of the passenger satisfaction (perception) level.
Table 1: The analysis of planning matrix
Voice of customer Customer expectation values Customer satisfaction values
BRT waiting time 3.60 3.19
BRT operational time 3.85 3.09
Health relief measures 3.78 3.12
Getting the transport needed after using BRT 3.98 3.30
The information on BRT integration to the destination locations 3.80 3.16
The officers are polite and friendly as well as 3.94 3.22
well-groomed in giving the service
Ticketing service 3.81 3.30
Transport service time 3.87 3.29
[image:3.612.74.542.641.723.2]Results of Analysis (2016)
Table 2: The values of customer satisfaction performance of BRT in Yogyakarta
Service attributes The values of customer satisfaction performance
BRT waiting time 3.19
BRT operational time 3.09
Health relief measures 3.12
Getting the transport needed after using BRT 3.30
The information on BRT integration to the destination locations 3.16 The officers are polite and friendly as well as well-groomed in giving the service 3.22
Ticketing service 3.30
Transport service time 3.29
Table 3: The values of goal of BRT in Yogyakarta
Service attributes Values of goal
BRT waiting time 3.60
BRT operational time 3.85
Health relief measures 3.78
Getting the transport needed after using BRT 3.98
The information on BRT integration to the destination locations 3.80 The officers are polite and friendly as well as well-groomed in giving the service 3.94
Ticketing service 3.81
Transport service time 3.87
The Results of Analysis (2016 )
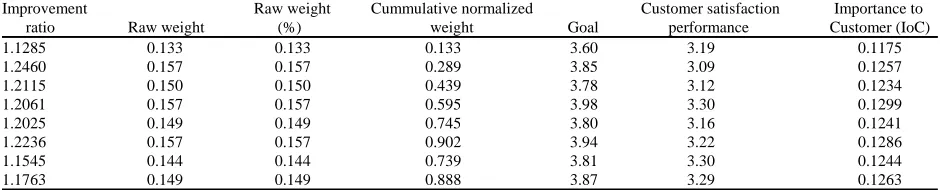
Table 4: Planning submatrix of house of quality of BRT in Yogyakarta
Improvement Raw weight Cummulative normalized Customer satisfaction Importance to ratio Raw weight (%) weight Goal performance Customer (IoC)
1.1285 0.133 0.133 0.133 3.60 3.19 0.1175
1.2460 0.157 0.157 0.289 3.85 3.09 0.1257
1.2115 0.150 0.150 0.439 3.78 3.12 0.1234
1.2061 0.157 0.157 0.595 3.98 3.30 0.1299
1.2025 0.149 0.149 0.745 3.80 3.16 0.1241
1.2236 0.157 0.157 0.902 3.94 3.22 0.1286
1.1545 0.144 0.144 0.739 3.81 3.30 0.1244
1.1763 0.149 0.149 0.888 3.87 3.29 0.1263
The Results of Analysis (2016)
Goal: It is the value of the passenger’s expectation of the services of the alloying mode terminals in meeting the customer’s needs. The passenger goal level is obtained from the average expectation values. Table 4 shows the complete calculation results of the passenger’s expectation level.
Improvement ratio: It is a measure of the efforts required to change the passenger’s satisfaction level in the existing conditions of the customer attributes to achieve the desired goals. The example of the calculation for improvement ratio on attribute number 1 is:
(1)
Goal 3.6 Im provement ratio 1.128
CSP 3.19
CSP : Customer Satisfaction Performance
Raw weight: Raw weightis a value describing the overall importance level of each passenger’s need based on the importance level for the passengers (important to customer) and improvement ratio. The example of the calculation for attribute number 1 is:
(2)
Raw weight Importance of cxustomer × (Improvement ratio)
0.117×1.128 0.132
Normalized raw weight: Normalized raw weight is the raw weight expressed in percentage or fractions between 0 and 1. The example of the calculation for attribute number 1 is:
Normalized raw weight0.132 13.2%
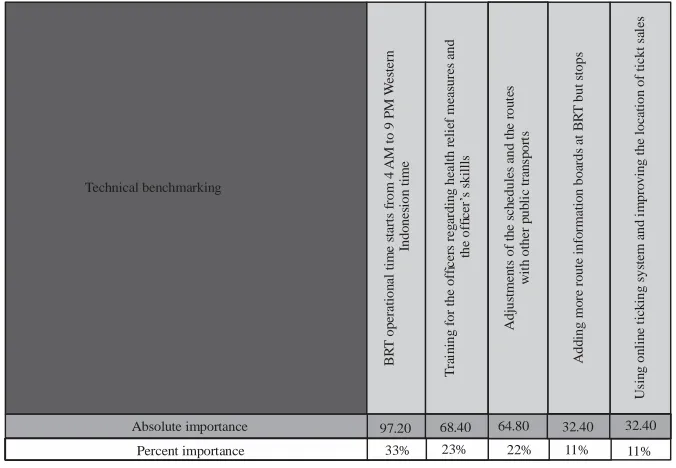
Determining technical responses: Technical responsesis the answer of voice of customer created by the management or the researcher to realize the customer’s needs. After the analysis is done by the technical teams and assisted by the department of transportation as the manager, some technical responses of BRT in Yogyakarta are obtained as follows:
Data of technical responses of BRT in Yogyakarta Technical responses:
C Adjustment and more departures of BRT.
C The improvement of the officer’s skills and capabilities
C The improvement of BRT integration with other transportations
C Adding more route information boards C The improvement of ticketing service system
The analysis of relationships: It is an assessment of the power of the correlation between each element of technical response in “Hows” with each voice of customer. The filling of this submatrix is very important when determining the priorities of the taken actions.
Technical correlations: The function of technical correlations is to know the extent of the correlations between technical responses whether the correlation is positive or negative.
[image:4.612.71.544.234.329.2]BR T op erati o n al t im e s tarts f ro m 4 A M to 9 P M W es ter n I n do nes io n t im e T ra in in g f o
r the of
cer s reg ar d in g h eal th r eli ef me as ur es a n d t h e o f ce r’ s sk illl s A d ju st m e nt s o f t h e s c he d u le s an d t h e ro u tes w it h ot her p u b li c t ra n sp or ts A d d ing m o re ro ut e in fo rm at io n b o ard s at B R T bu t s top s U sin g o n li n e t ic k in g s y st em a n d i m p ro v in g th e lo ca tio n o f t ick t s al es Absolute importance Percent importance 97.20 33% 68.40 23% 64.80
[image:5.612.138.476.97.331.2]22% 11% 11% 32.40 32.40 Technical benchmarking f f i i
Fig. 2: Technical matrix of BRT in Yogyakarta
order for attributes in the technical responses. Figure 2 is the technical matrix that the researchers made.
CONCLUSION
The better the management of BRT is the more the performance of BRT will directly improve. The better the policy of BRT is the more the performance of BRT will directly improve.
The better the quality of BRT management is the more the quality of BRT service will directly improve. The better the policy of BRT is the more the quality of BRT service will directly improve. Improving the quality of BRT management and policy will directly enhance the performance of BRT and indirectly will affect the improvement of the service quality.
SUGGESTIONS
It is recommended that further research on the review of BRT performance improvement is conducted in all areas of Indonesia that provide BRT as a facility of mass
public transport, so that, it can be used as the guidelines for the implementation of BRT in Indonesia.
REFERENCES
Jotin, K.C. and B.K. Lall, 2006. [Fundamentals of Transport Engineering]. Penerbit Erlangga, Jakarta, Indonesia, (In Indonesia).
Levinson, H., 2003. Bus rapid transit Volume 1: Case studies in bus rapid transit. Transportation Research Board, Washington, USA.
Lumintang, G.Y.B., L.I.R. Lefrandt, J.A. Timboeleng and M.R.E. Manoppo, 2013. [Performance of traffic arrangements of four bersignal (Case study: Jalan Walanda Maradis Manado CROSSING) (In Indonesian)]. Static Civil J., Vol. 1,
Ofyar, T., 2000. [Transportation Planning and Modeling]. Institut Teknologi Bandung, Bandung, Indonesia, (In Indonesia).
Riduwan and A.E. Kuncoro, 2008. [How to use and Mean Path Analysis (Path Analysis)]. Penerbit Alfabeta, Bandung, Indonesia, (In Indonesia).